-
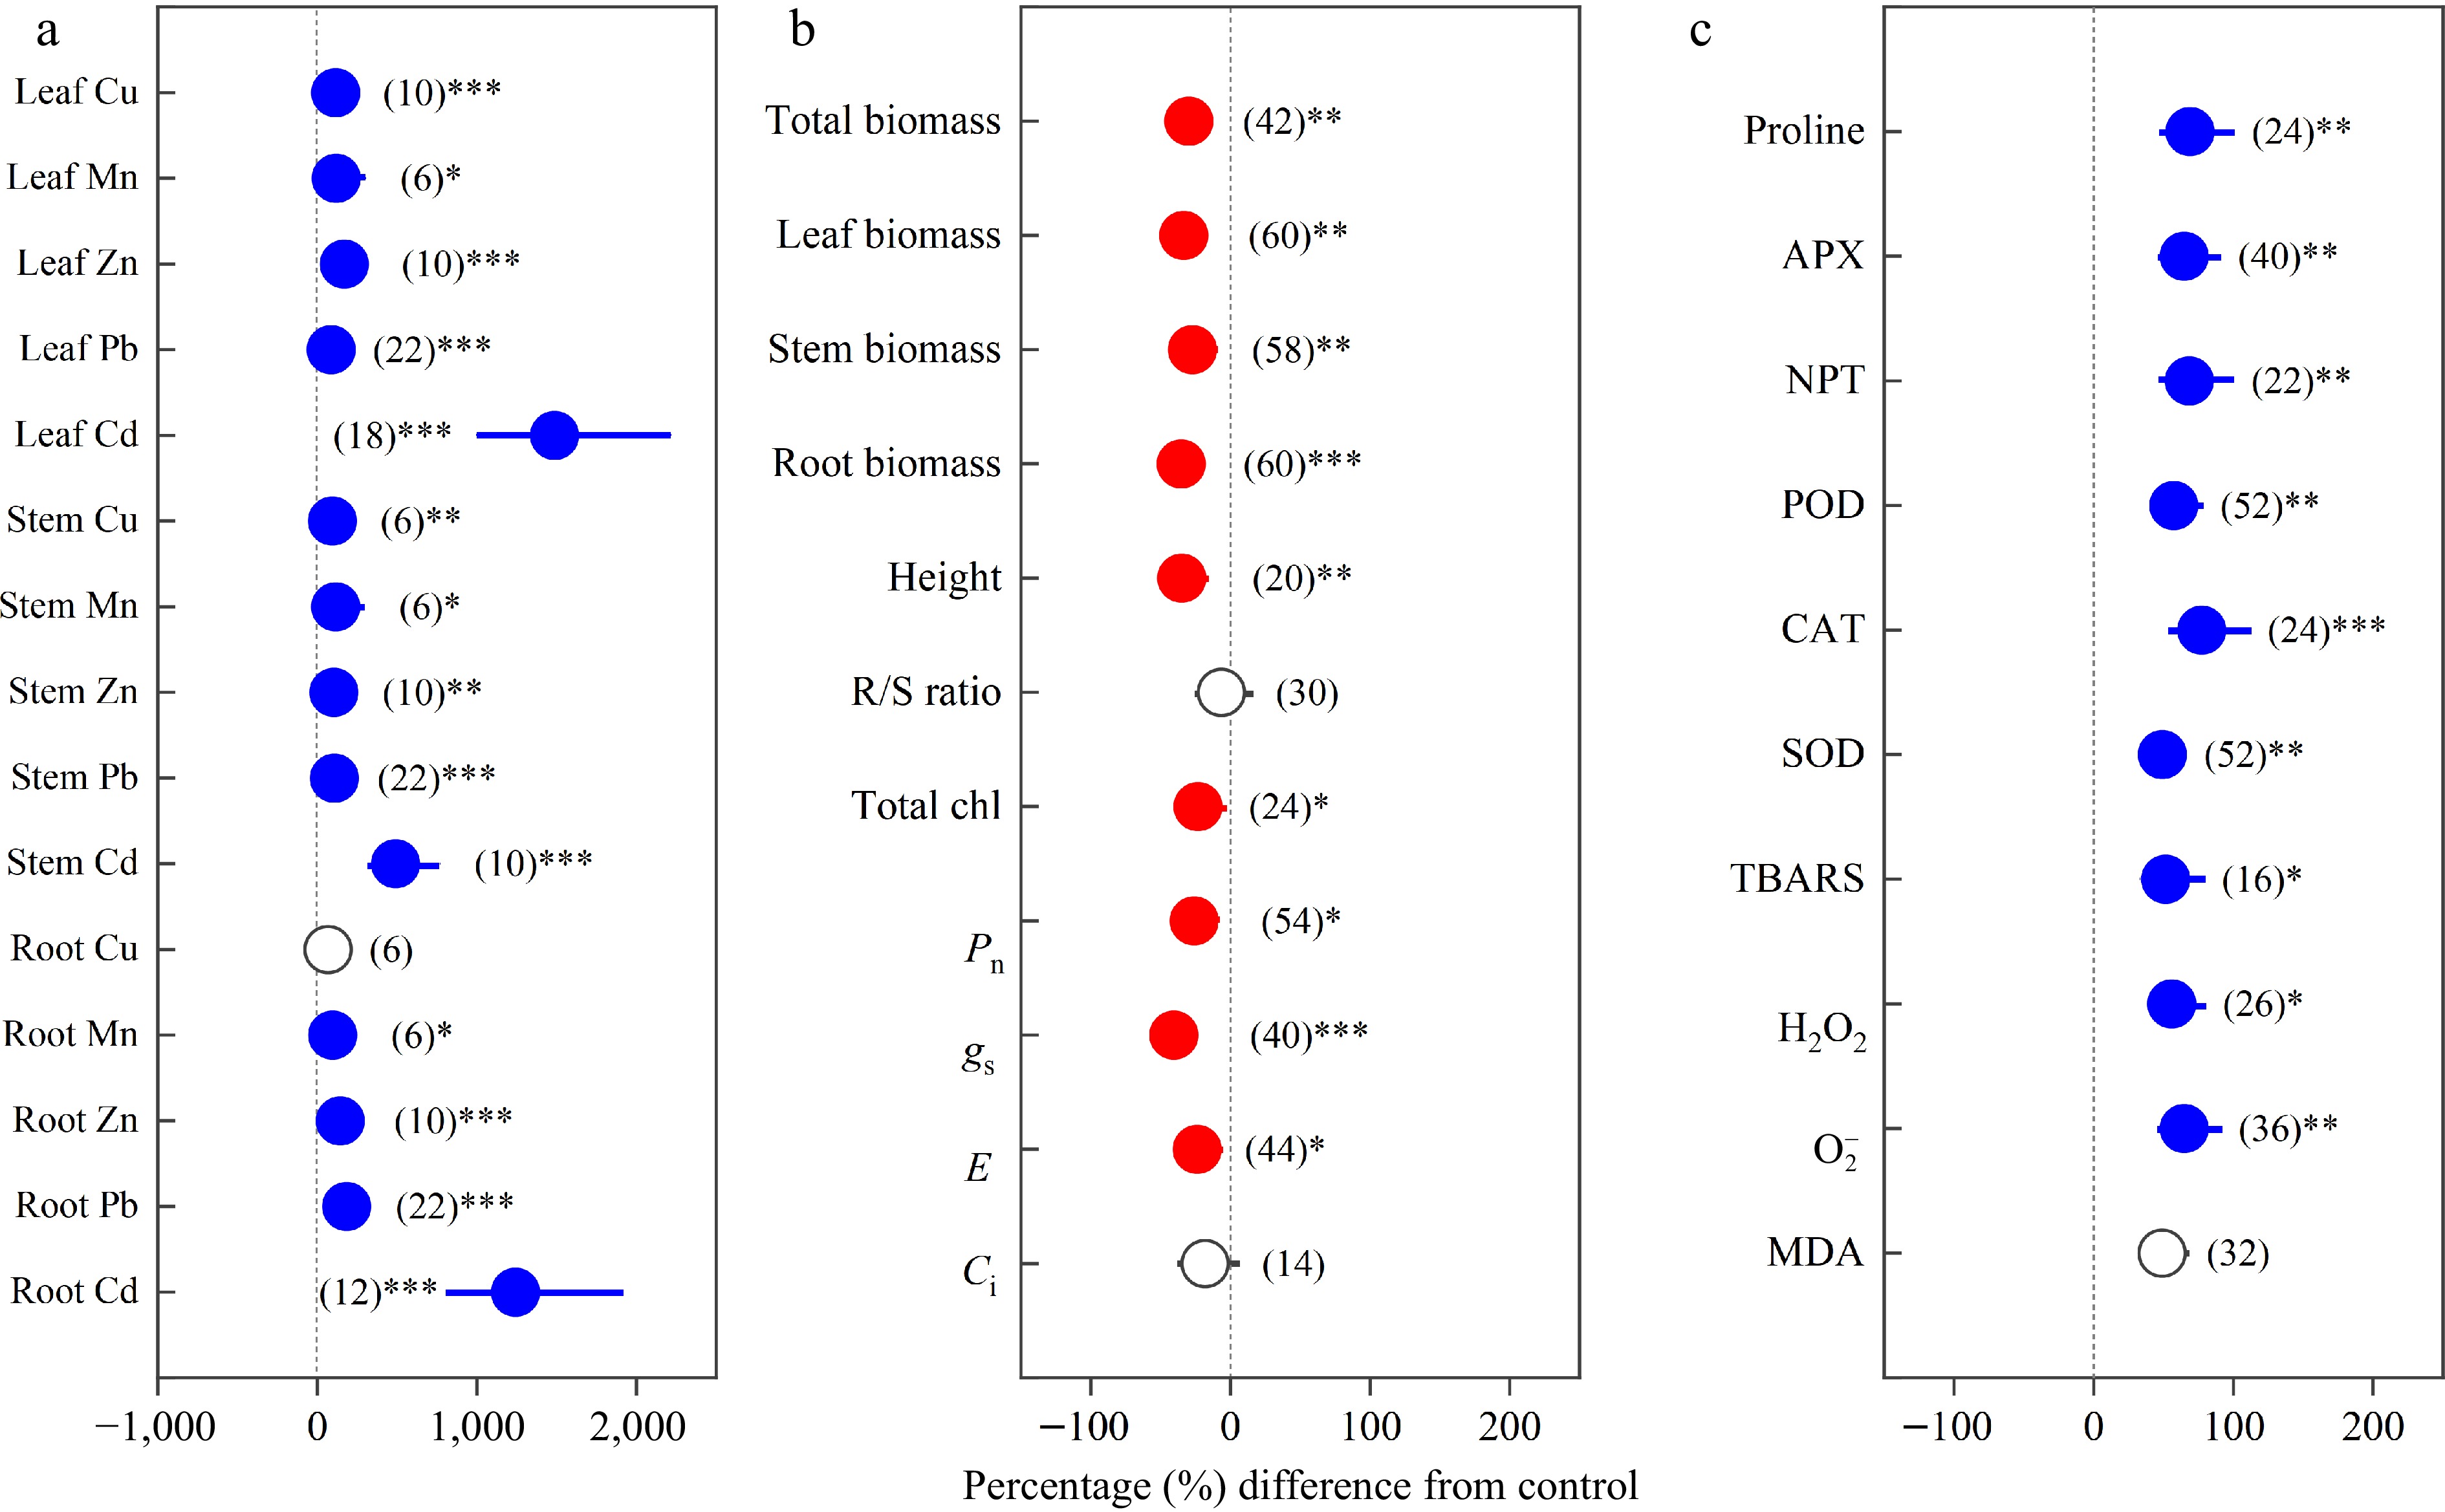
Figure 1.
Overall effects of heavy metals on the concentrations of (a) Cu, Mn, Zn, Pb, Cd in leaf, stem and root; (b) total biomass, leaf biomass, stem biomass, root biomass, height, R/S ratio, total chl, Pn, gs, E and Ci; (c) proline, APX, NPT, POD, CAT, SOD, TBARS, H2O2,
${\text{O}^-_2} $ -
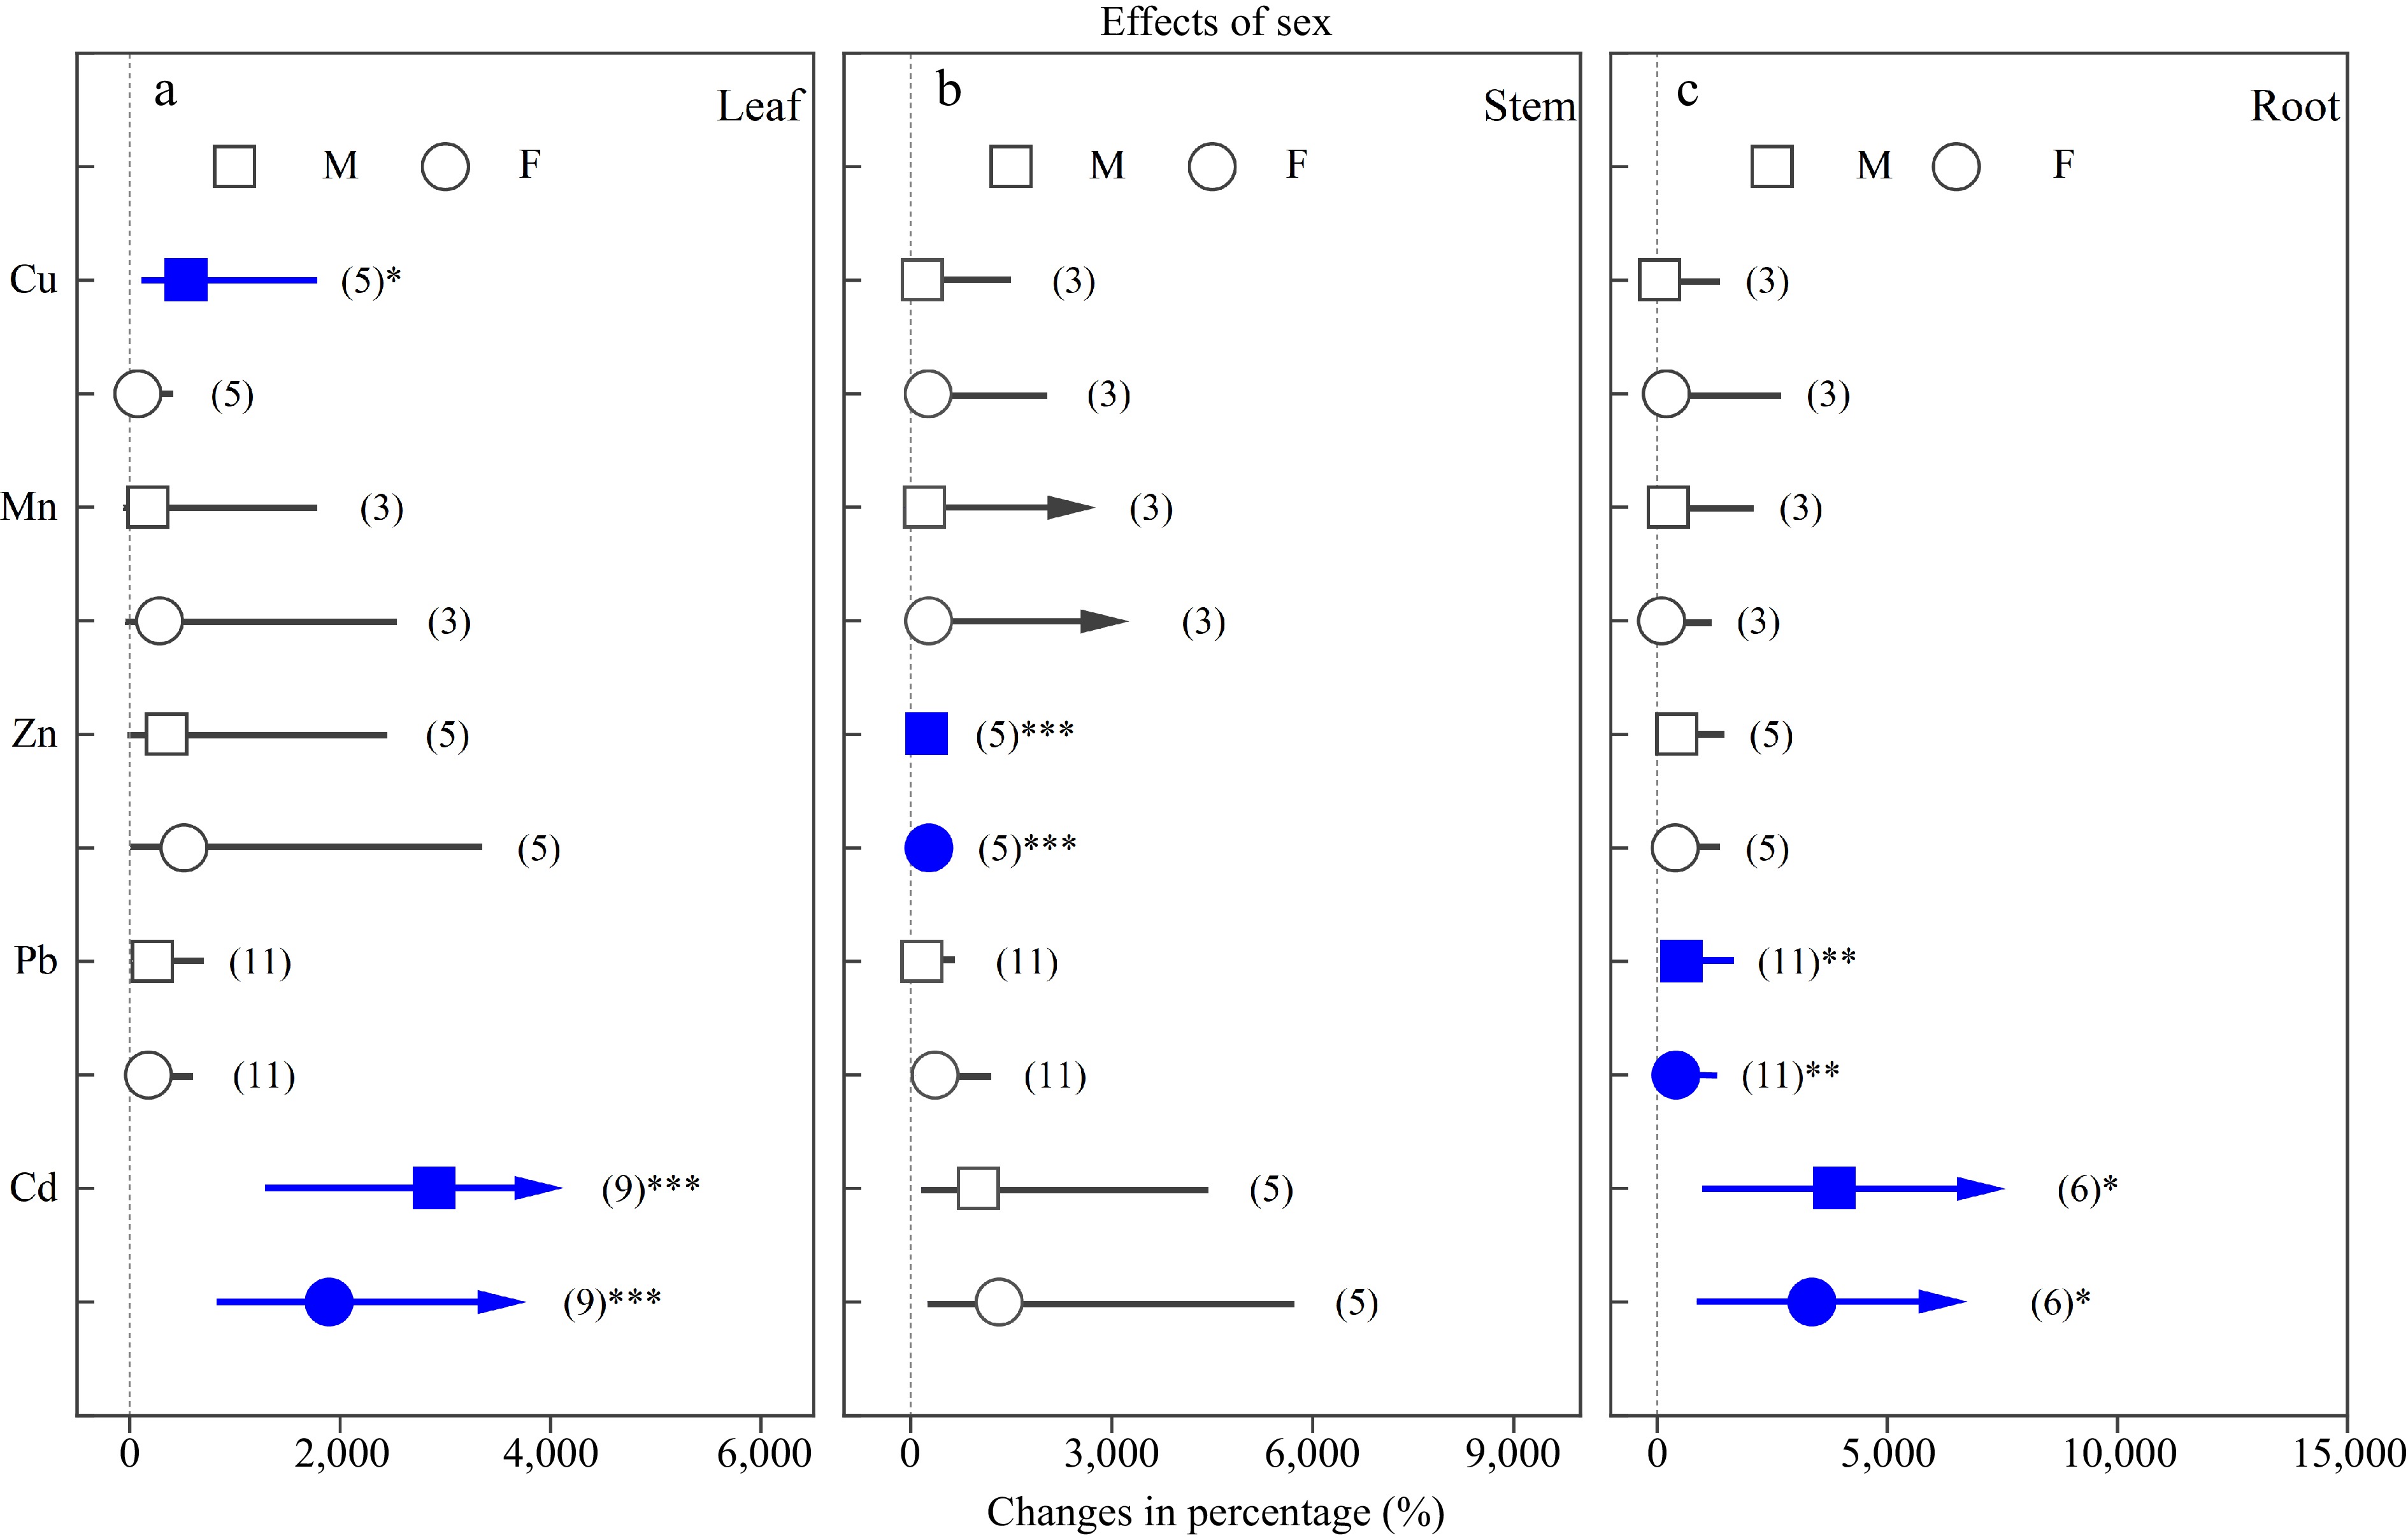
Figure 2.
Impacts of sex on the effects of heavy metals on the concentrations of Cu, Mn, Zn, Pb and Cd in (a) leaf, (b) stem and (c) root. Values are means with 95% confidence intervals. The blue color indicates significant positive effects.*p < 0.05,**p < 0.01,*** p < 0.001.
-
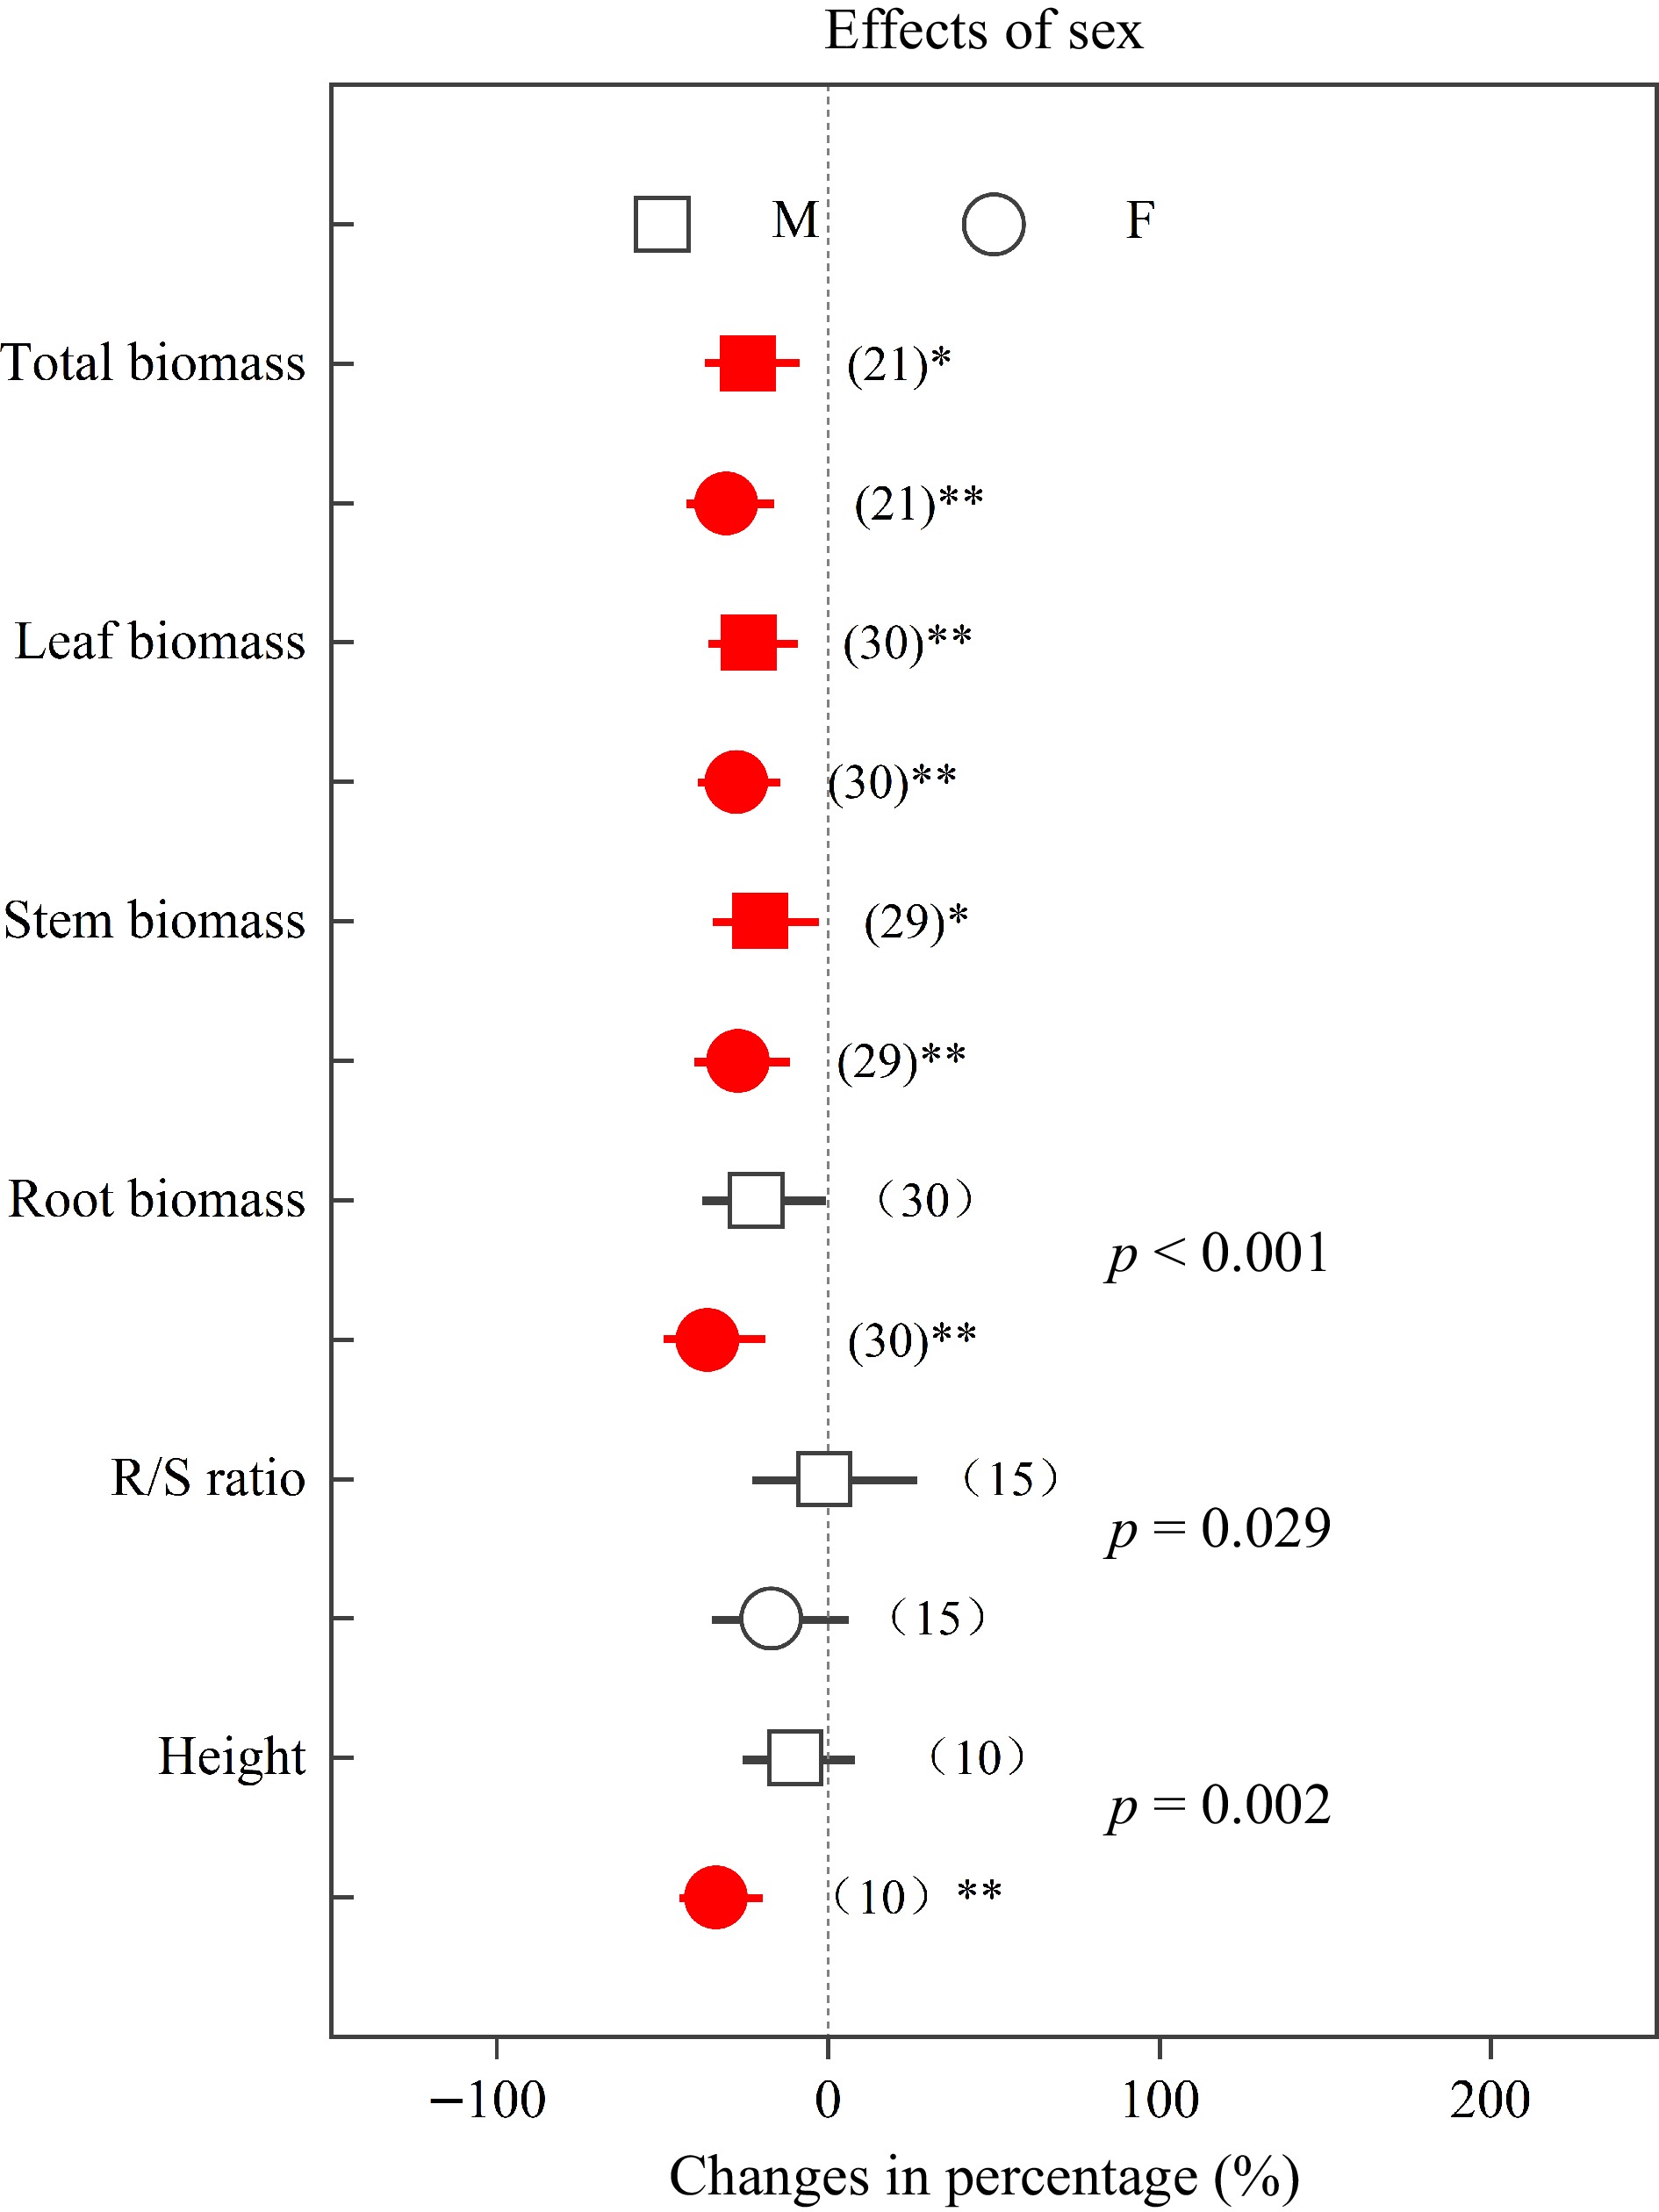
Figure 3.
Impacts of sex on the effects of heavy metals on total biomass, leaf biomass, stem biomass, root biomass, R/S ratio and height. Values are means with 95% confidence intervals. The p-values indicate differences between Populus sexes, and the red color indicates significant negative effects.*p < 0.05,**p < 0.01,*** p < 0.001.
-
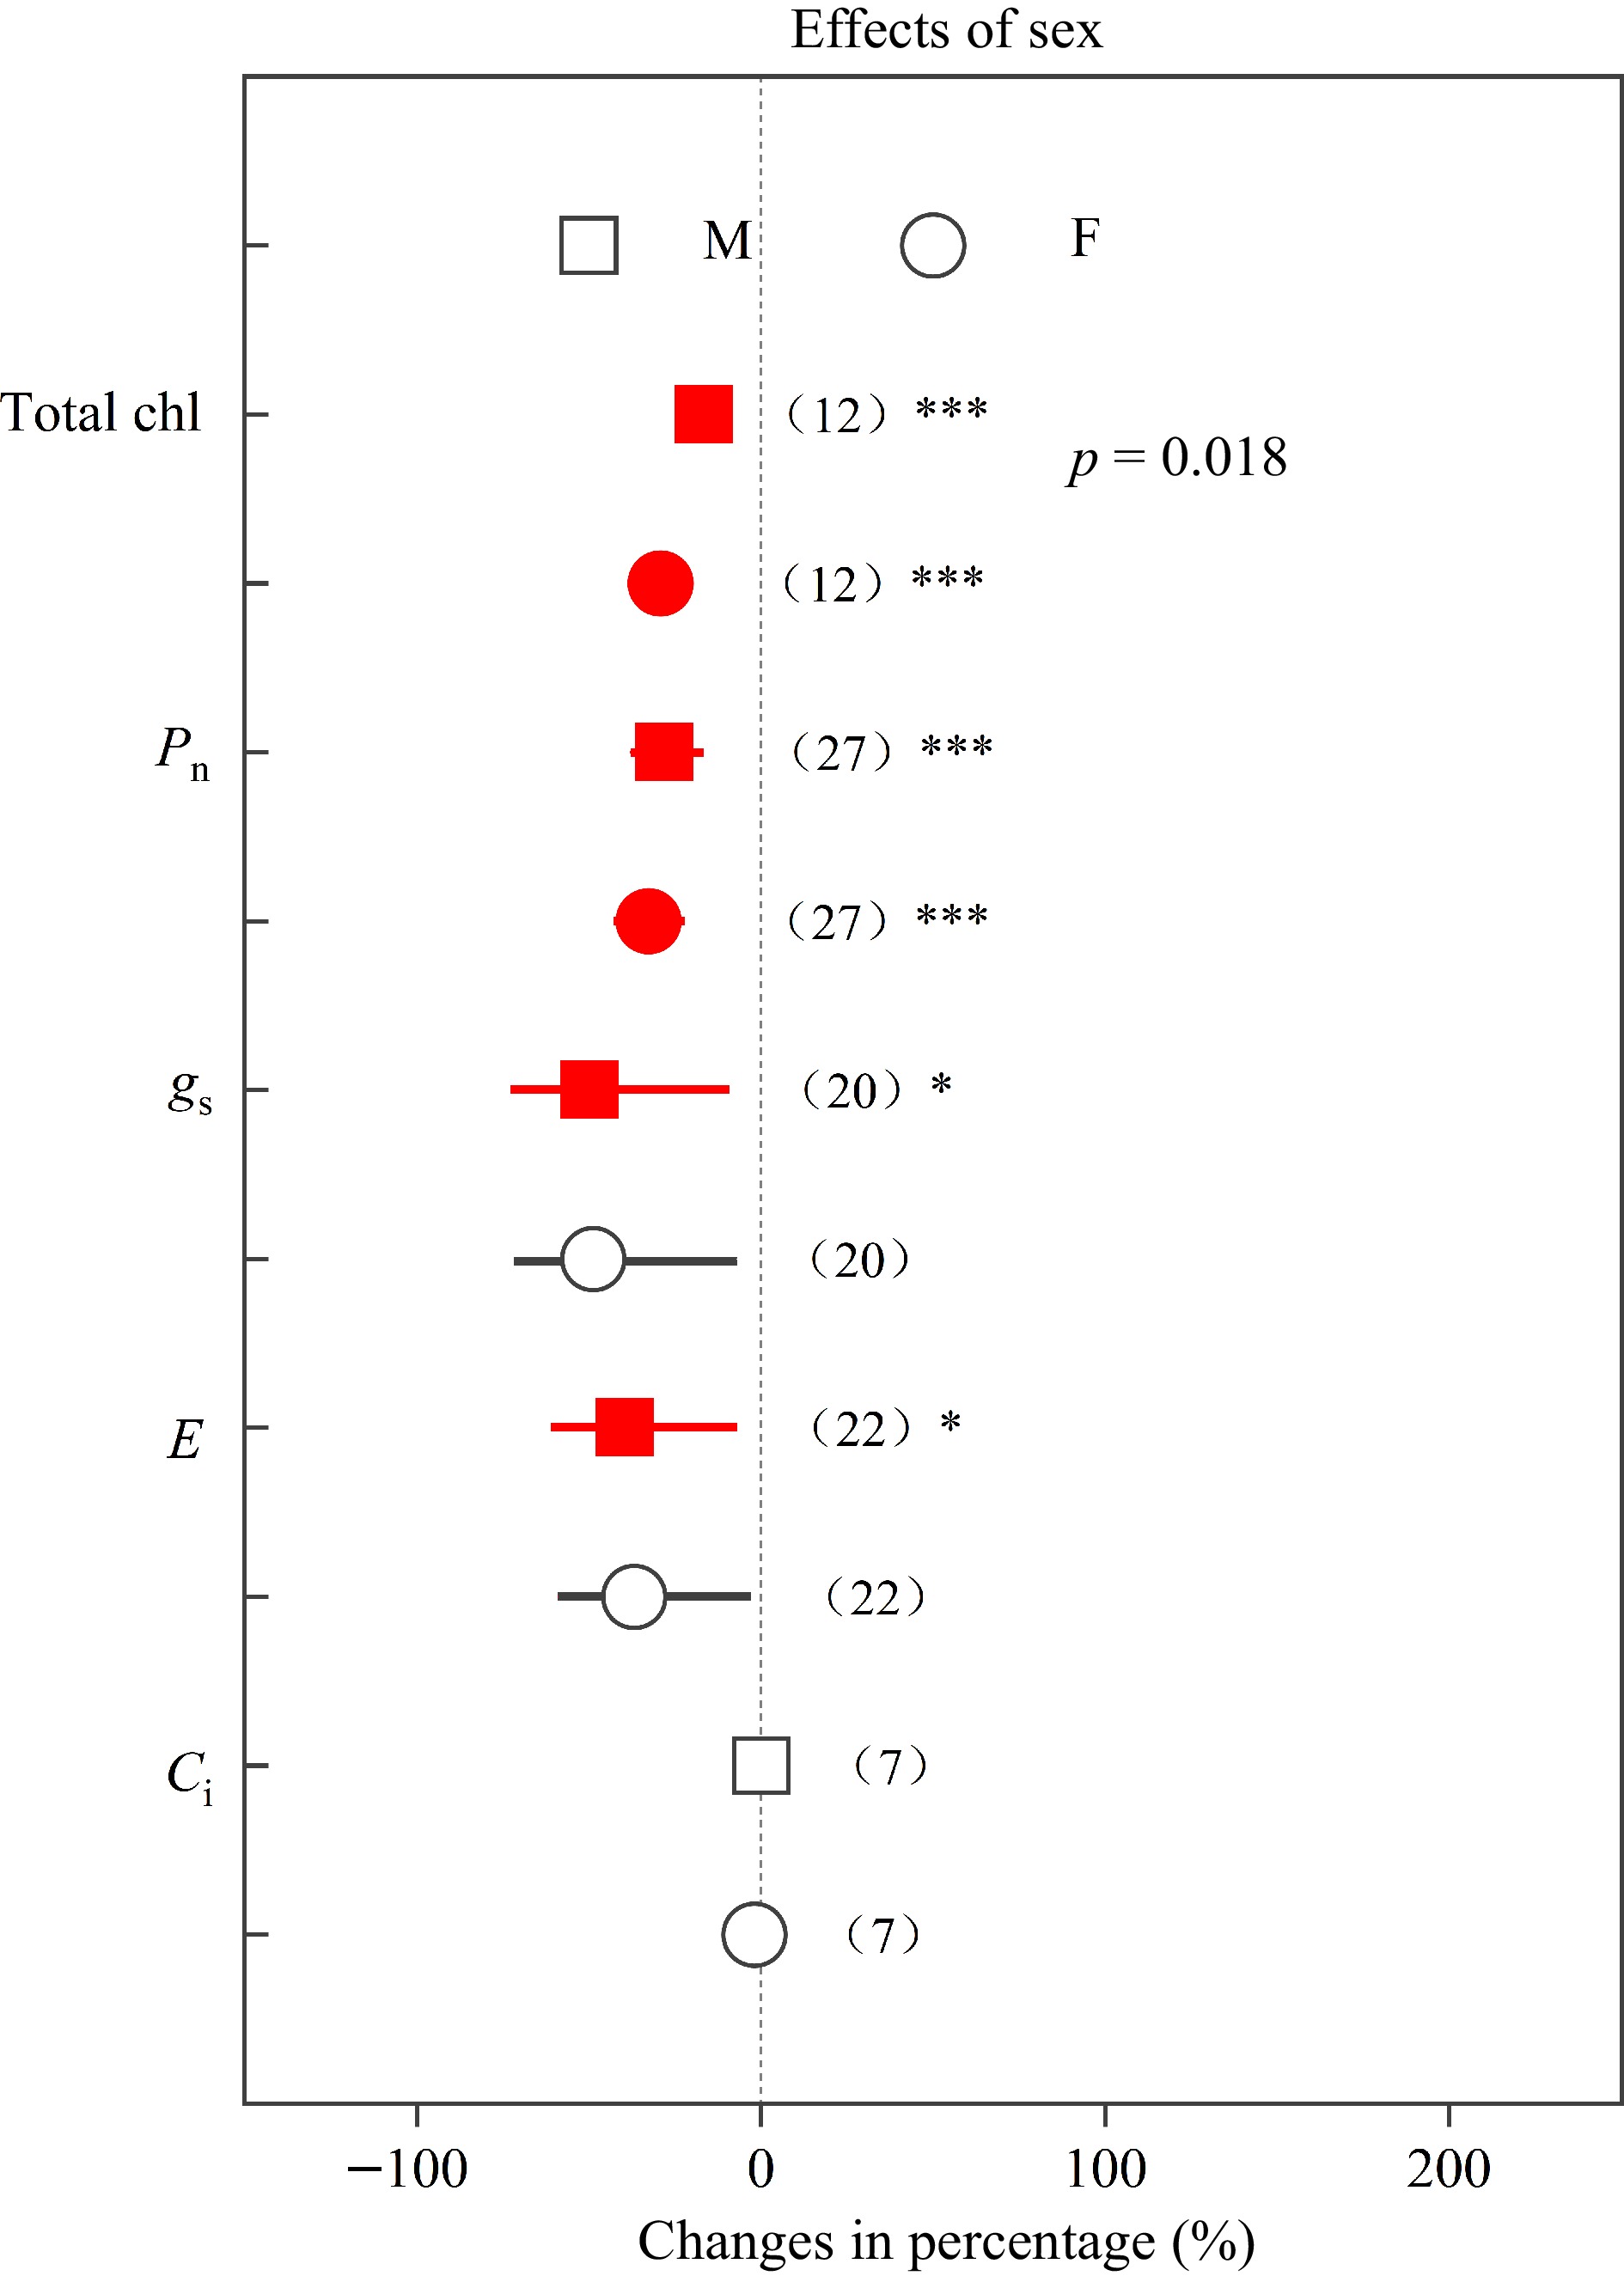
Figure 4.
Impacts of sex on the effects of heavy metals on total chl, Pn, gs , E and Ci. Values are means with 95% confidence intervals. The p-values indicate differences between Populus sexes, and the red color indicates significant negative effects.*p < 0.05,**p < 0.01,*** p < 0.001.
-
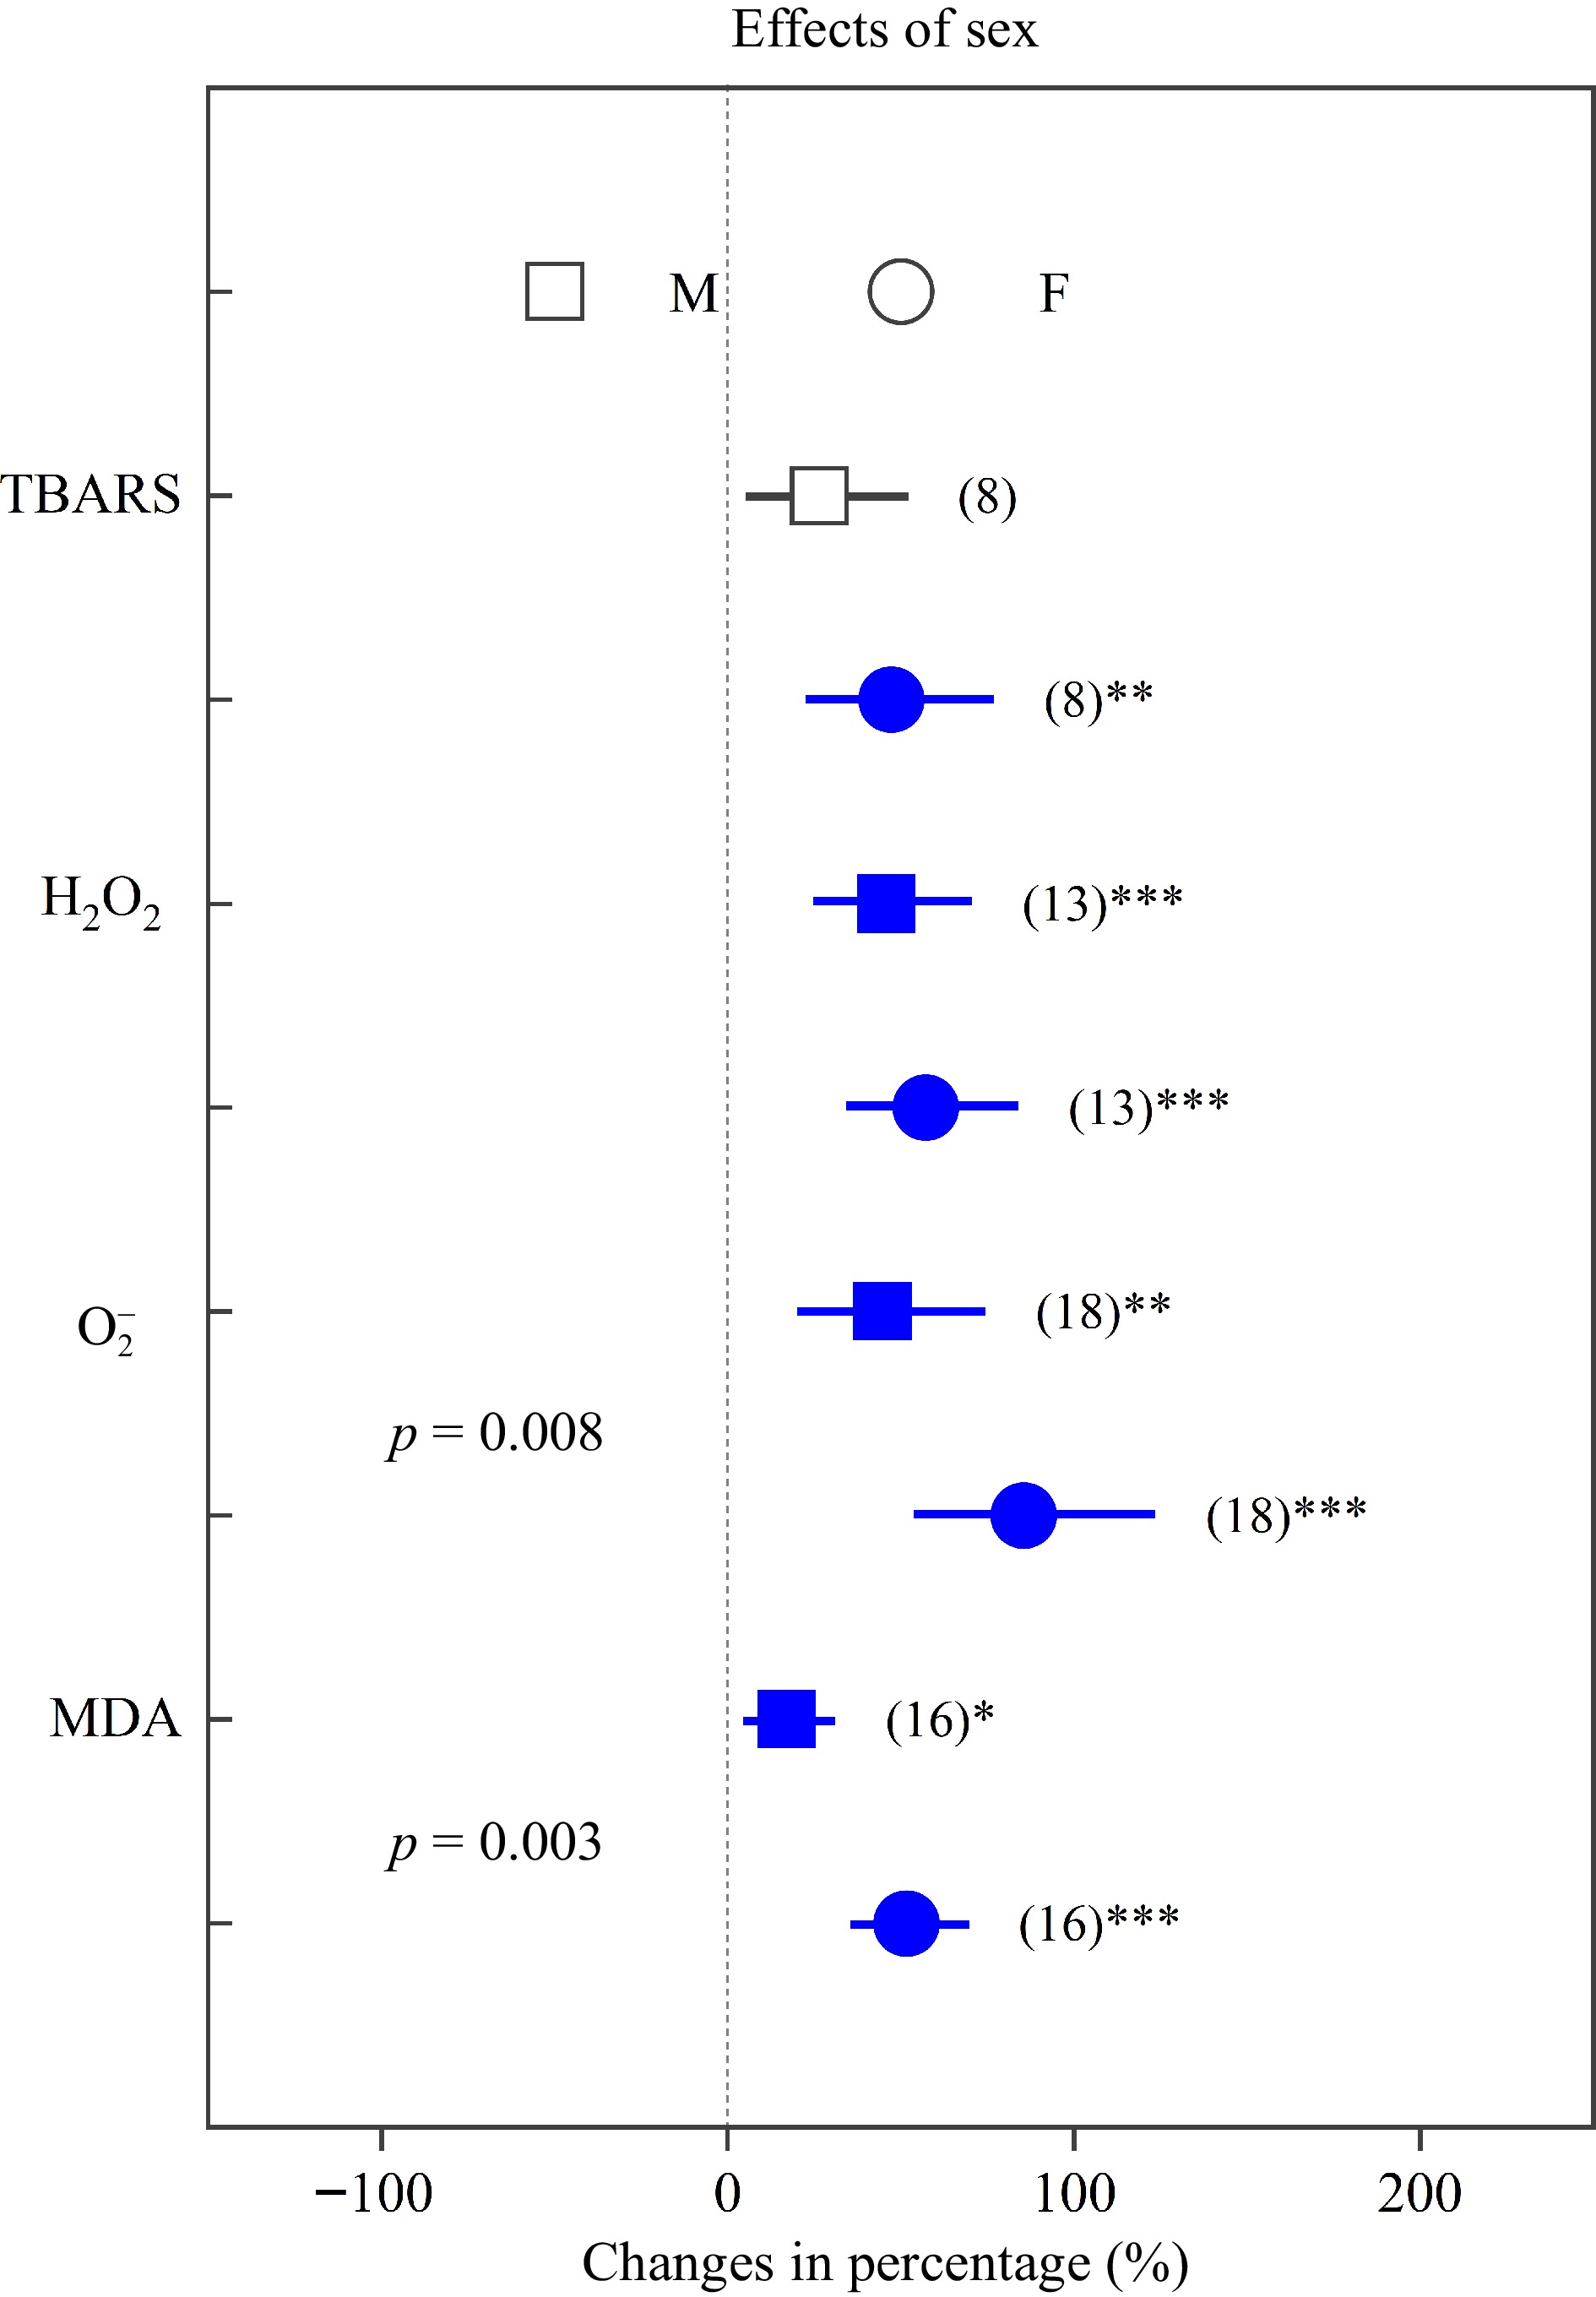
Figure 5.
Impacts of sex on the effects of heavy metals on the concentrations of TBARS, H2O2,
${\text{O}^-_2} $ -
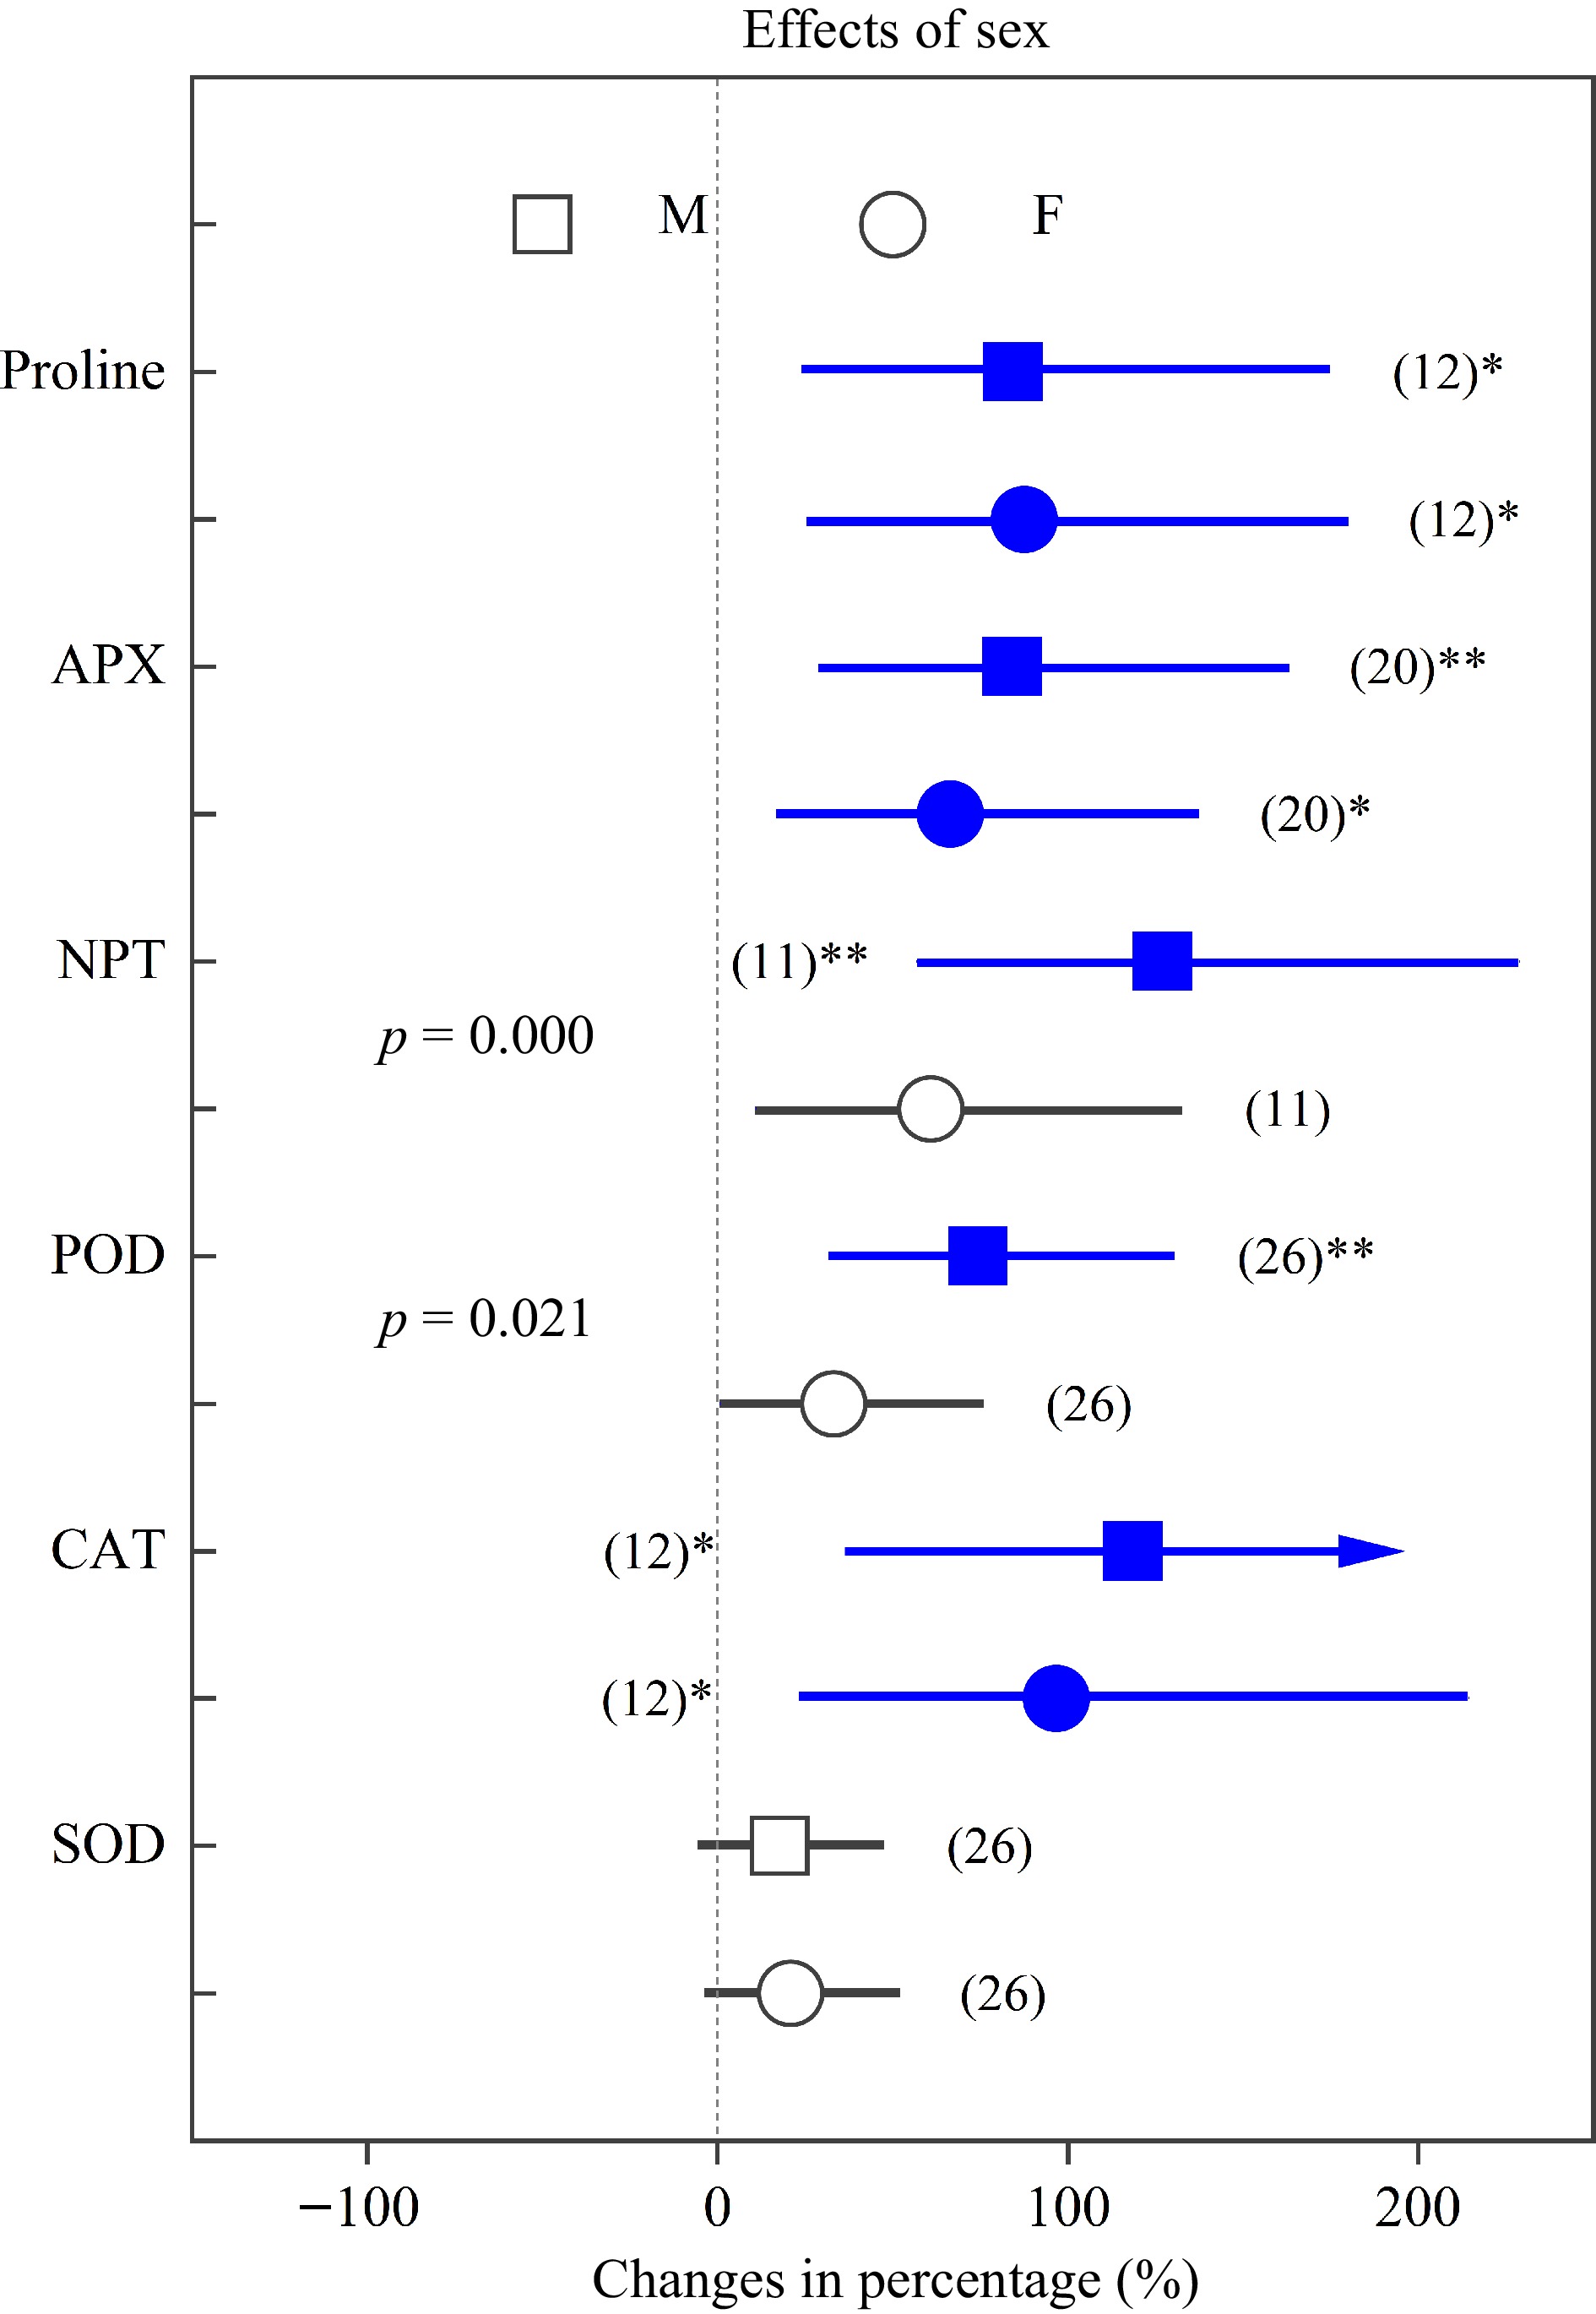
Figure 6.
Impacts of sex on the effects of heavy metals on the concentrations of proline, APX, NPT, POD, CAT and SOD. Values are means with 95% confidence intervals. The p-values indicate differences between Populus sexes, and the blue color indicates significant positive effects.*p < 0.05,**p < 0.01,*** p < 0.001.
Figures
(6)
Tables
(0)