-

Figure 1.
The length distribution and family of miRNAs identified in apple. (a) Length distribution of known and novel miRNAs. (b) Secondary structures of some novel miRNAs (Novel miR6, Novel miR16, and Novel miR158). (c) Analysis of the miRNA family.
-
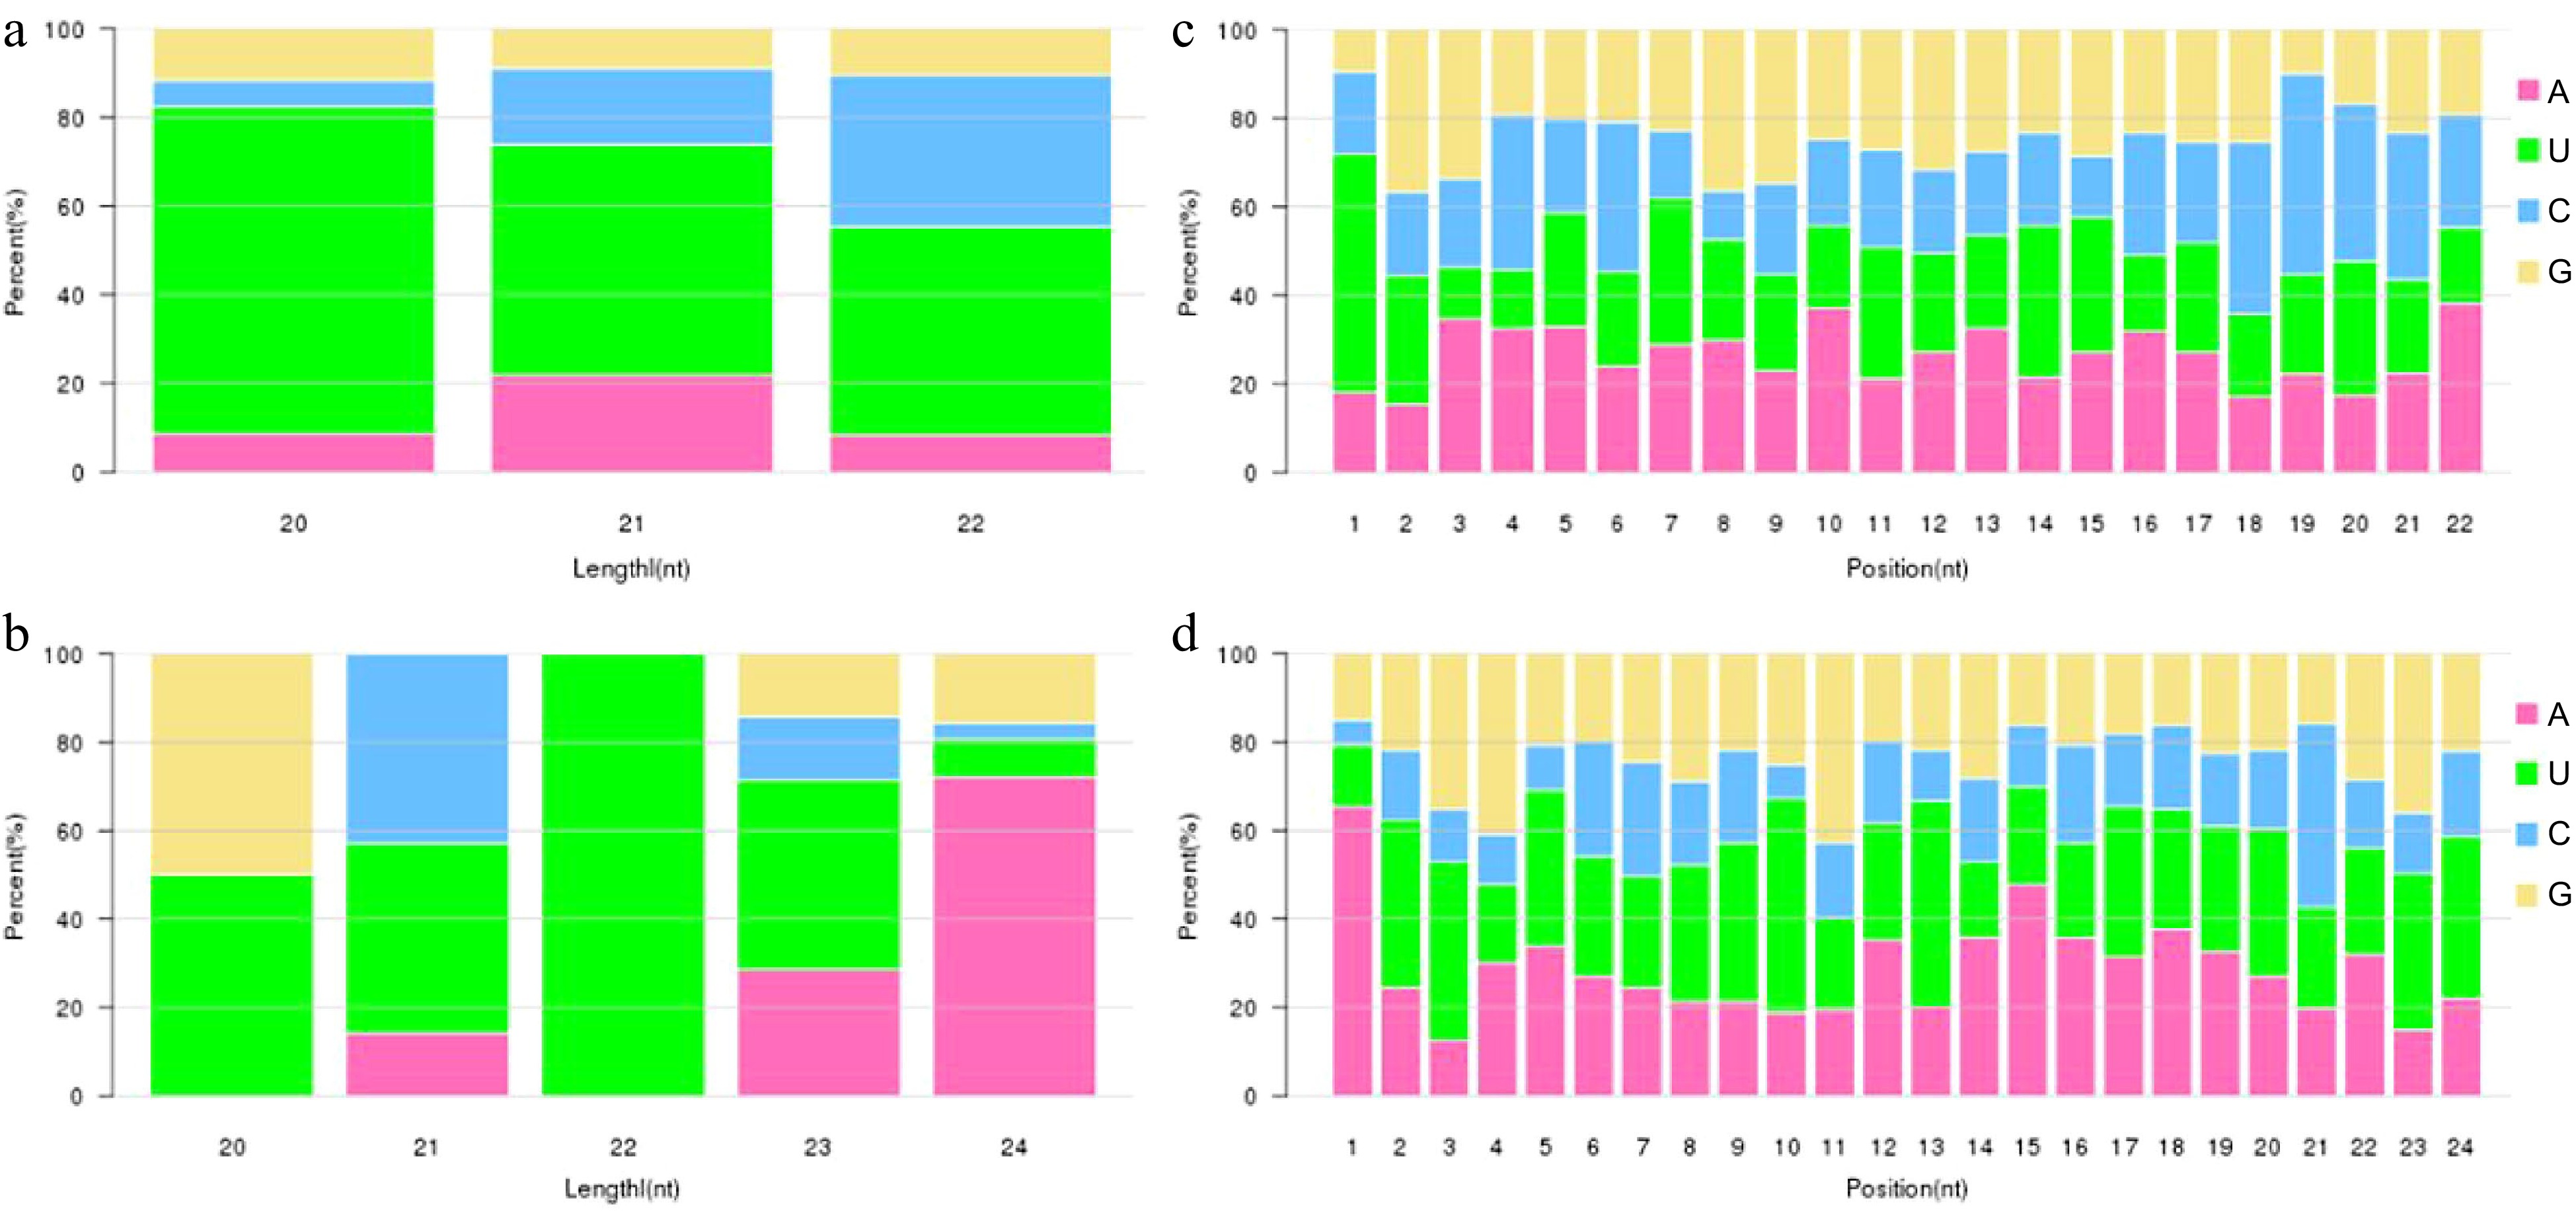
Figure 2.
Analysis of the miRNA nucleotide bias. (a), (b) First base preference of known and novel miRNA in different length, respectively. (c), (d) Base preference on known and novel miRNA at each position, respectively.
-
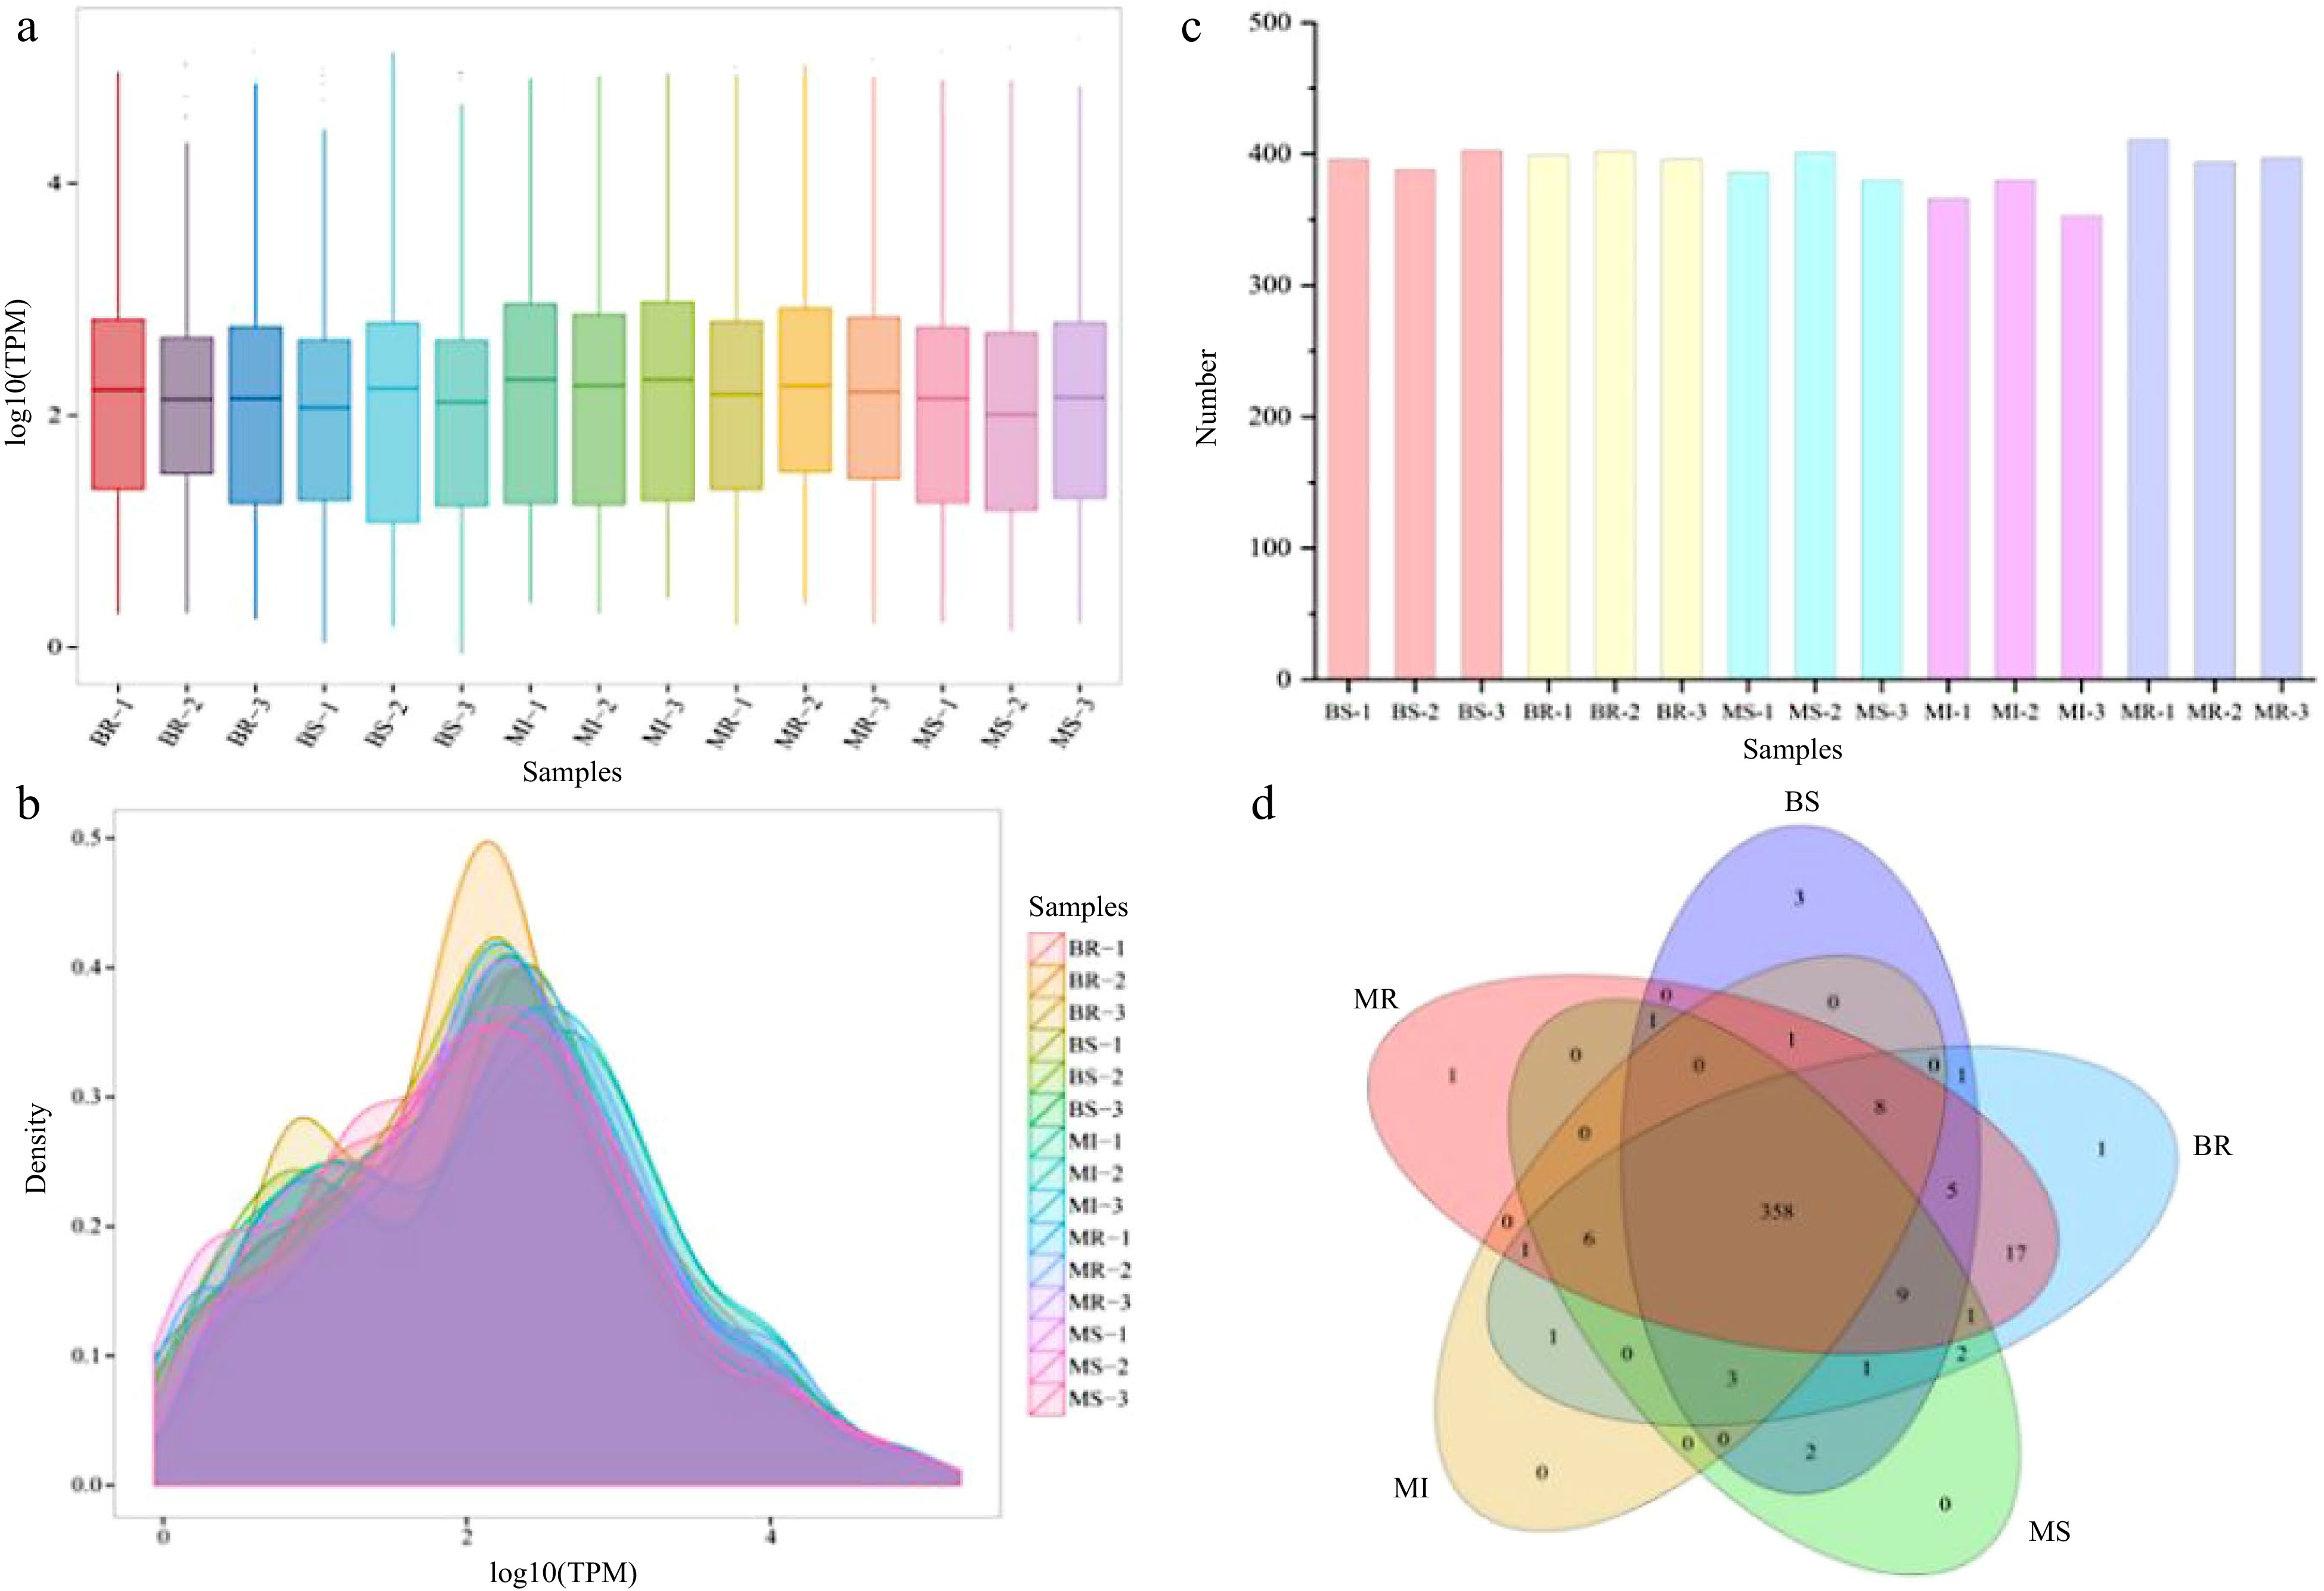
Figure 3.
Analysis of the miRNA expression status in each sample. (a) Boxplot of the overall distribution of miRNA expression in each sample. (b) TPM density distribution (the curves with different colors in the figure represent different samples, the abscissa of the point on the curve represents the logarithm value of the corresponding sample TPM, and the ordinate of the point represents the probability density). (c) Number of miRNA statistics in each sample. (d) Venn analysis of miRNAs in each combination (the number of miRNAs in each combination were taken as three repeated union sets).
-

Figure 4.
The analysis of the miRNA’s target genes. (a) NR homologous species distribution. (b) KEGG pathway enrichment analysis. (Y-axis: name of KEGG pathway annotation; X-axis: number and percentage of genes involved in this pathway over counts of all annotated genes). (c) GO annotation classification statistics. (d) COG function classification of consensus sequence (X-axis: the COG functional classifications; Y-axis: the functional categories corresponding to each classification).
-

Figure 5.
The analysis of the DEMs in each sample. (a) Number of DEMs in each group. (b) Venn diagram analysis of DEMs (different colors represent different comparison combinations). (c) Heat map of DEMs with BR vs MR. (d) Heat map of DEMs with BS vs MS.
-
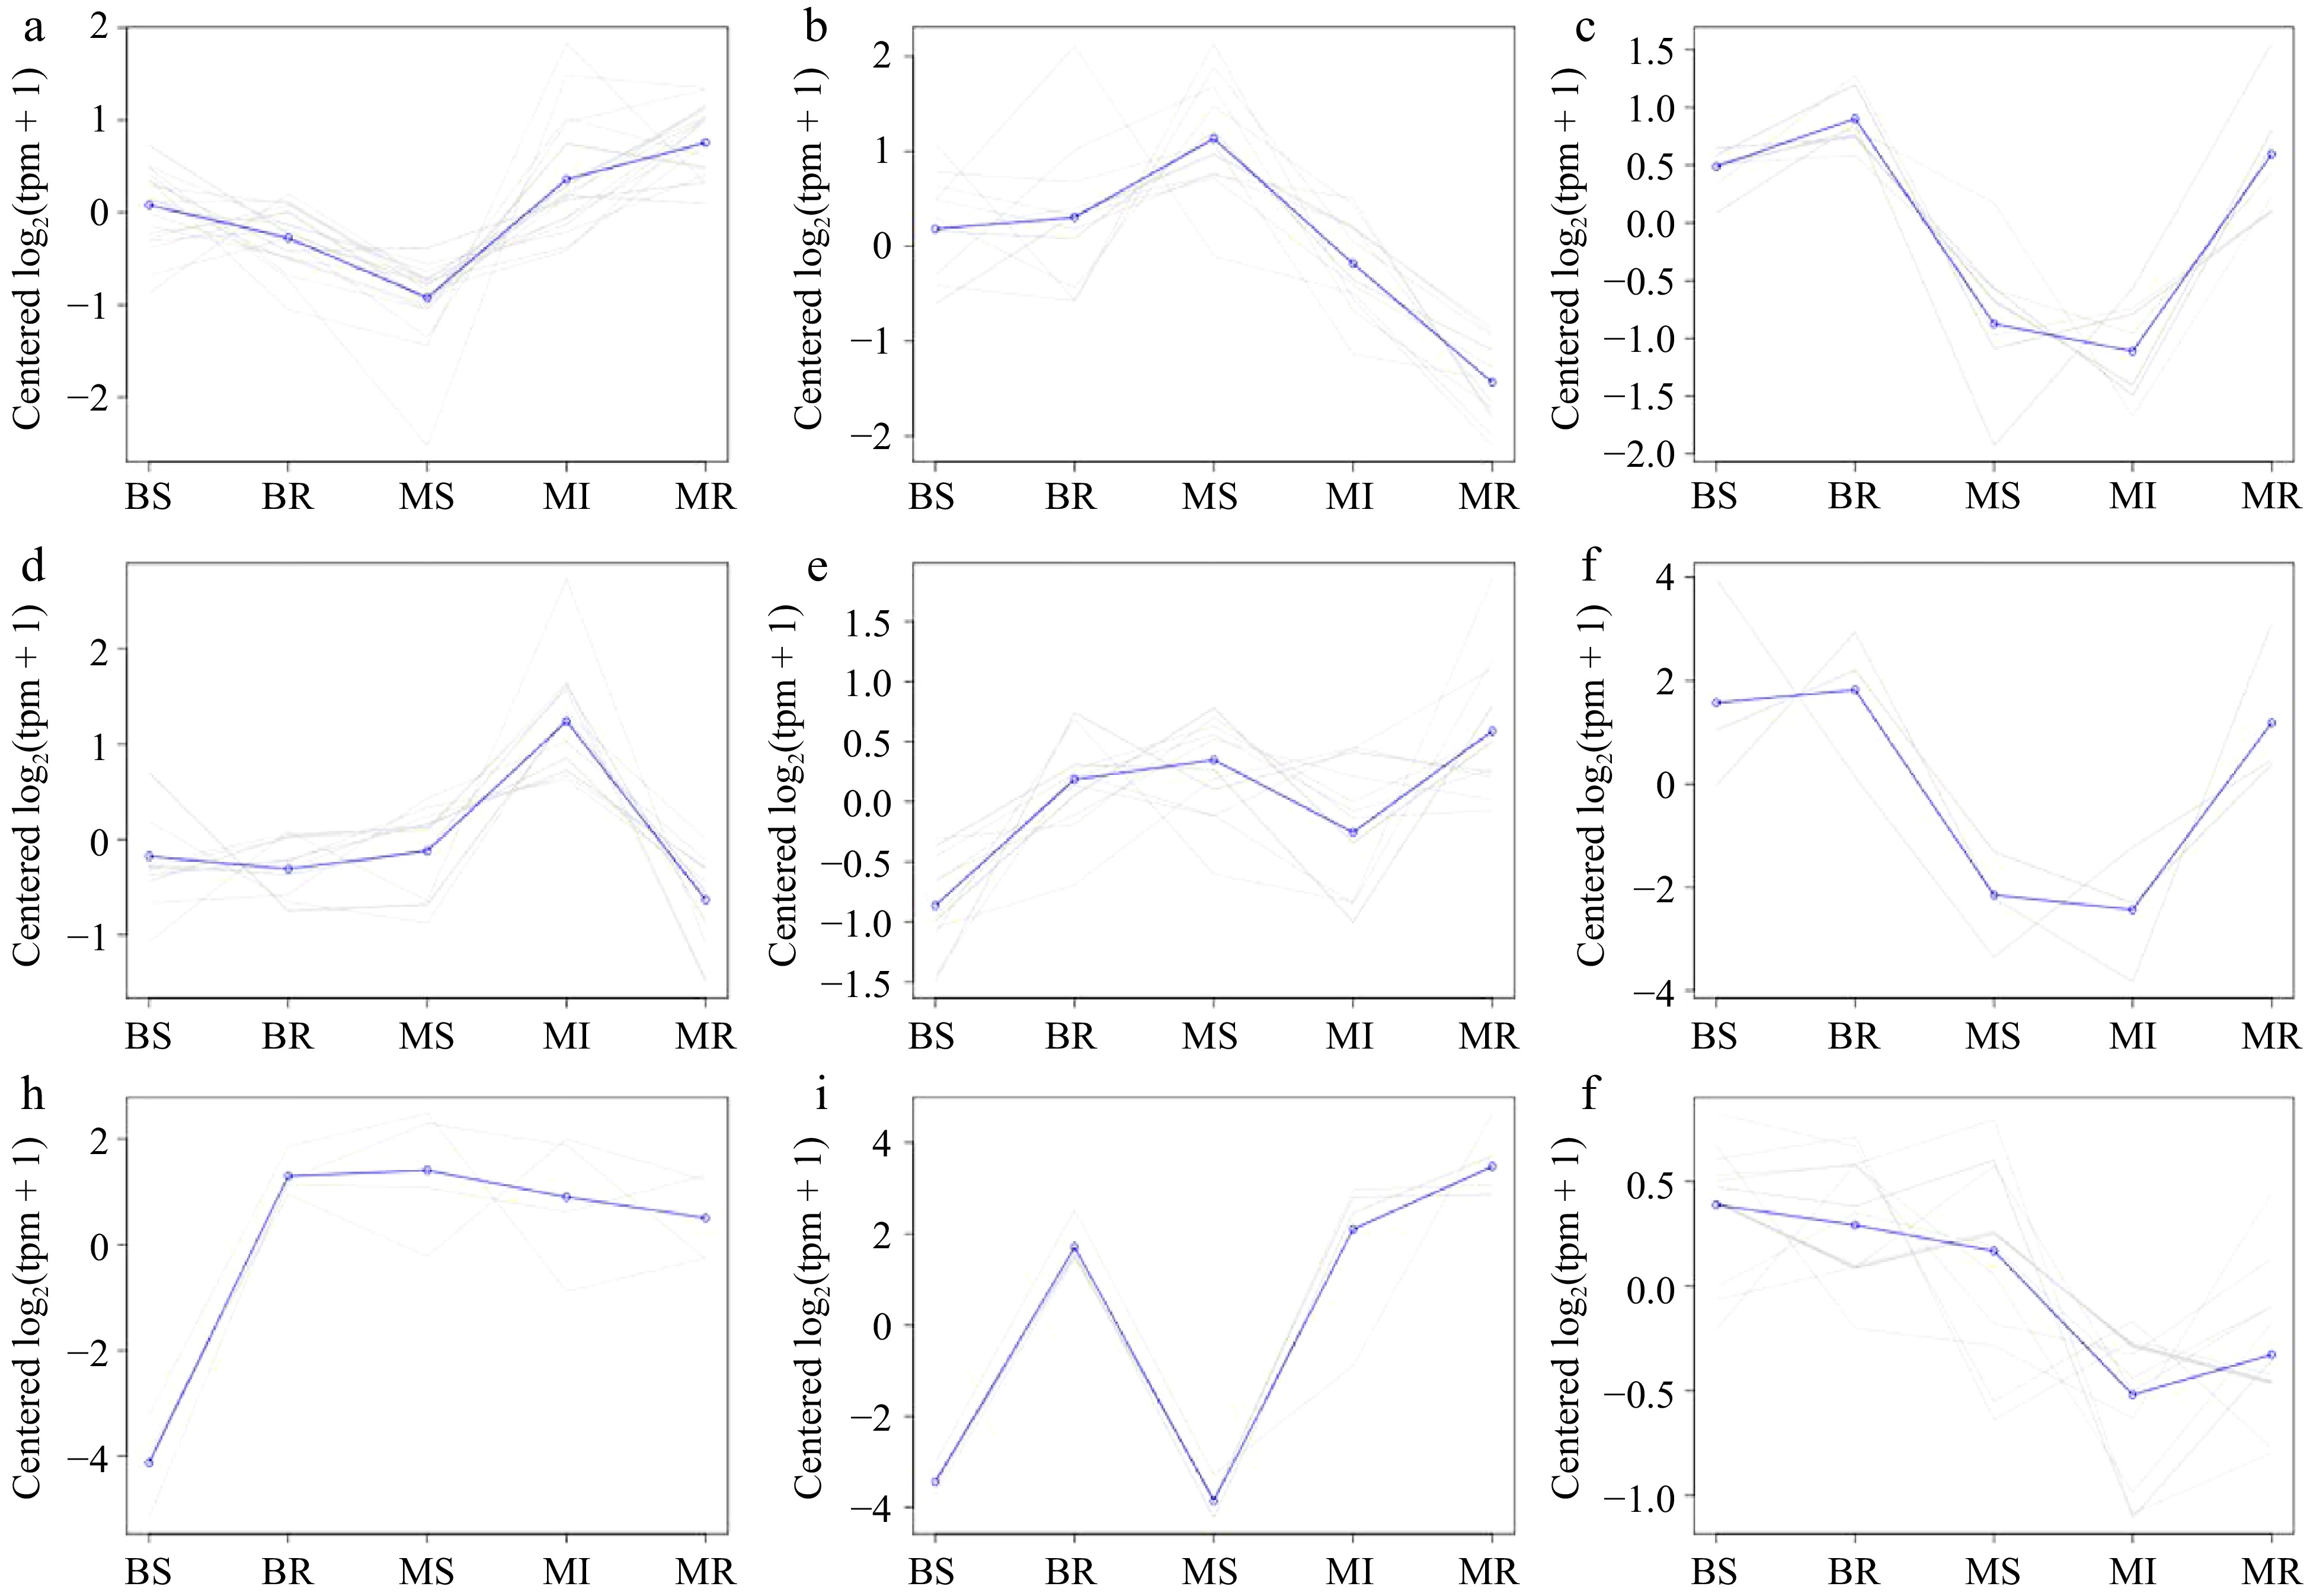
Figure 6.
A co-expression trend analysis of the miRNAs in each sample. (a)−(j) Results plots for each class of the co-expression trend clustering in all DEMs with Cluster 1−9, respectively.
-
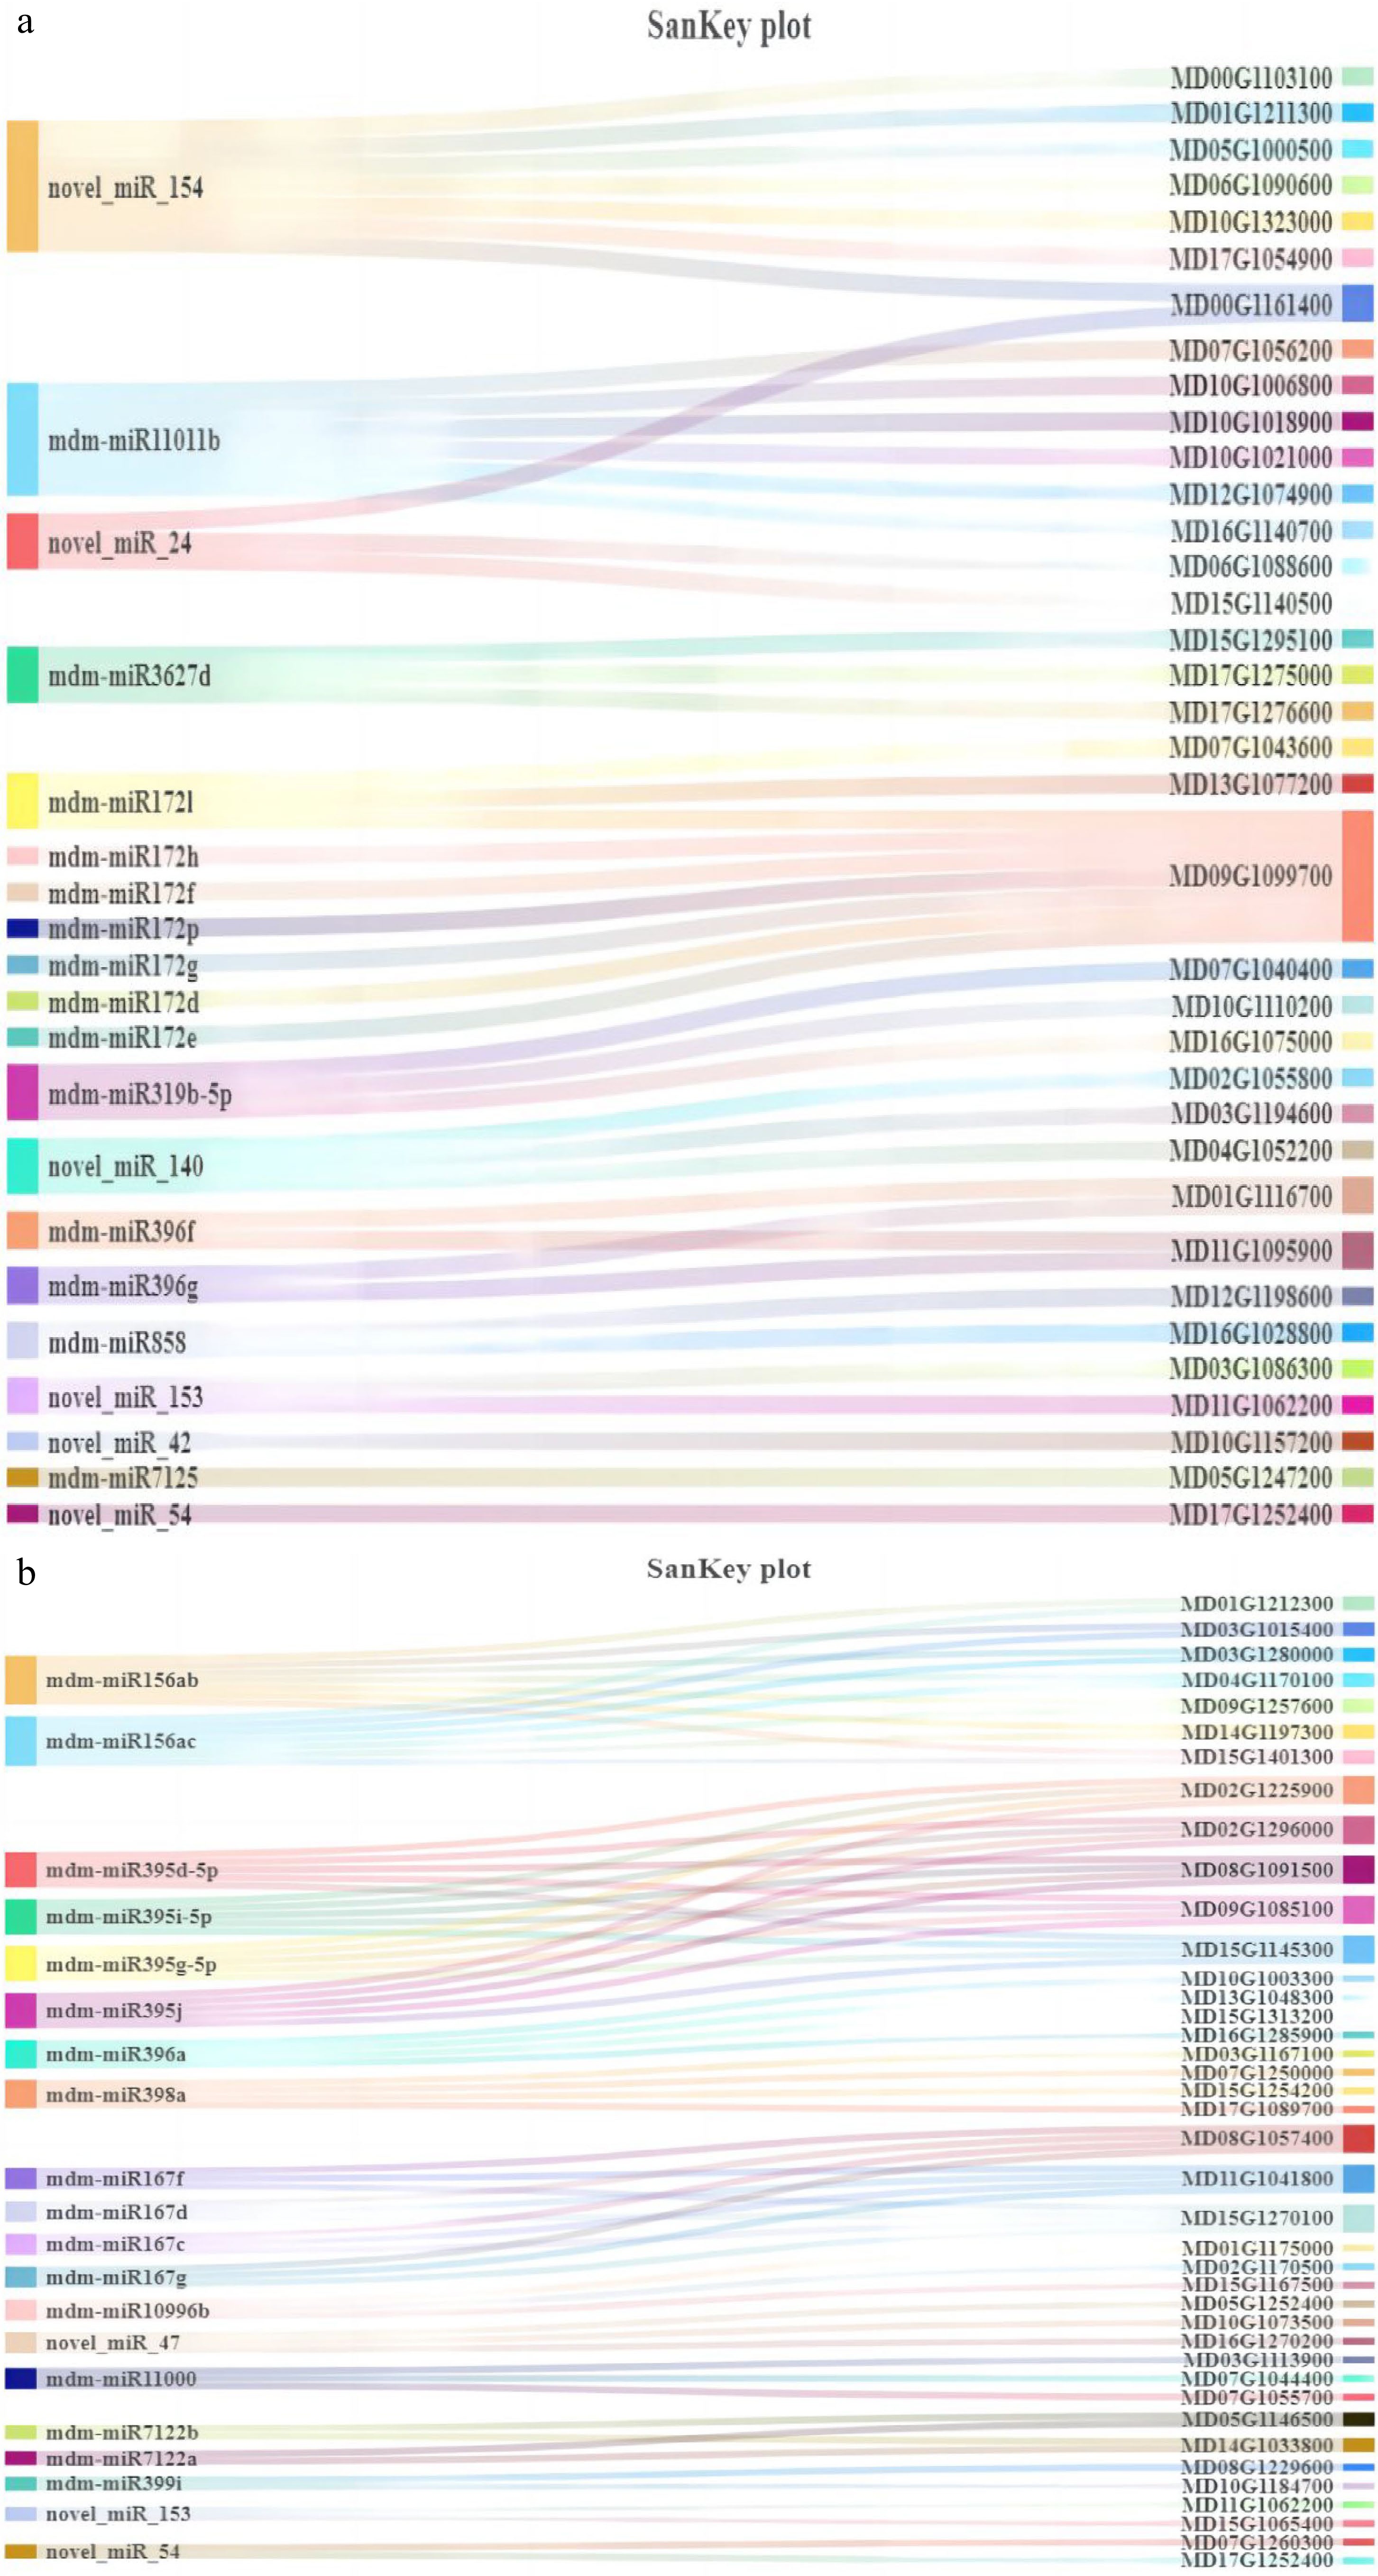
Figure 7.
Sankey diagram of the top 20 miRNA and their target genes. (a) BR vs MR’s top 20 miRNA and their target genes. (b) BS vs MS’s top 20 miRNA and their target genes.
-
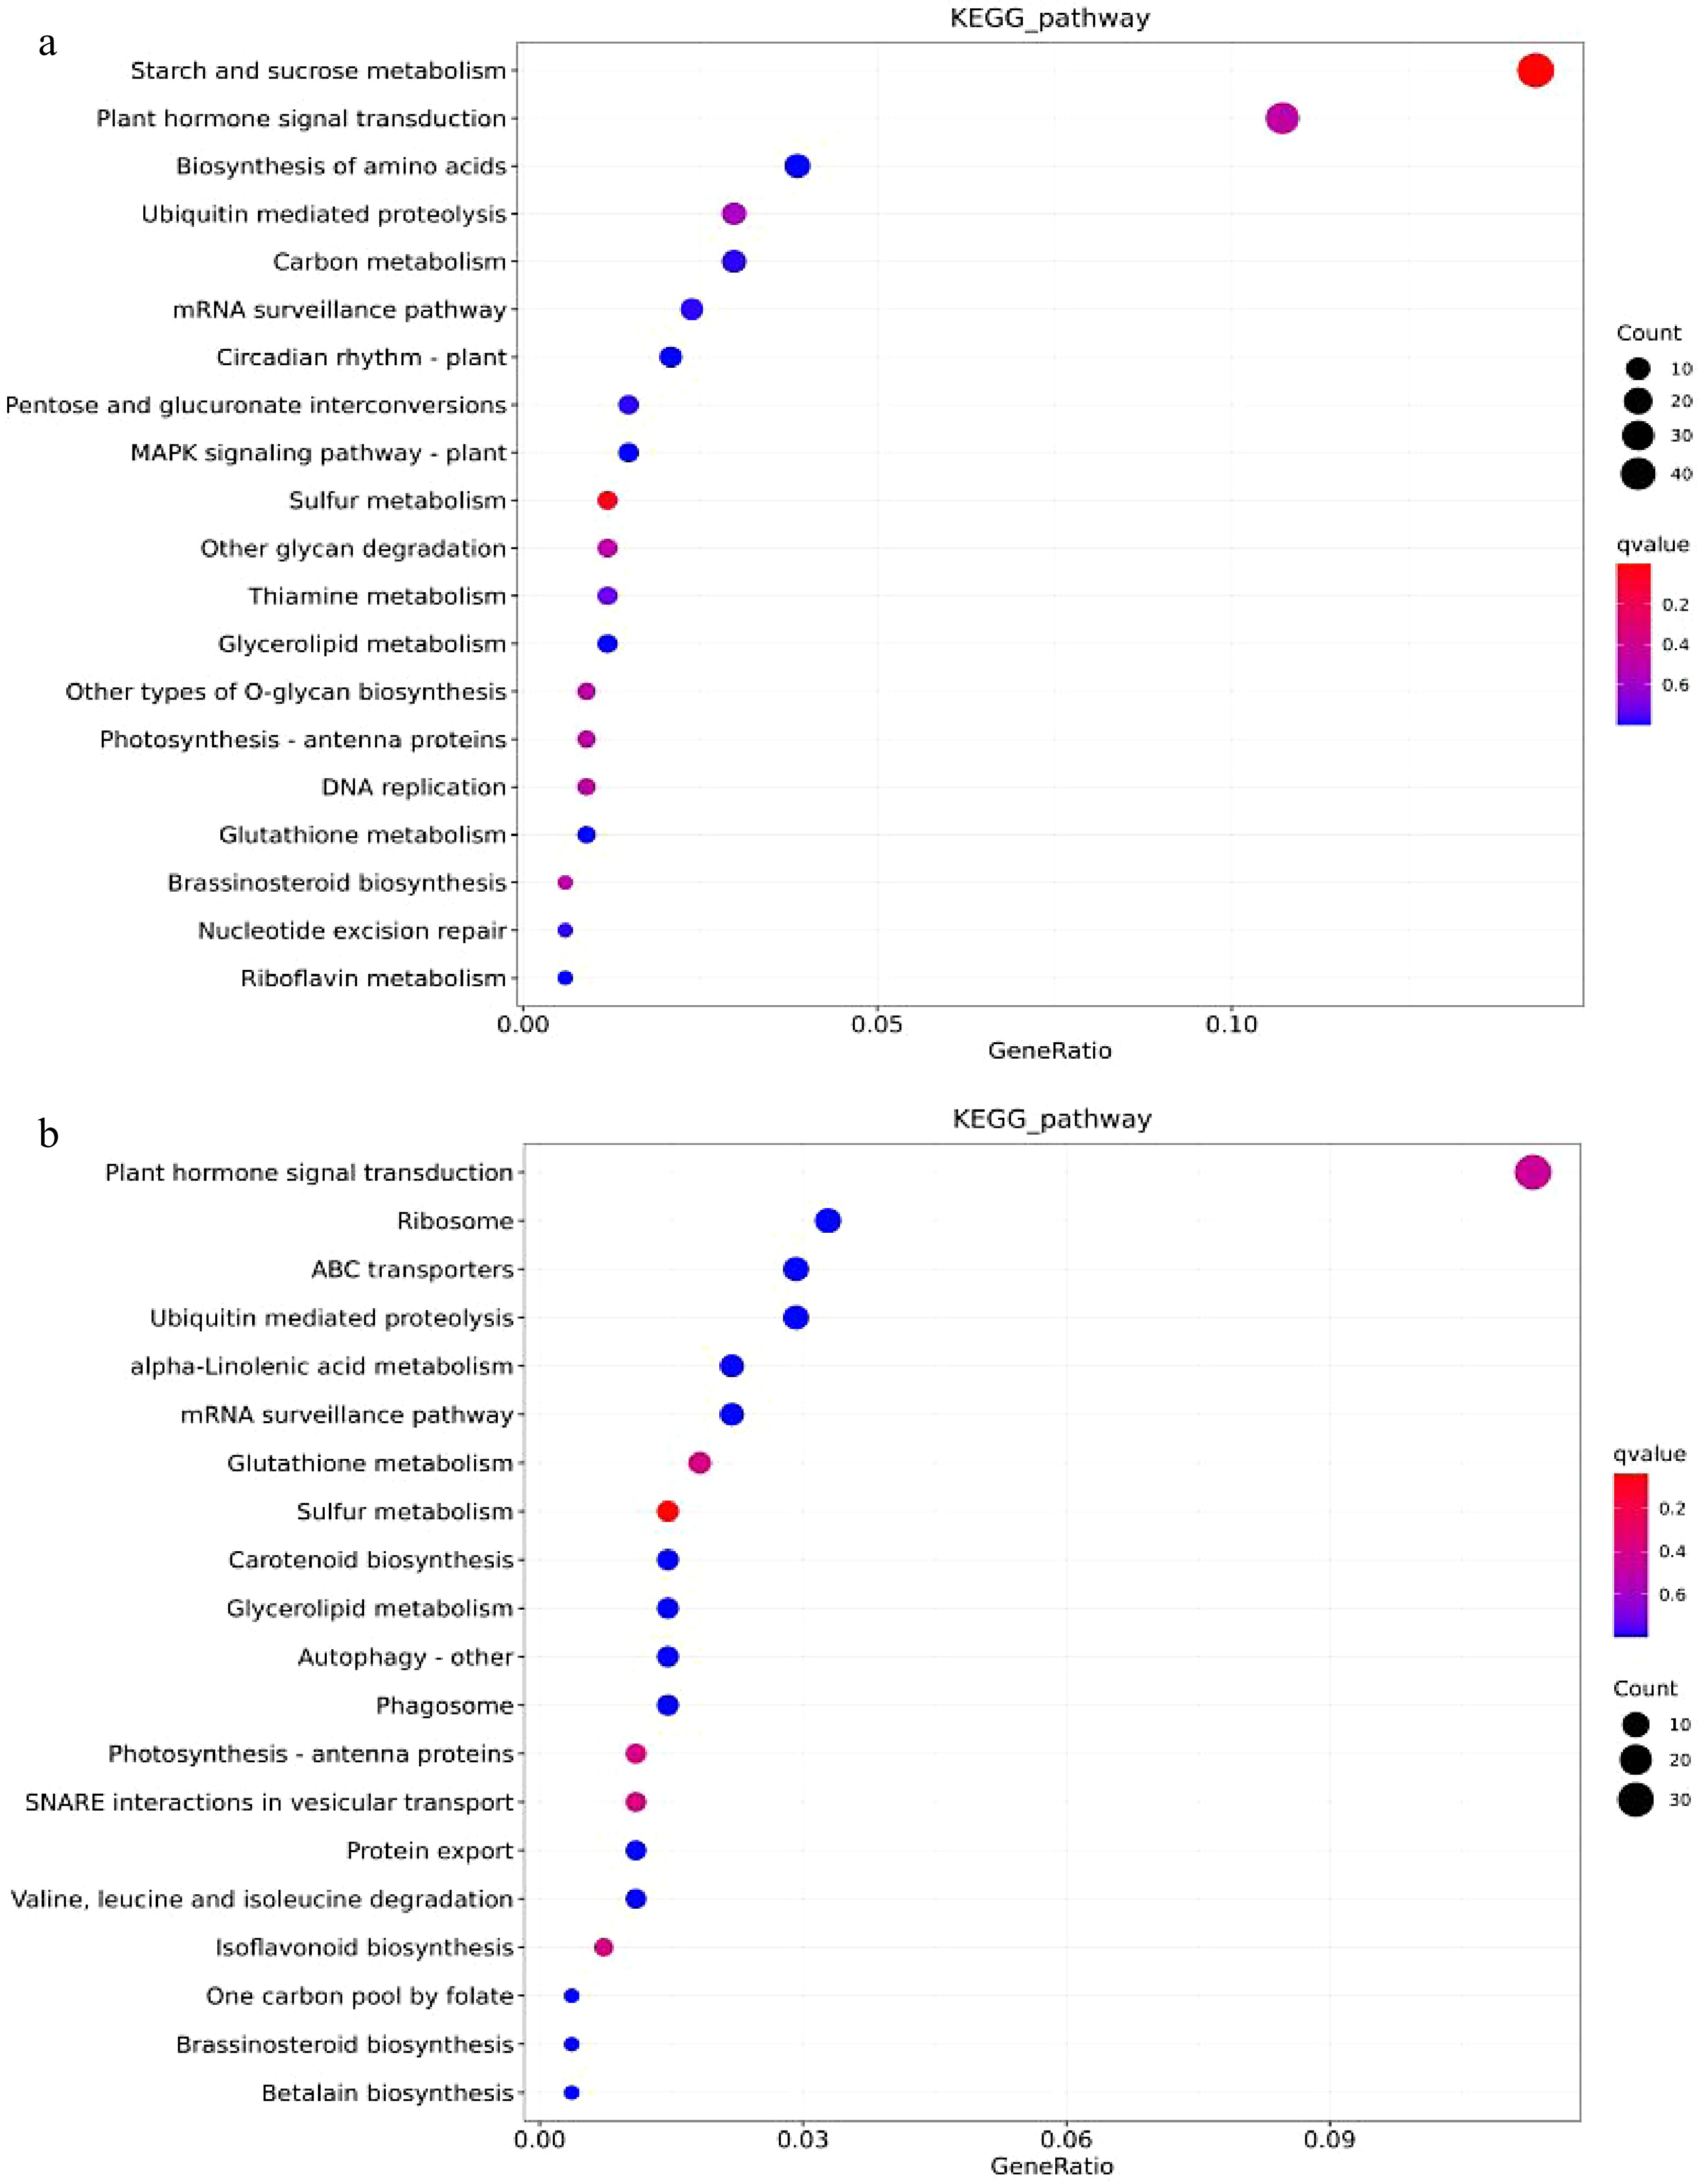
Figure 8.
The KEGG enrichment analysis of DEM’s target genes. (a) BR vs. MR’s DEMs enrichment bubble plots for top 20 KEGG pathways (b) BS vs. MS’s DEMs enrichment bubble plots for top 20 KEGG pathways.
-
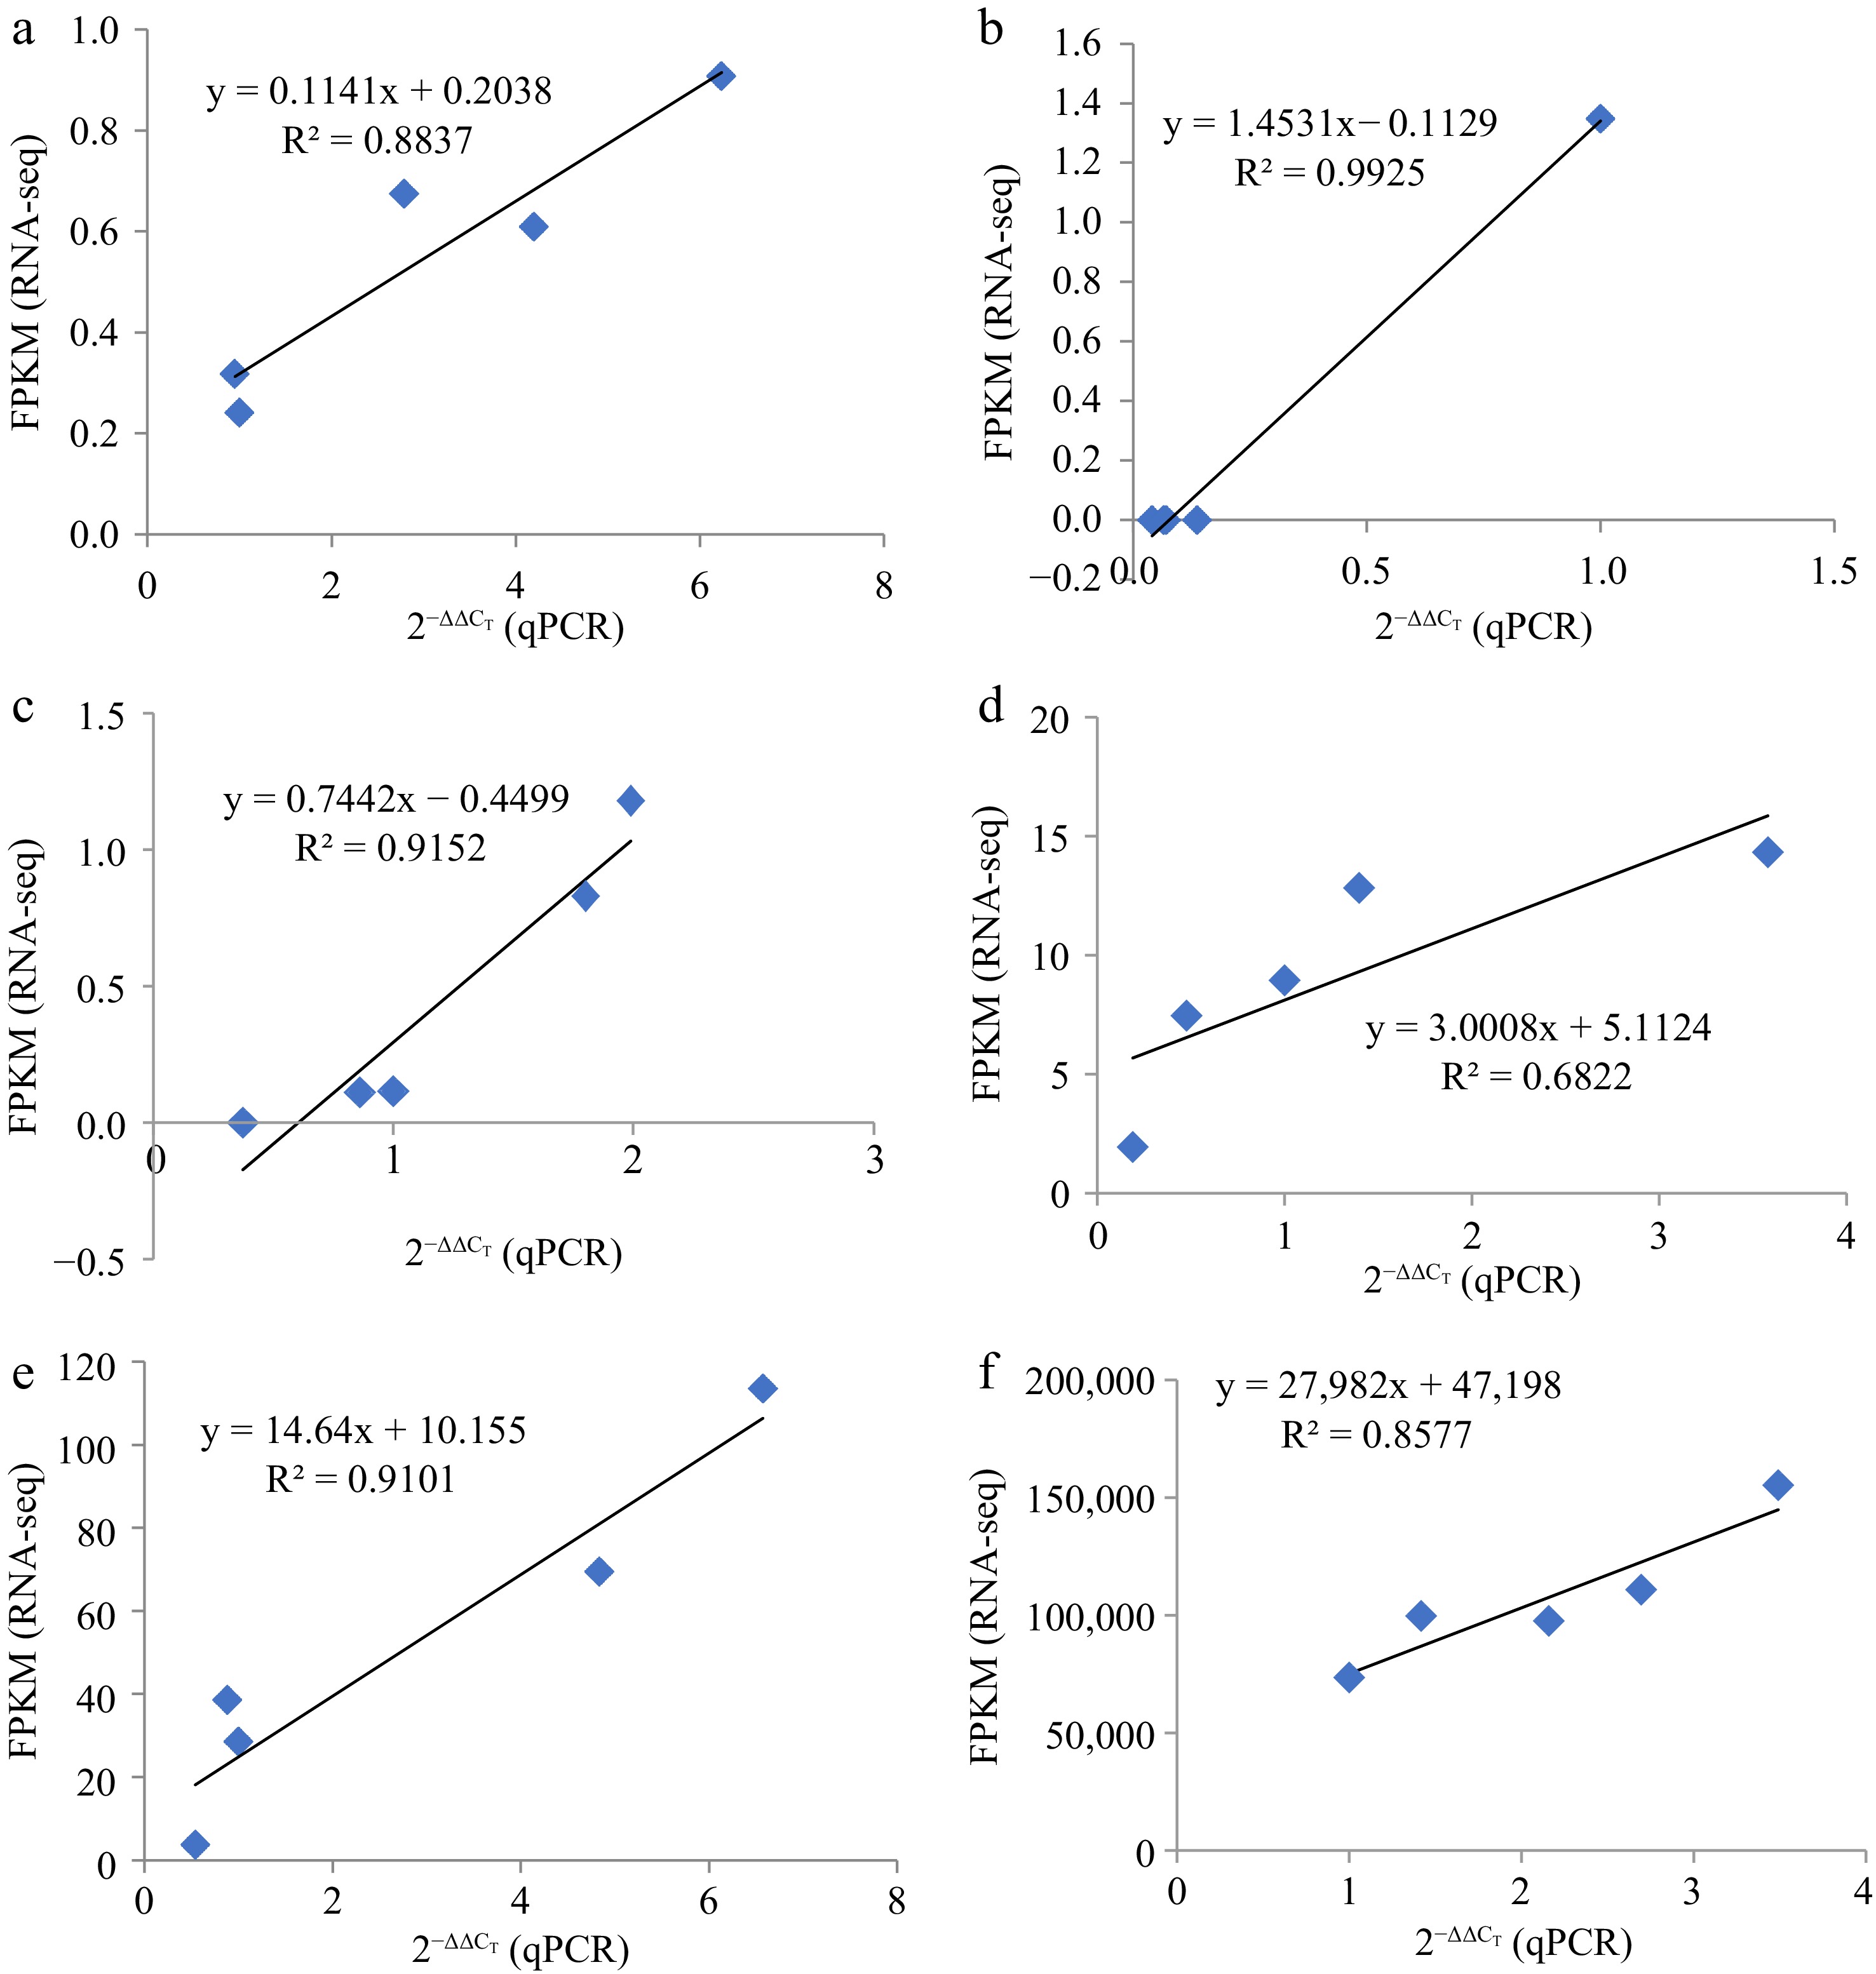
Figure 9.
The linear relationship between RNA-seq and qRT-PCR data. Represented by the linear relationship between RNA-seq and qRT-PCR Data. (a) miR156a, (b) miR396a, (c)–(f) were EIX2, CYP707A2, At3g21360, and SPL9, respectively.
-
Types All miRNA miRNA with target Target gene Known miRNA 291 291 4,194 Novel miRNA 159 145 783 Total 450 436 4,792 Table 1.
Predicted known and novel miRNAs with targets.
Figures
(9)
Tables
(1)