-
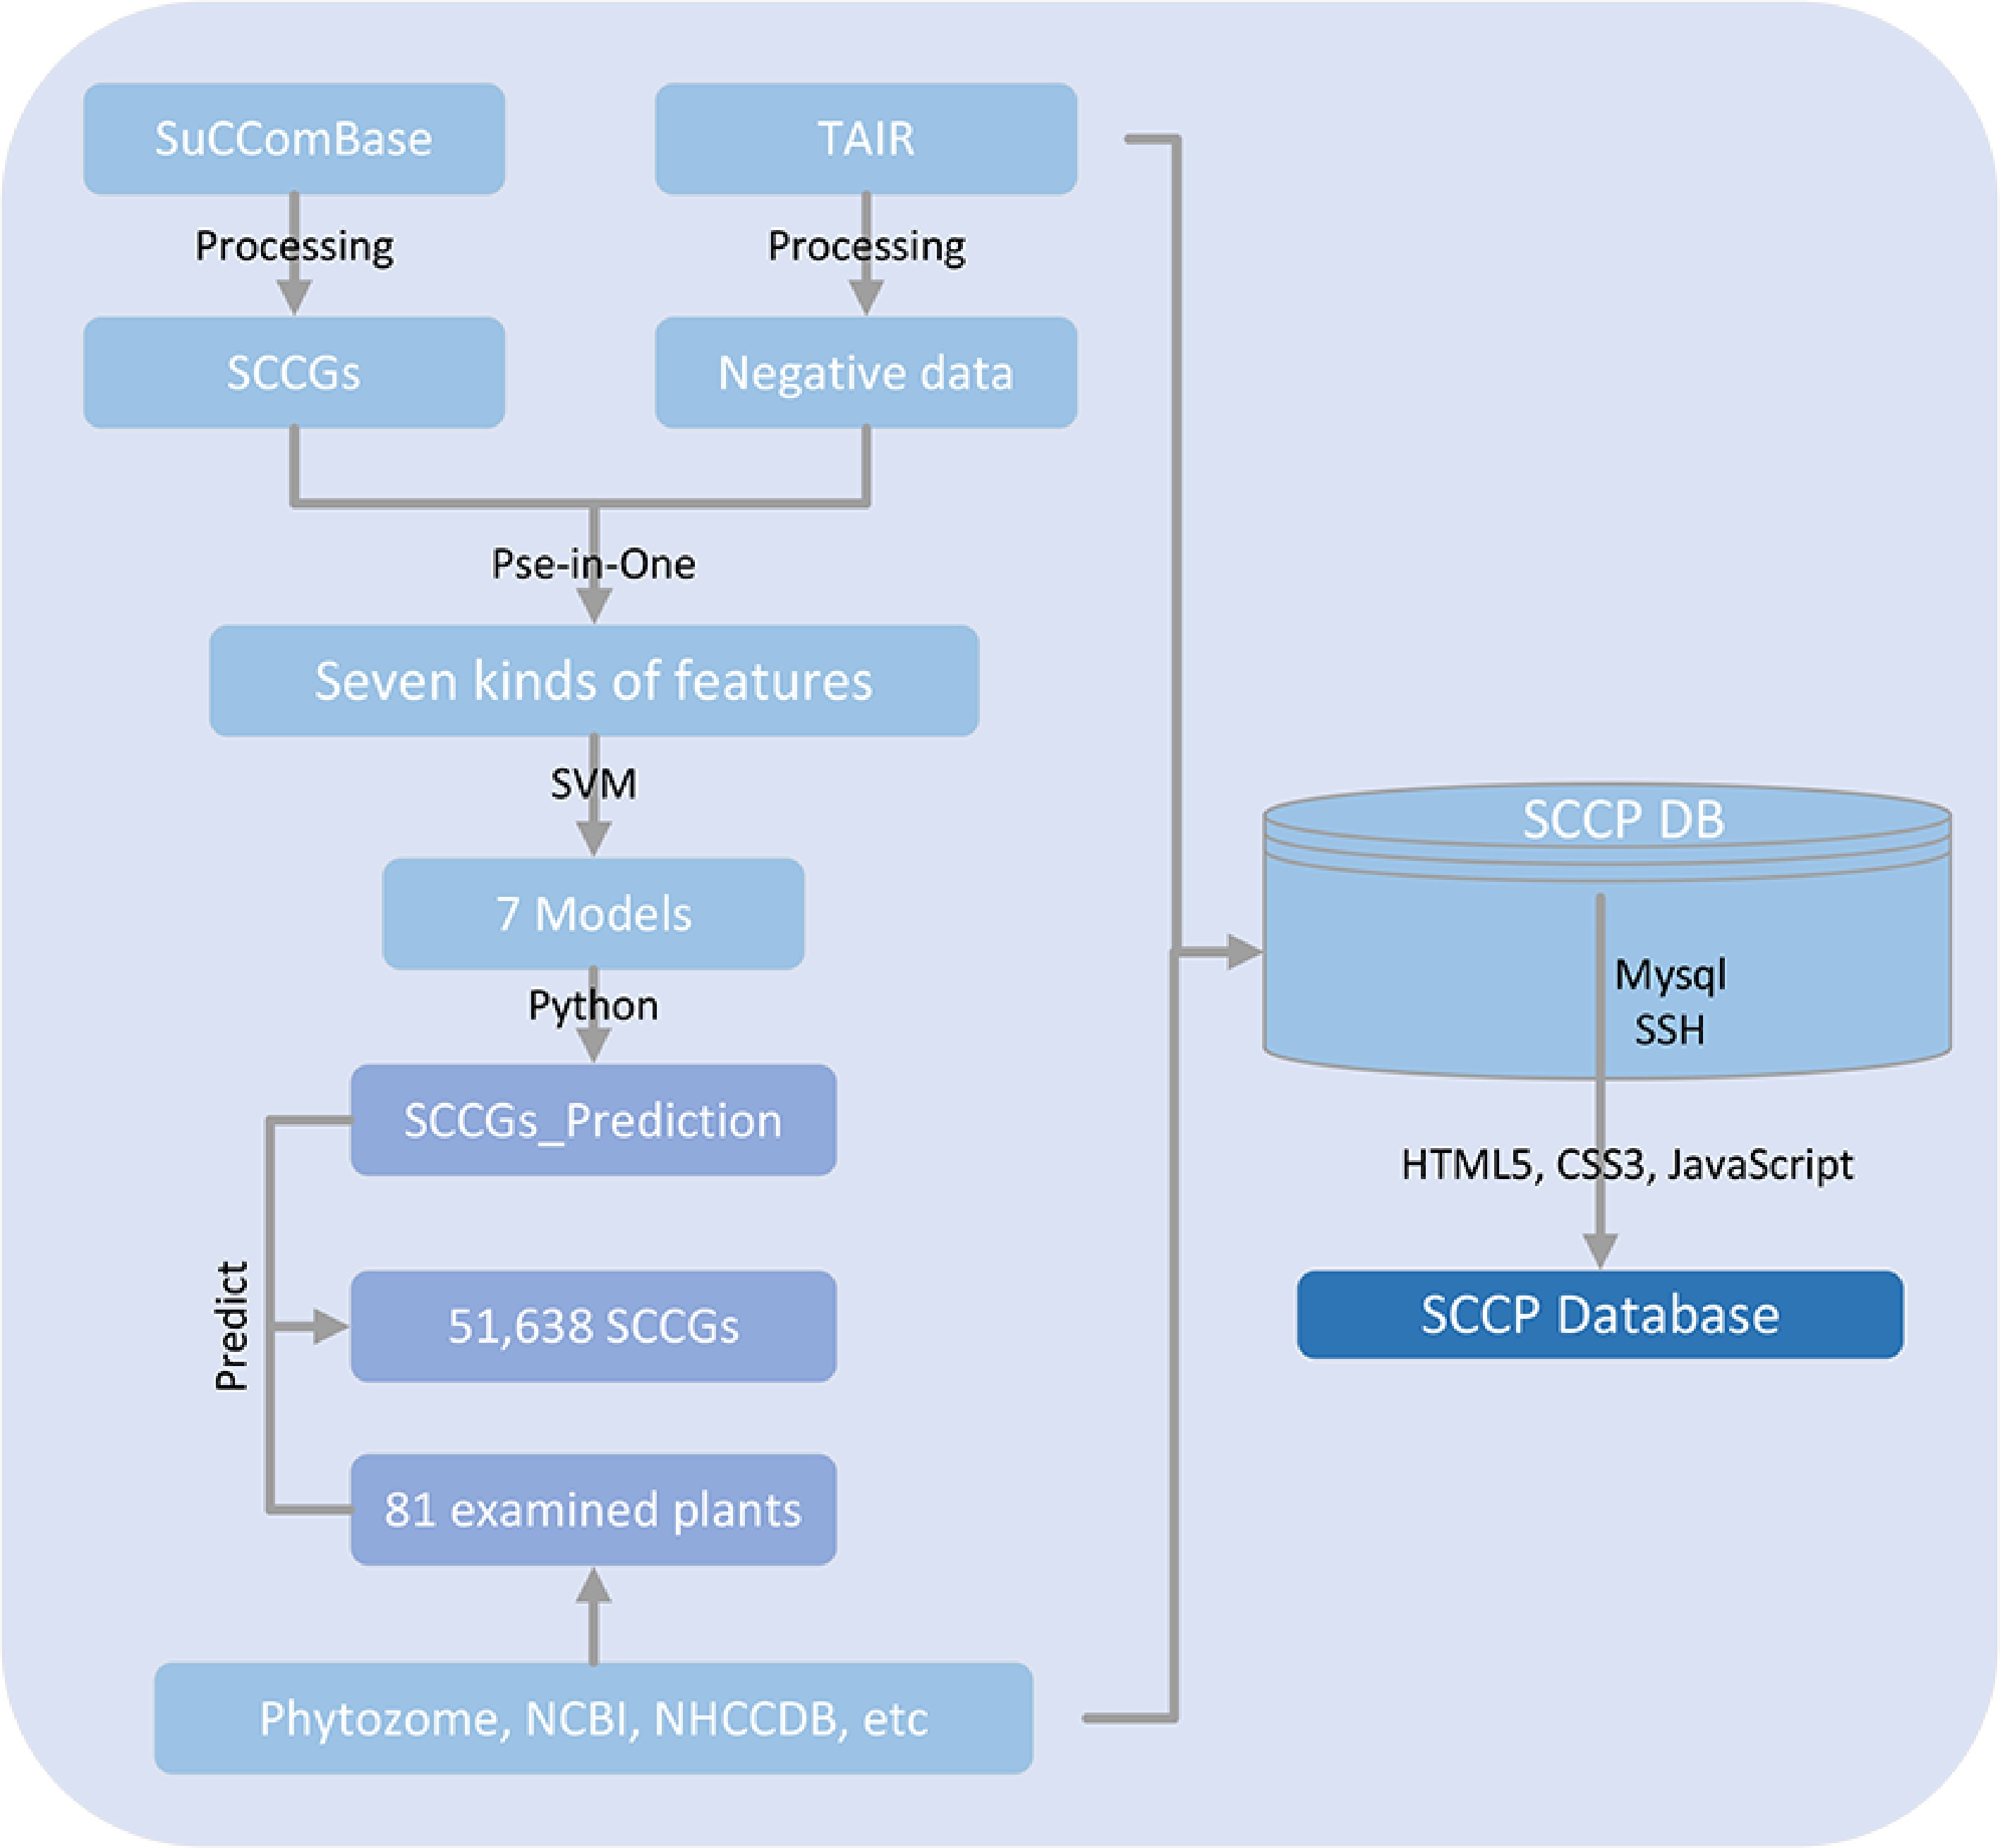
Figure 1.
Flowchart showing that SCCP database was created in this study as a dataset for training of machine learning algorithms.
-
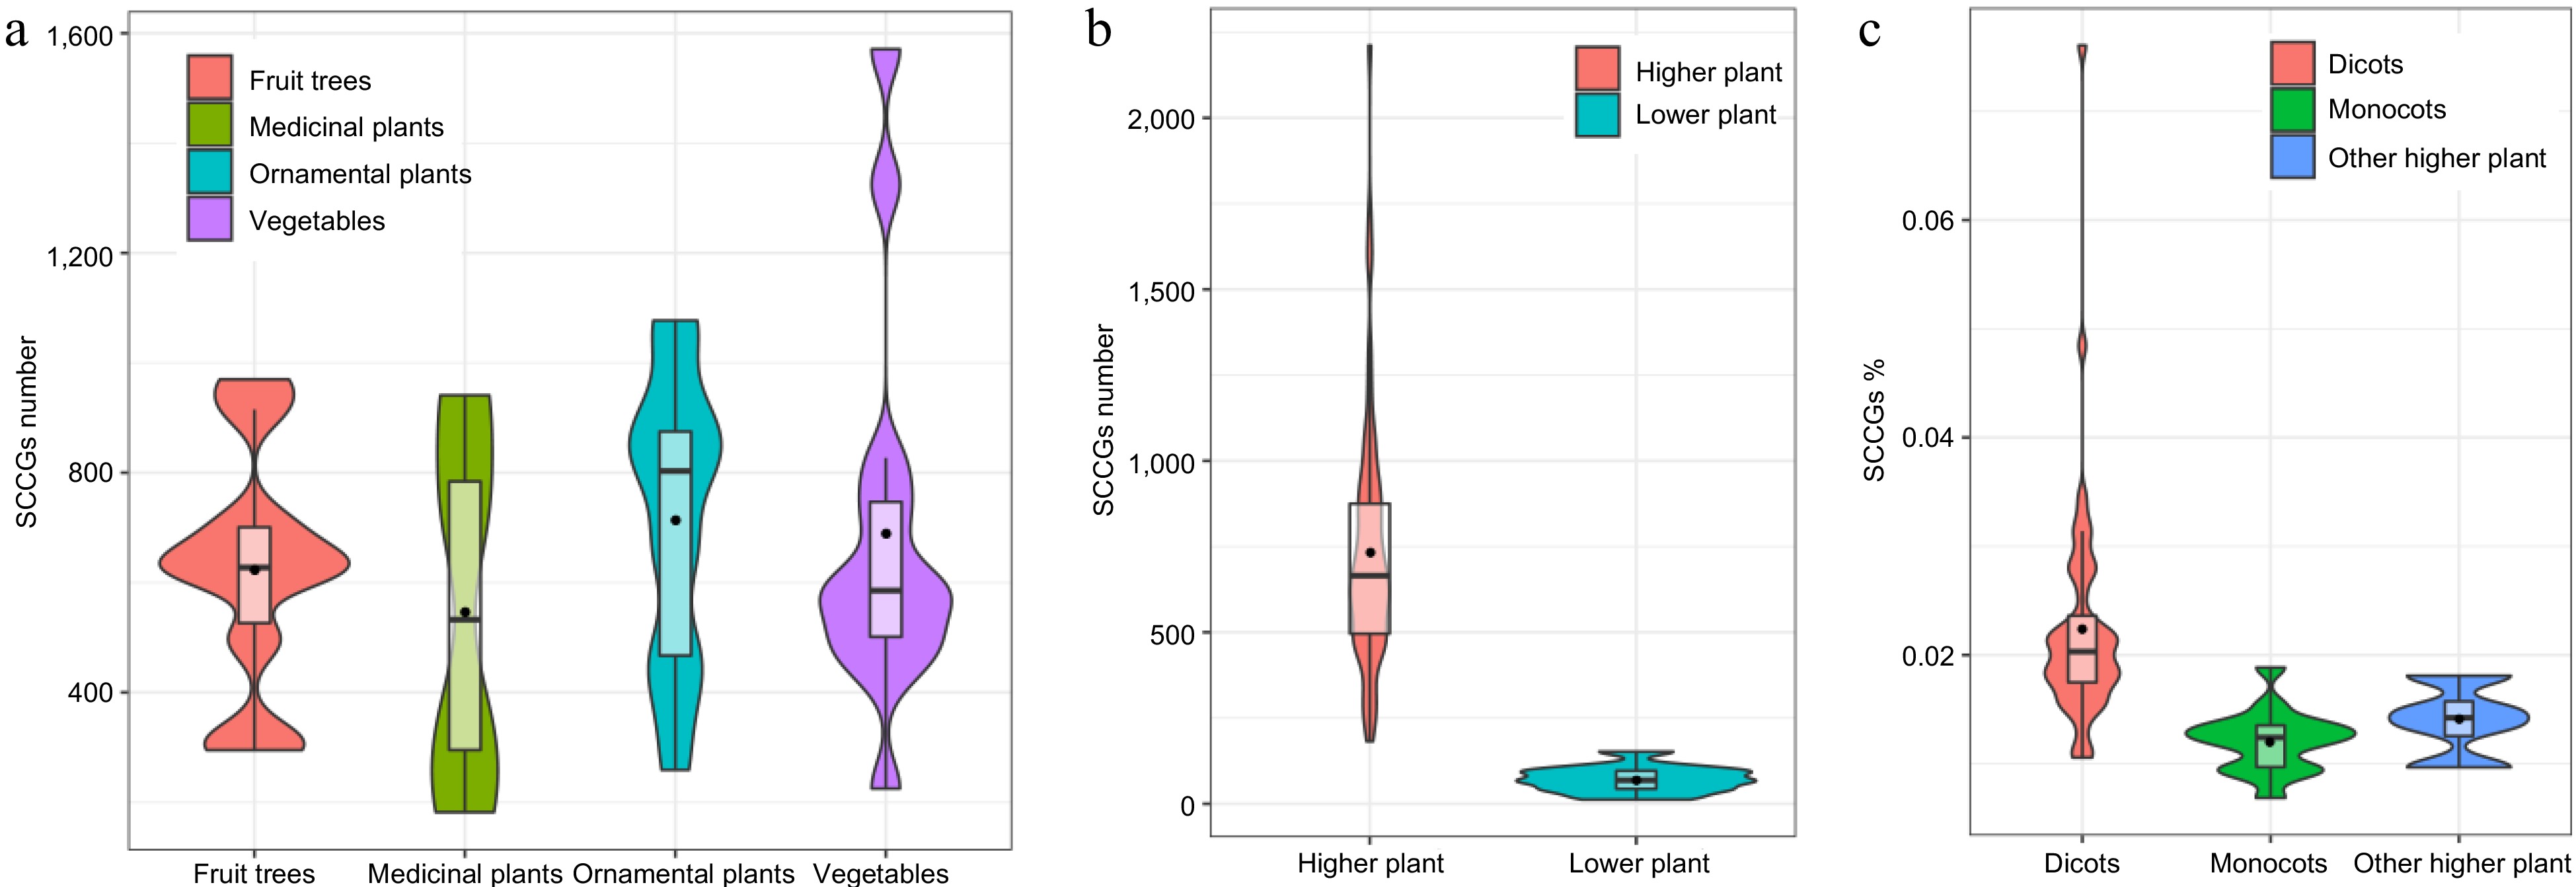
Figure 2.
Using Violin plots to compare the number of SCCGs among different plant categories. (a) Comparison of SCCGs number between Fruit trees and medicinal plants, ornamental plants, and vegetables. (b) Comparison of SCCGs number between higher plants and lower plants. (c) Comparison of SCCGs number between dicots, monocots, and other higher plant species.
-
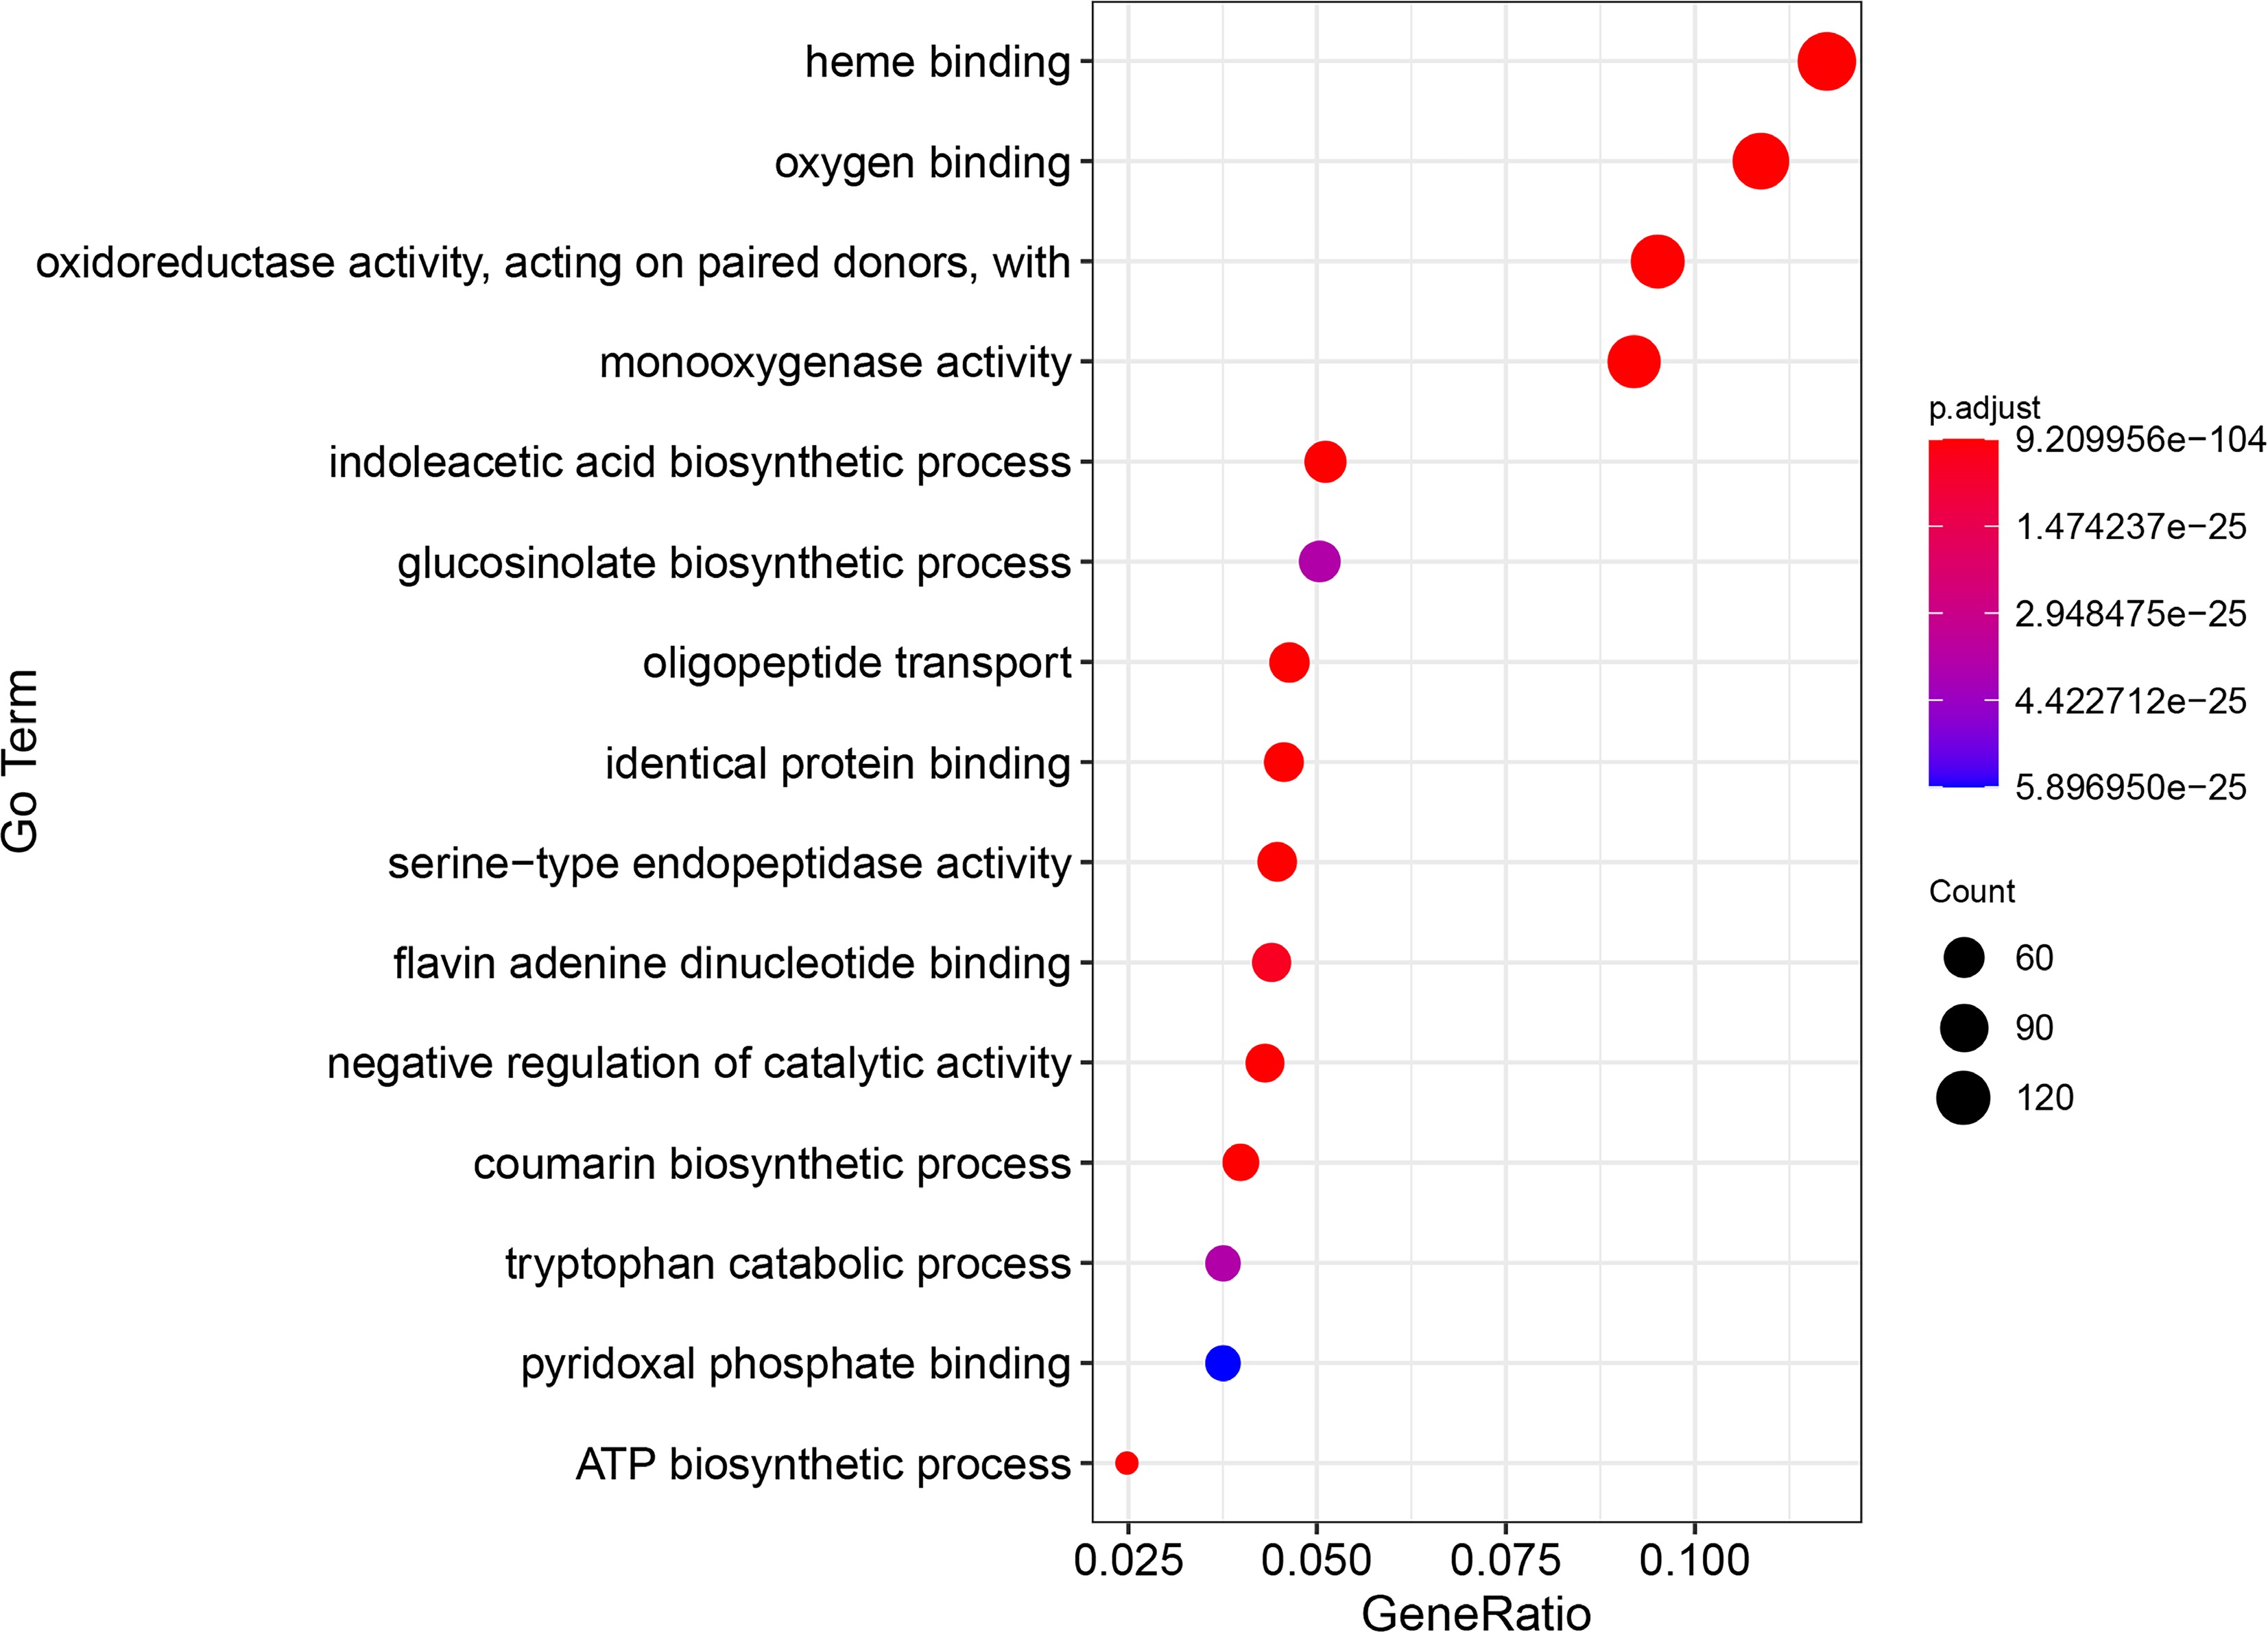
Figure 3.
The top 15 GO enrichment items of genes related to sulfur-containing compounds in B. rapa.
-
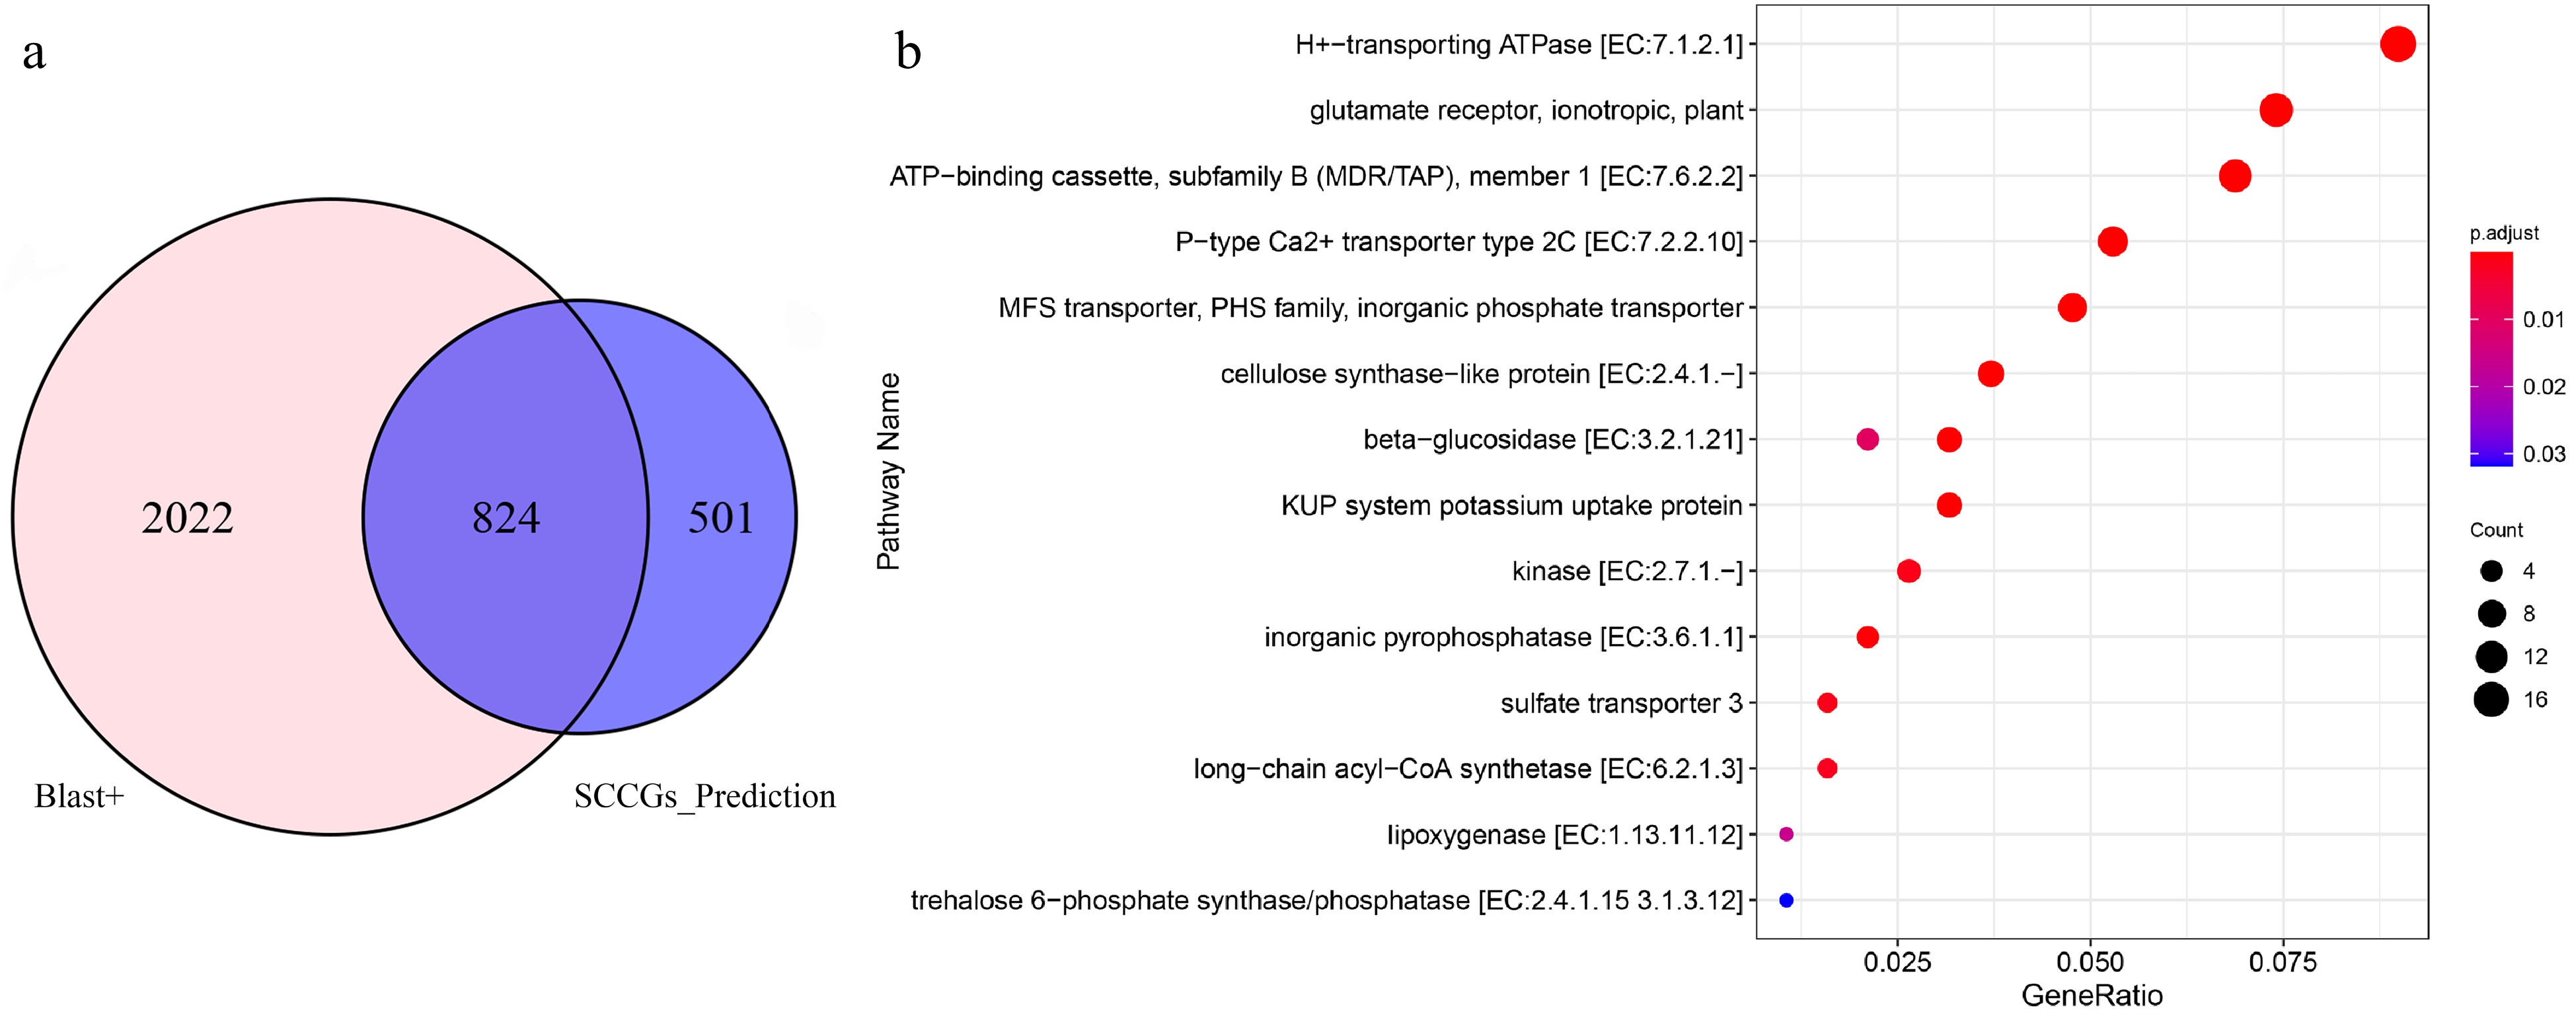
Figure 4.
Comparative analysis of sulfur compound-related genes unearthed by Blast+ and SCCGs_Prediction tools. (a) Common and differential genes detected by Blast+ and SCCGs_Prediction tools. (b) KEGG enrichment analysis of 501 specifically identified by SCCGs_Prediction tool.
-
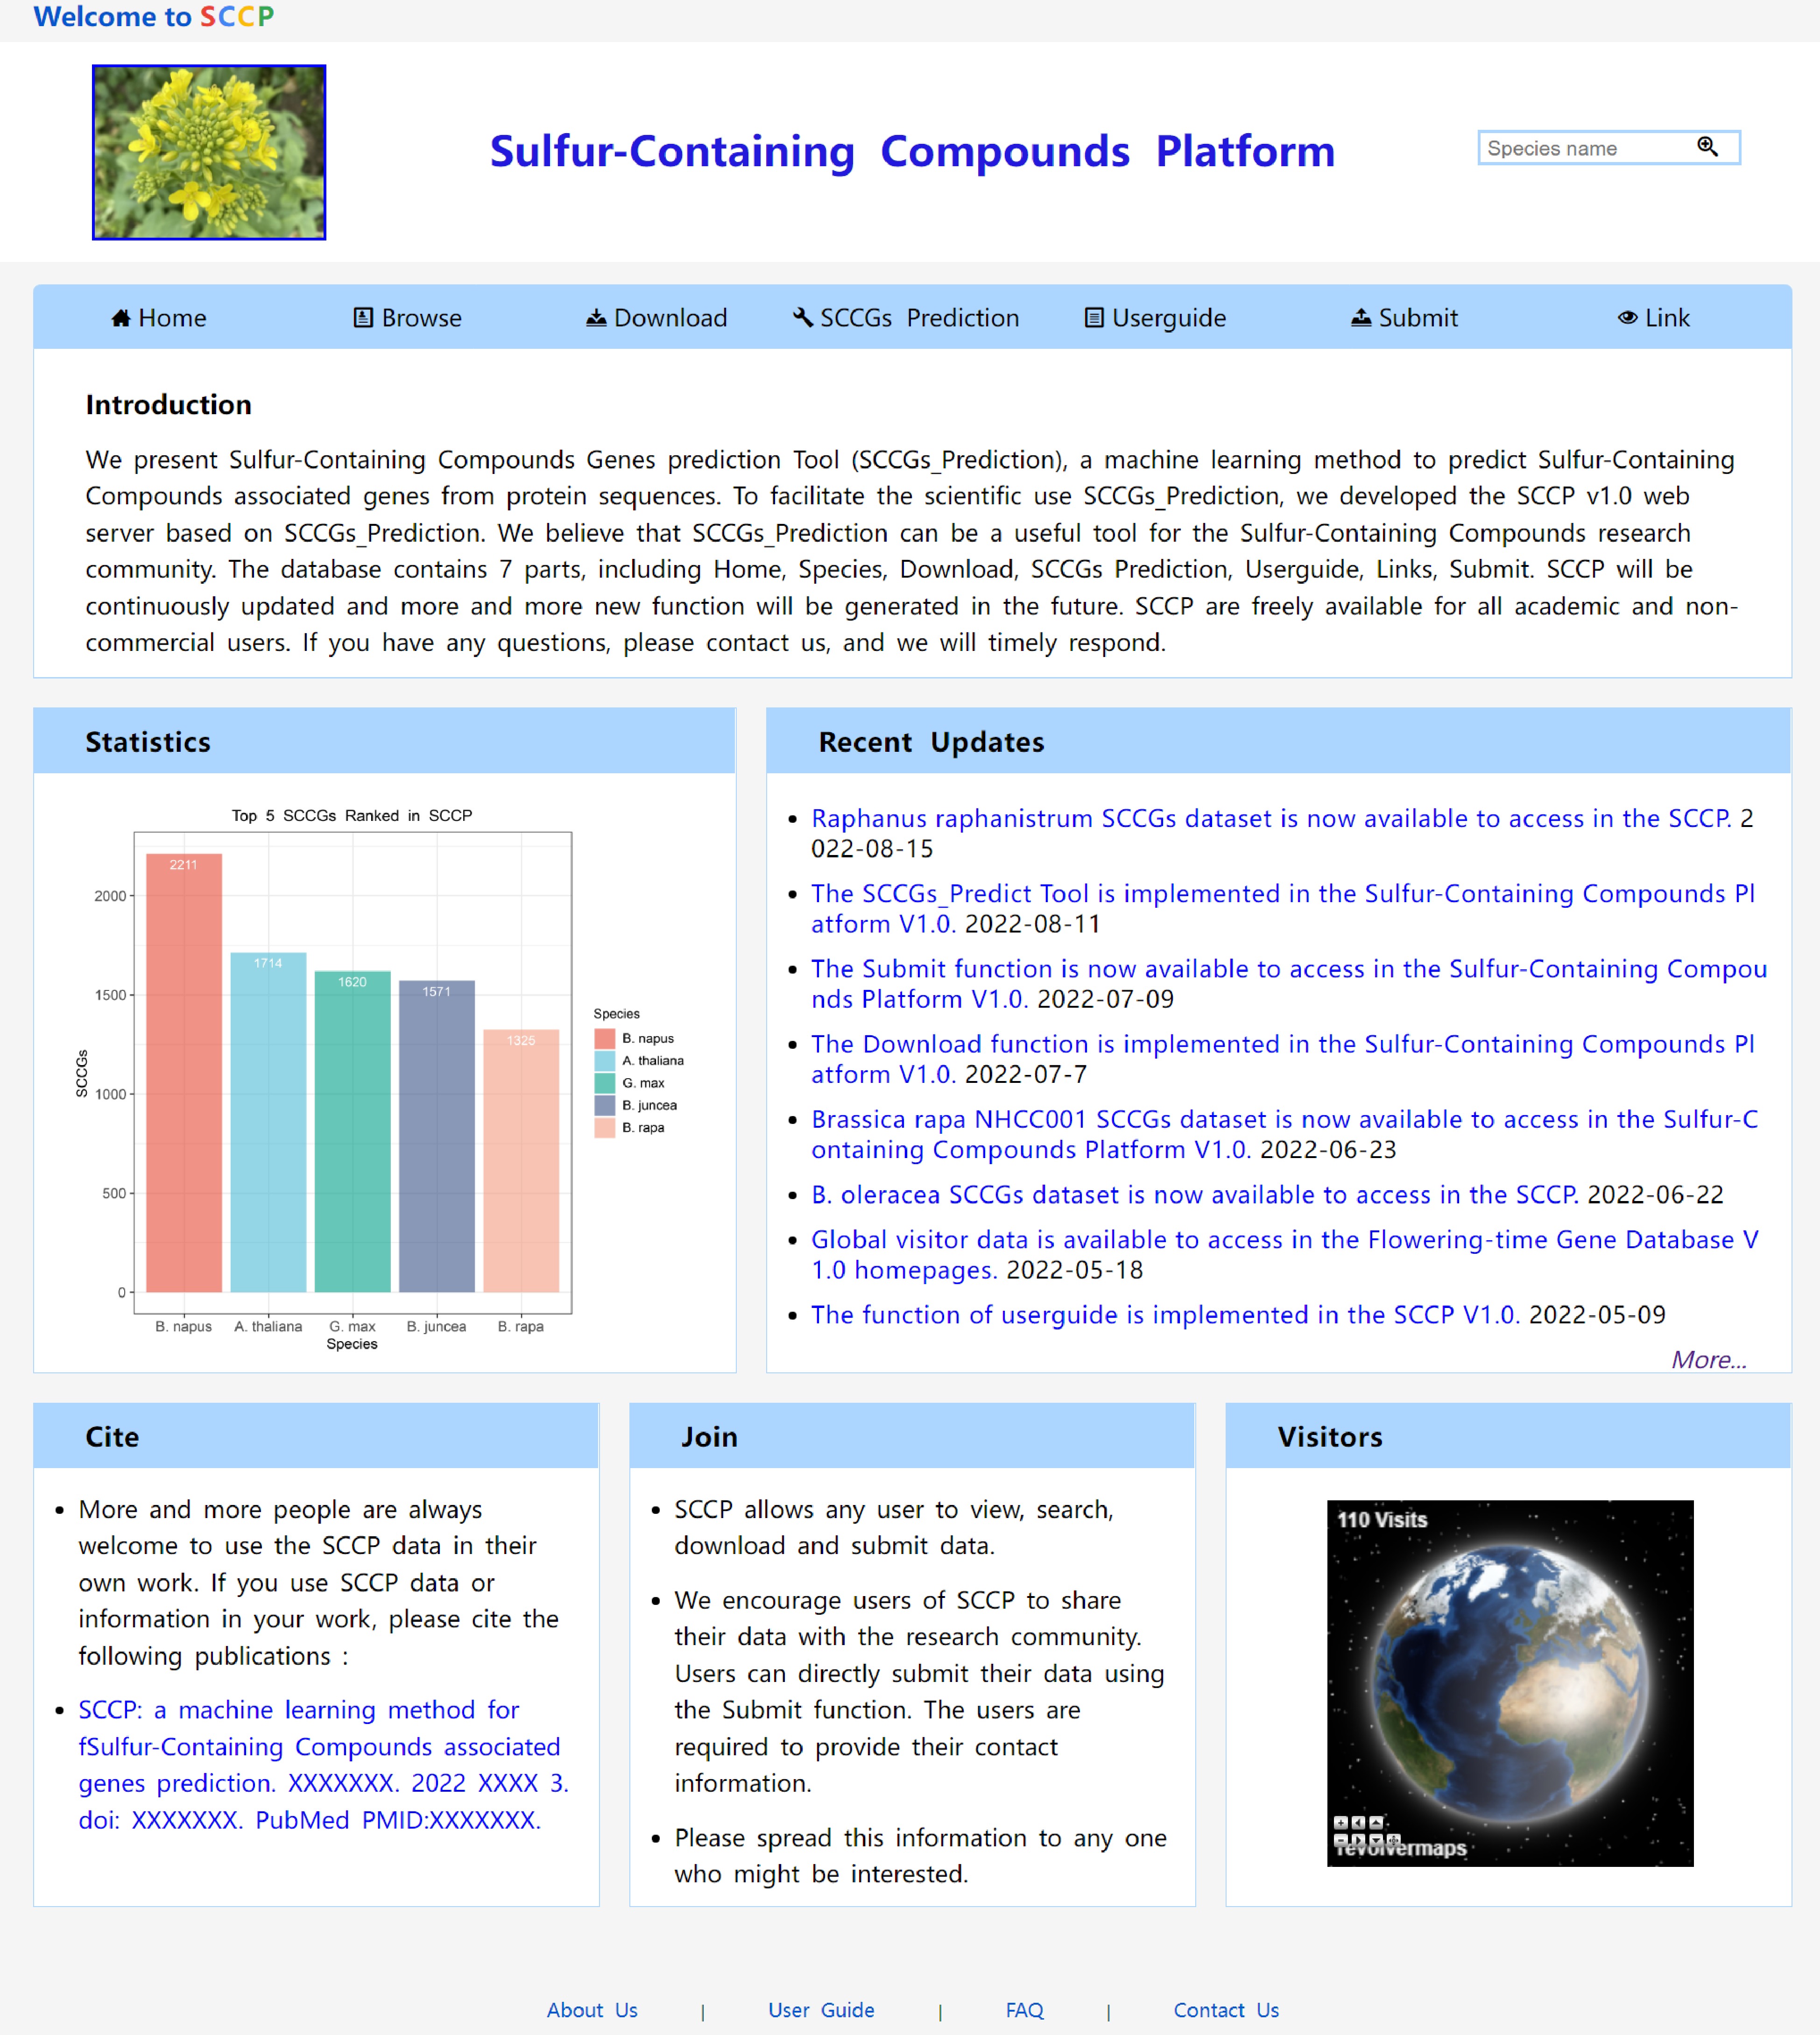
Figure 5.
Home page of the SCCP website.
-
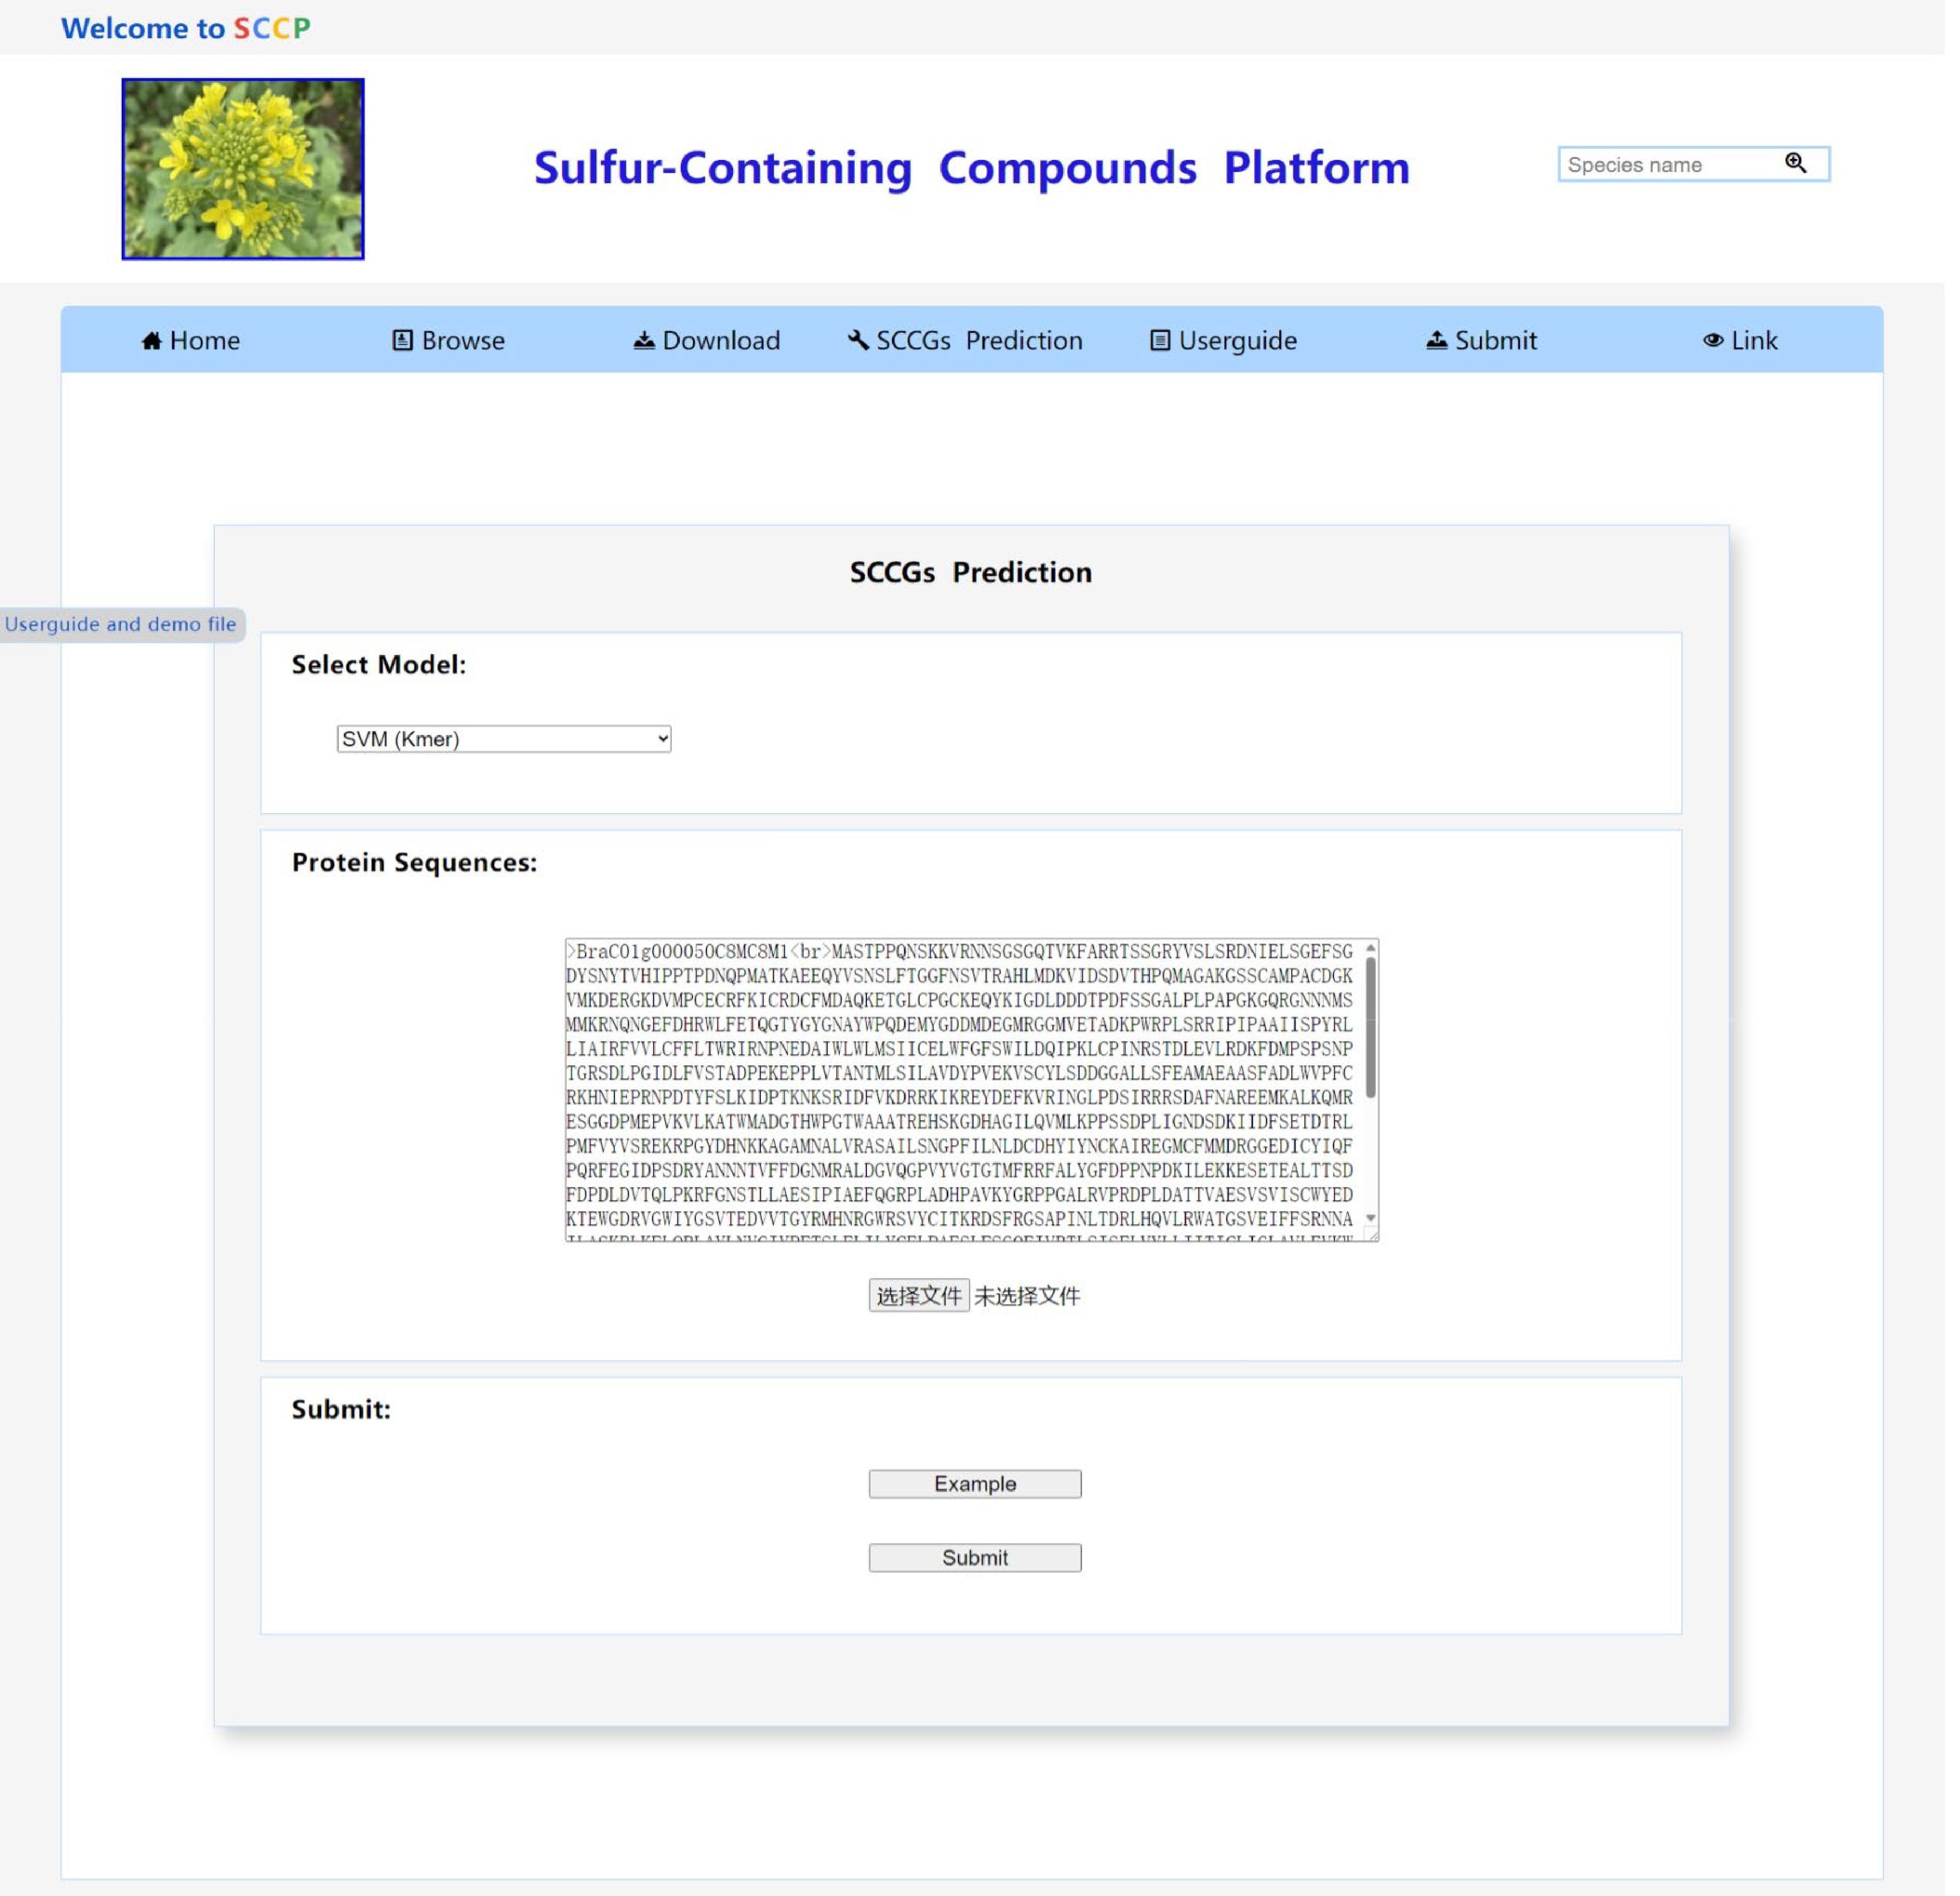
Figure 6.
The SCCGs_Prediction tool page of the SCCP website.
-
Methods Number of
featuresF1score ACC AUC SVM-ACC 100 0.904 0.906 0.895 SVM-Kmer 400 0.945 0.938 0.936 SVM-PC-PseAAC 25 0.808 0.831 0.911 SVM-Kmer-ACC 500 0.922 0.923 0.910 SVM-Kmer-PC-PseAAC 425 0.944 0.935 0.933 SVM-ACC-PC-PseAAC 125 0.916 0.917 0.907 SVM-ACC-Kmer-PC-PseAAC 525 0.921 0.923 0.911 Table 1.
The prediction performance of the SVM model.
Figures
(6)
Tables
(1)