-
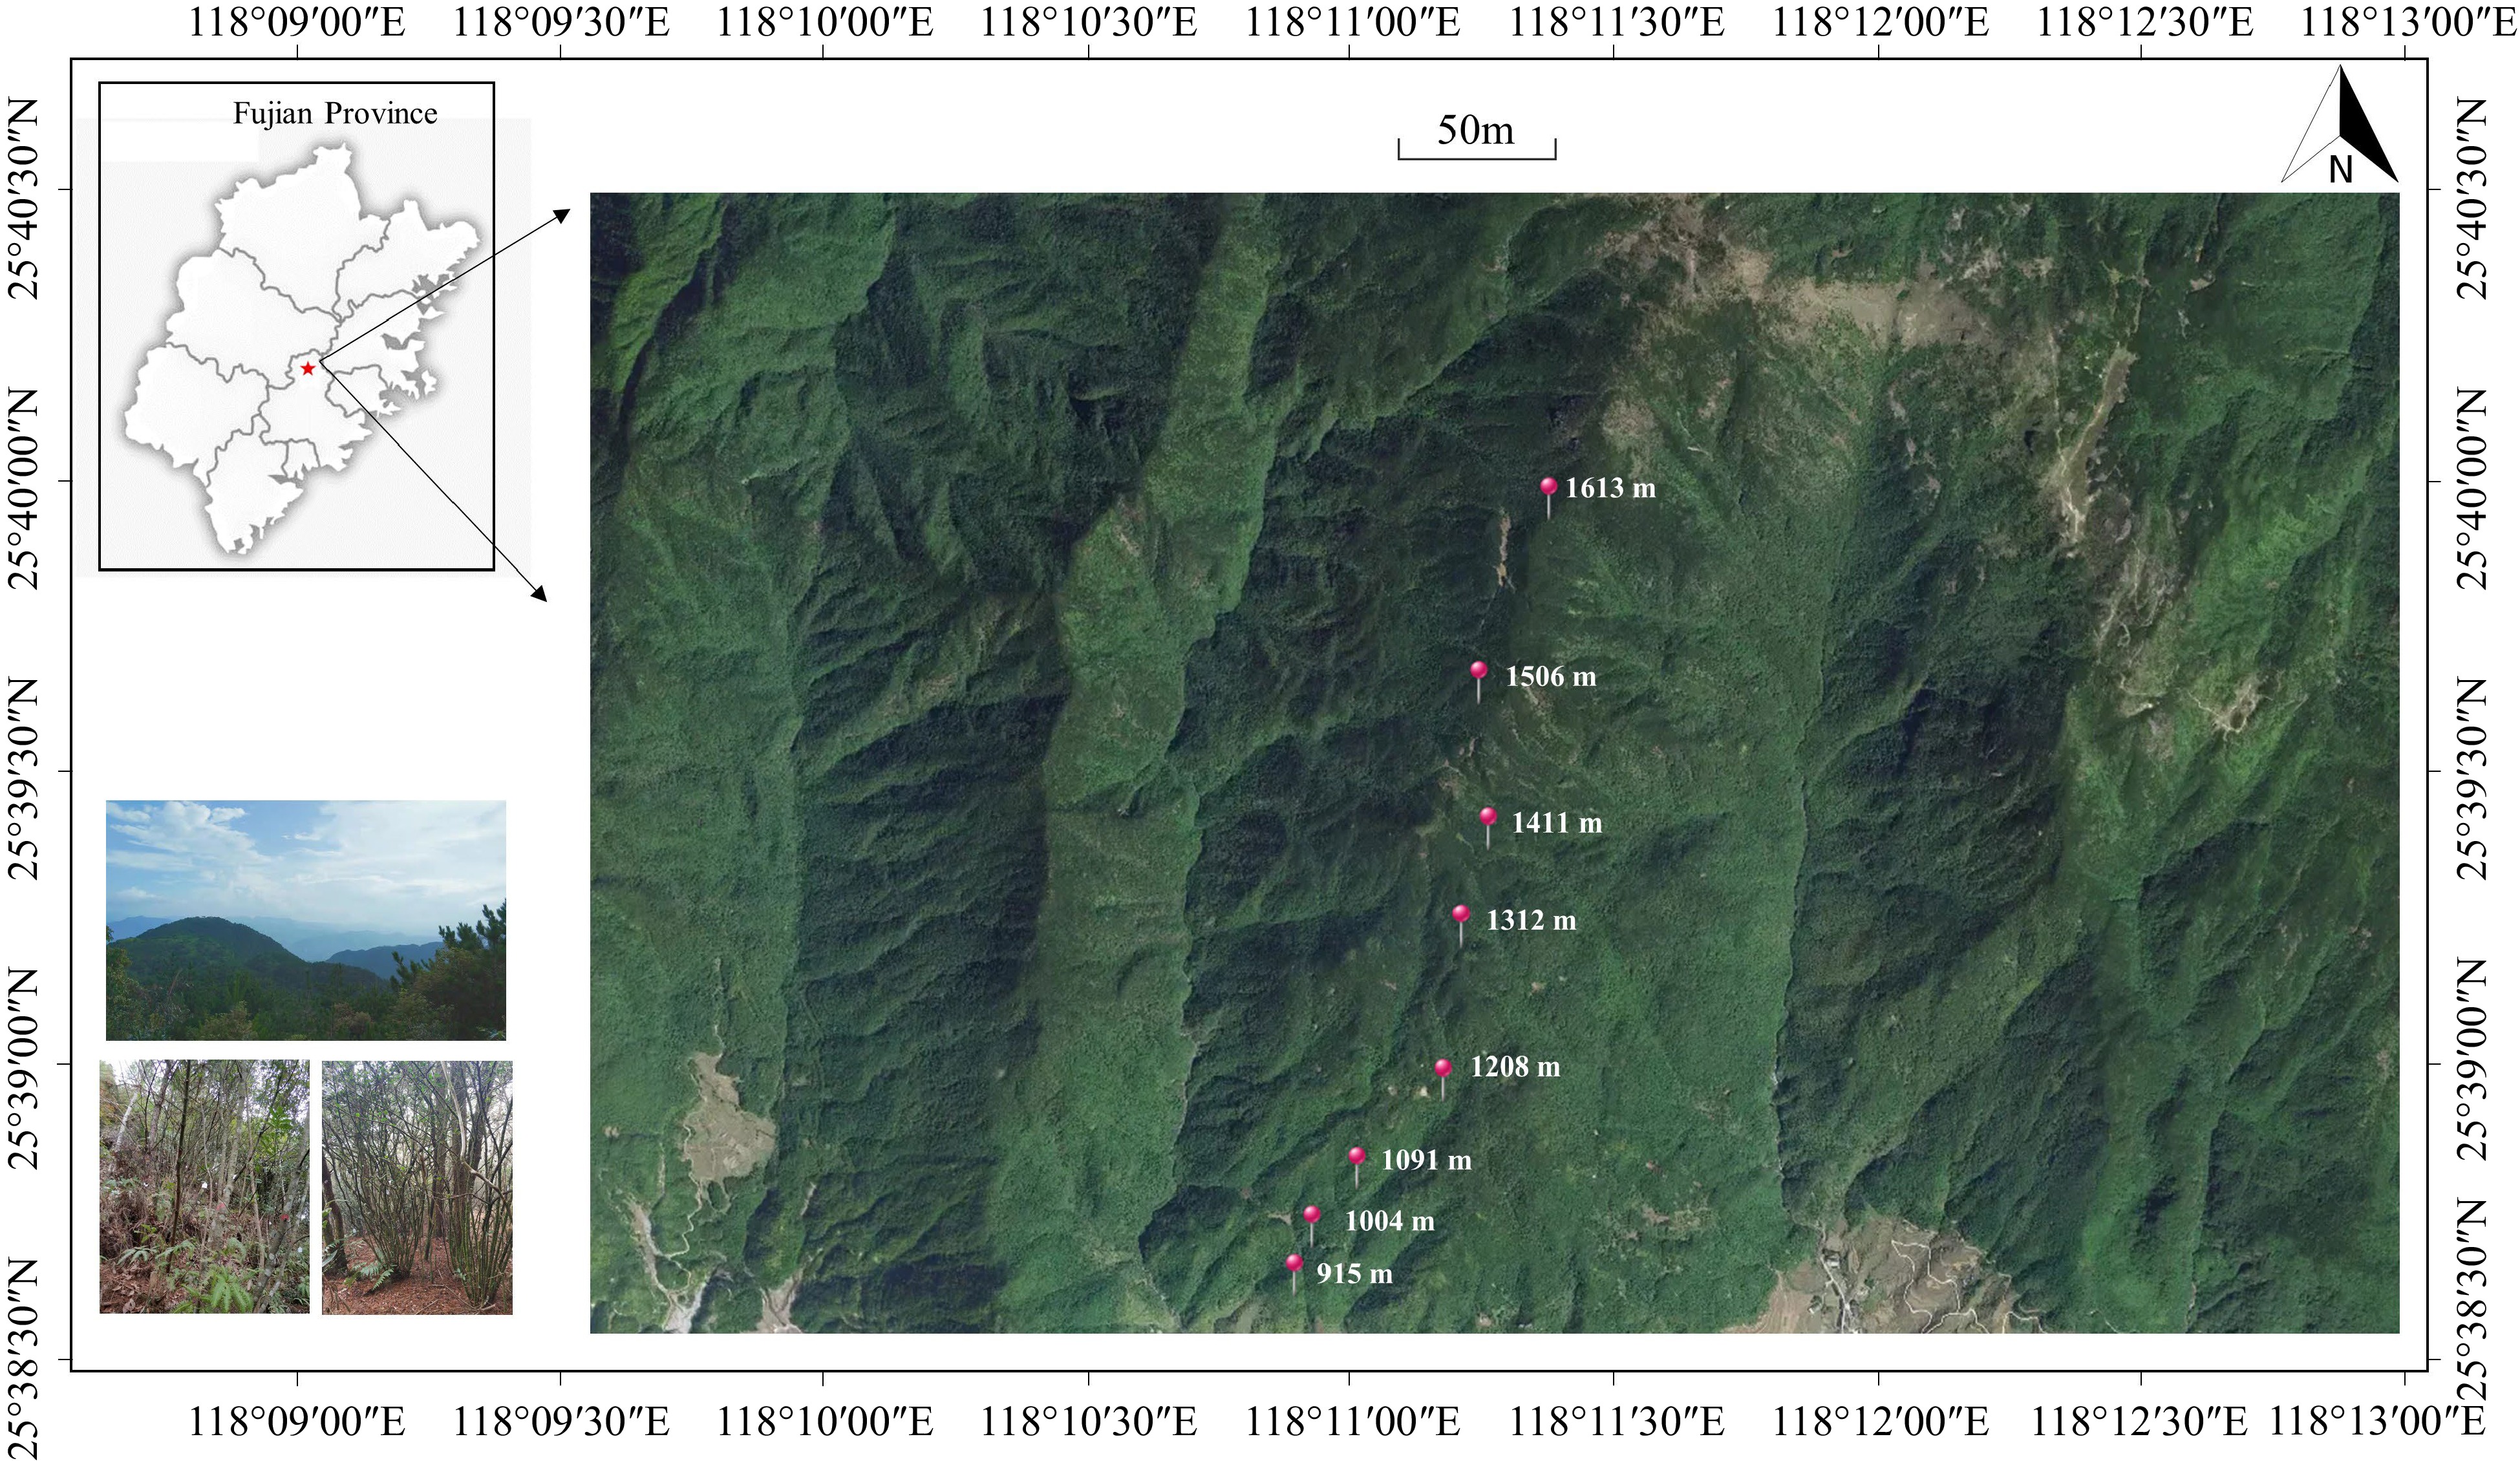
Figure 1.
Distribution of sampling plots along the elevation gradient in Daiyun Mountain.
-
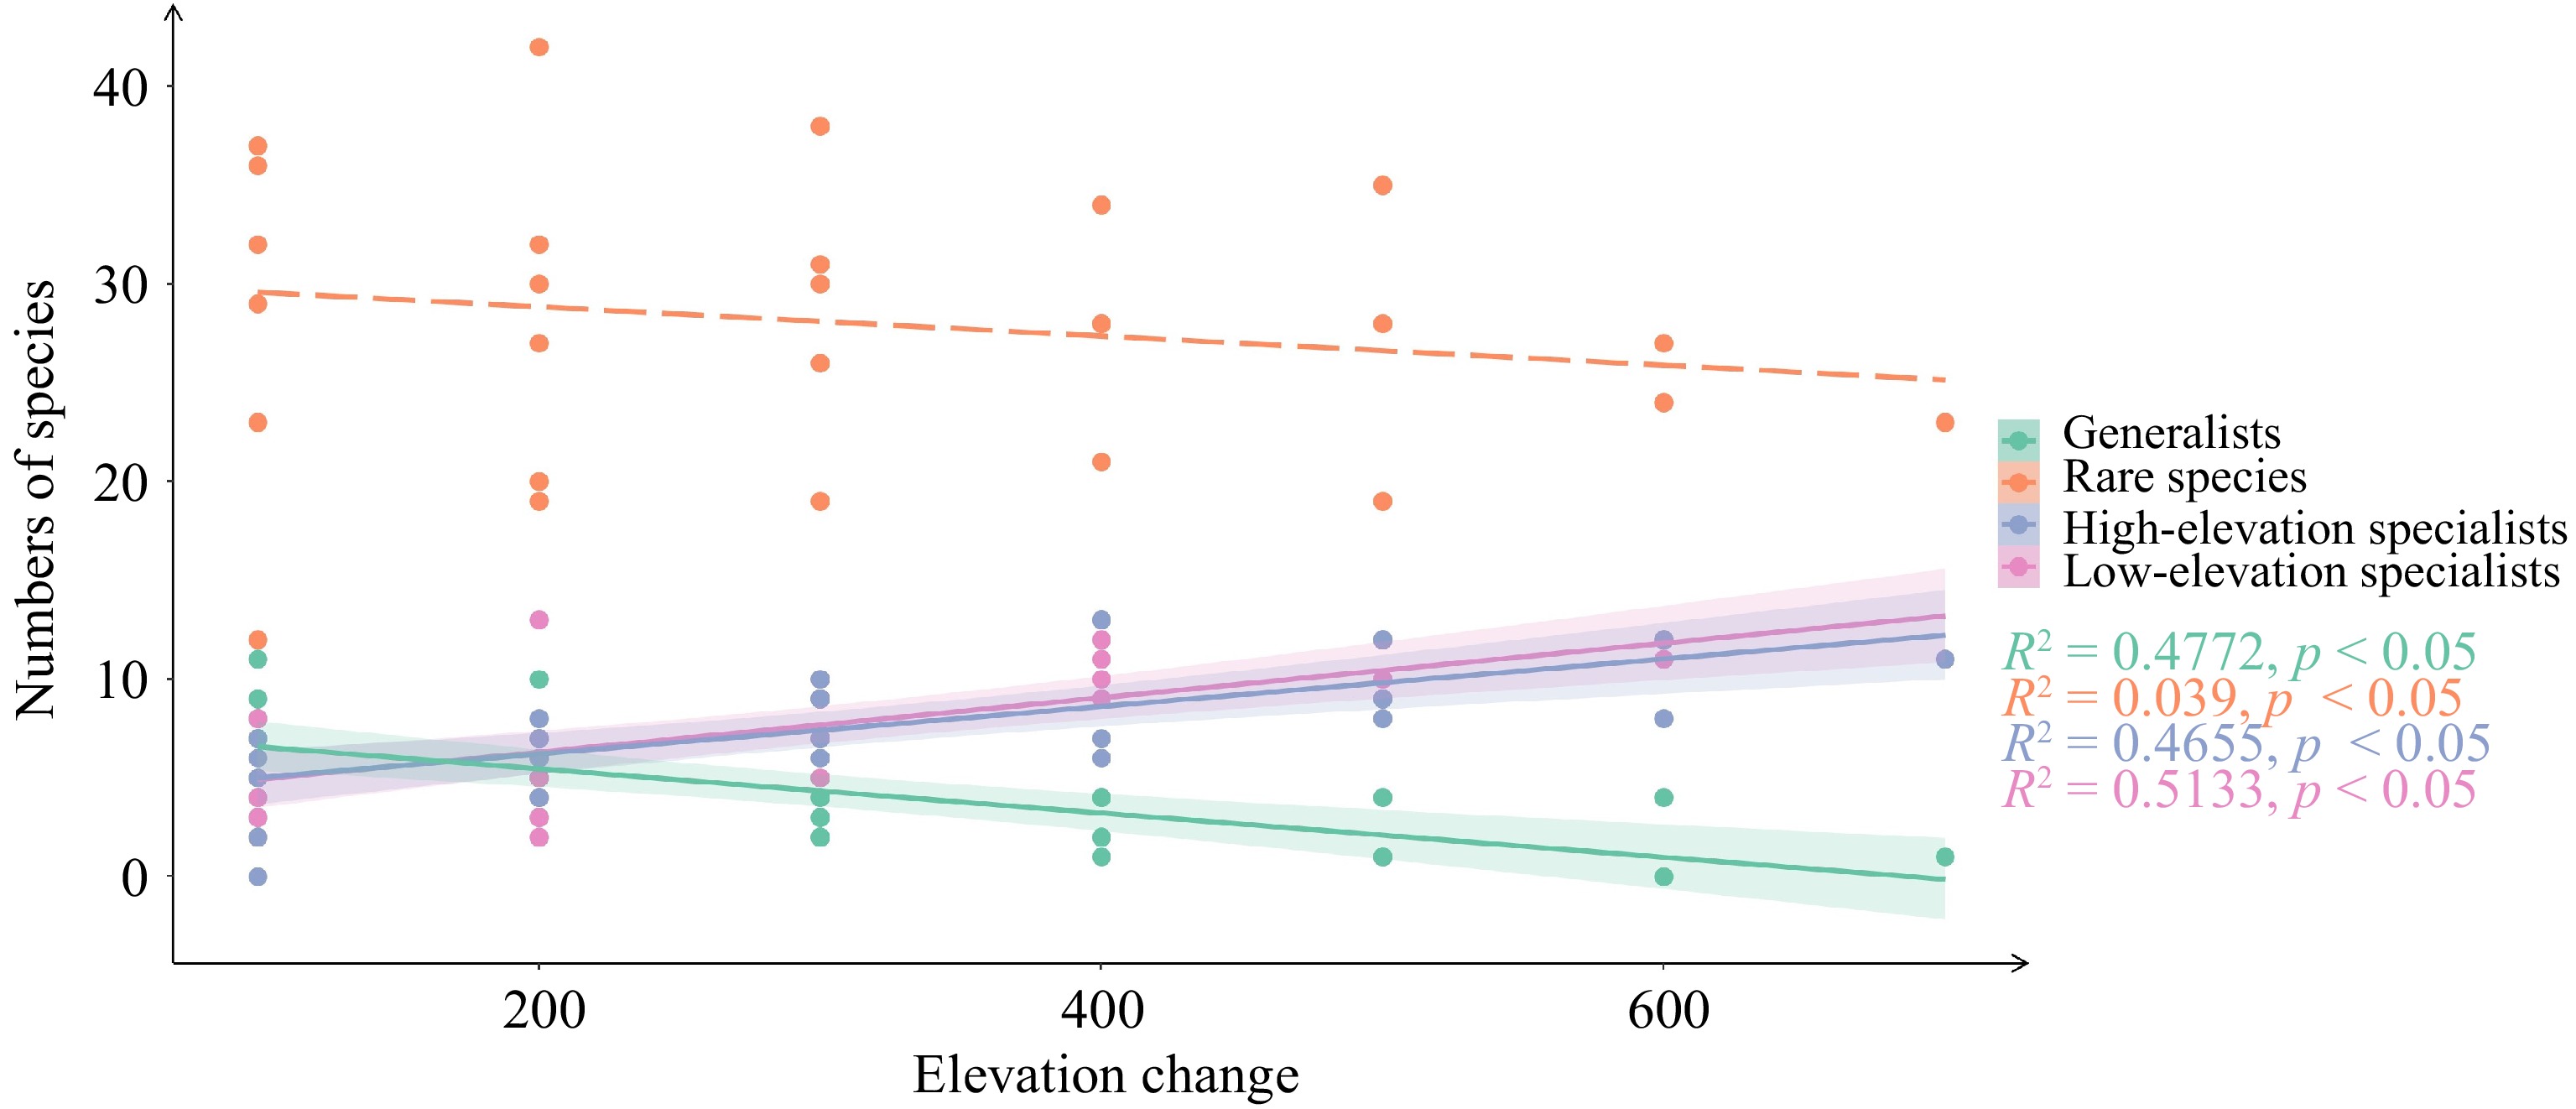
Figure 2.
Community species composition with the increase of elevation changes. The elevation changes refer to the vertical difference in height between two paired elevations.
-
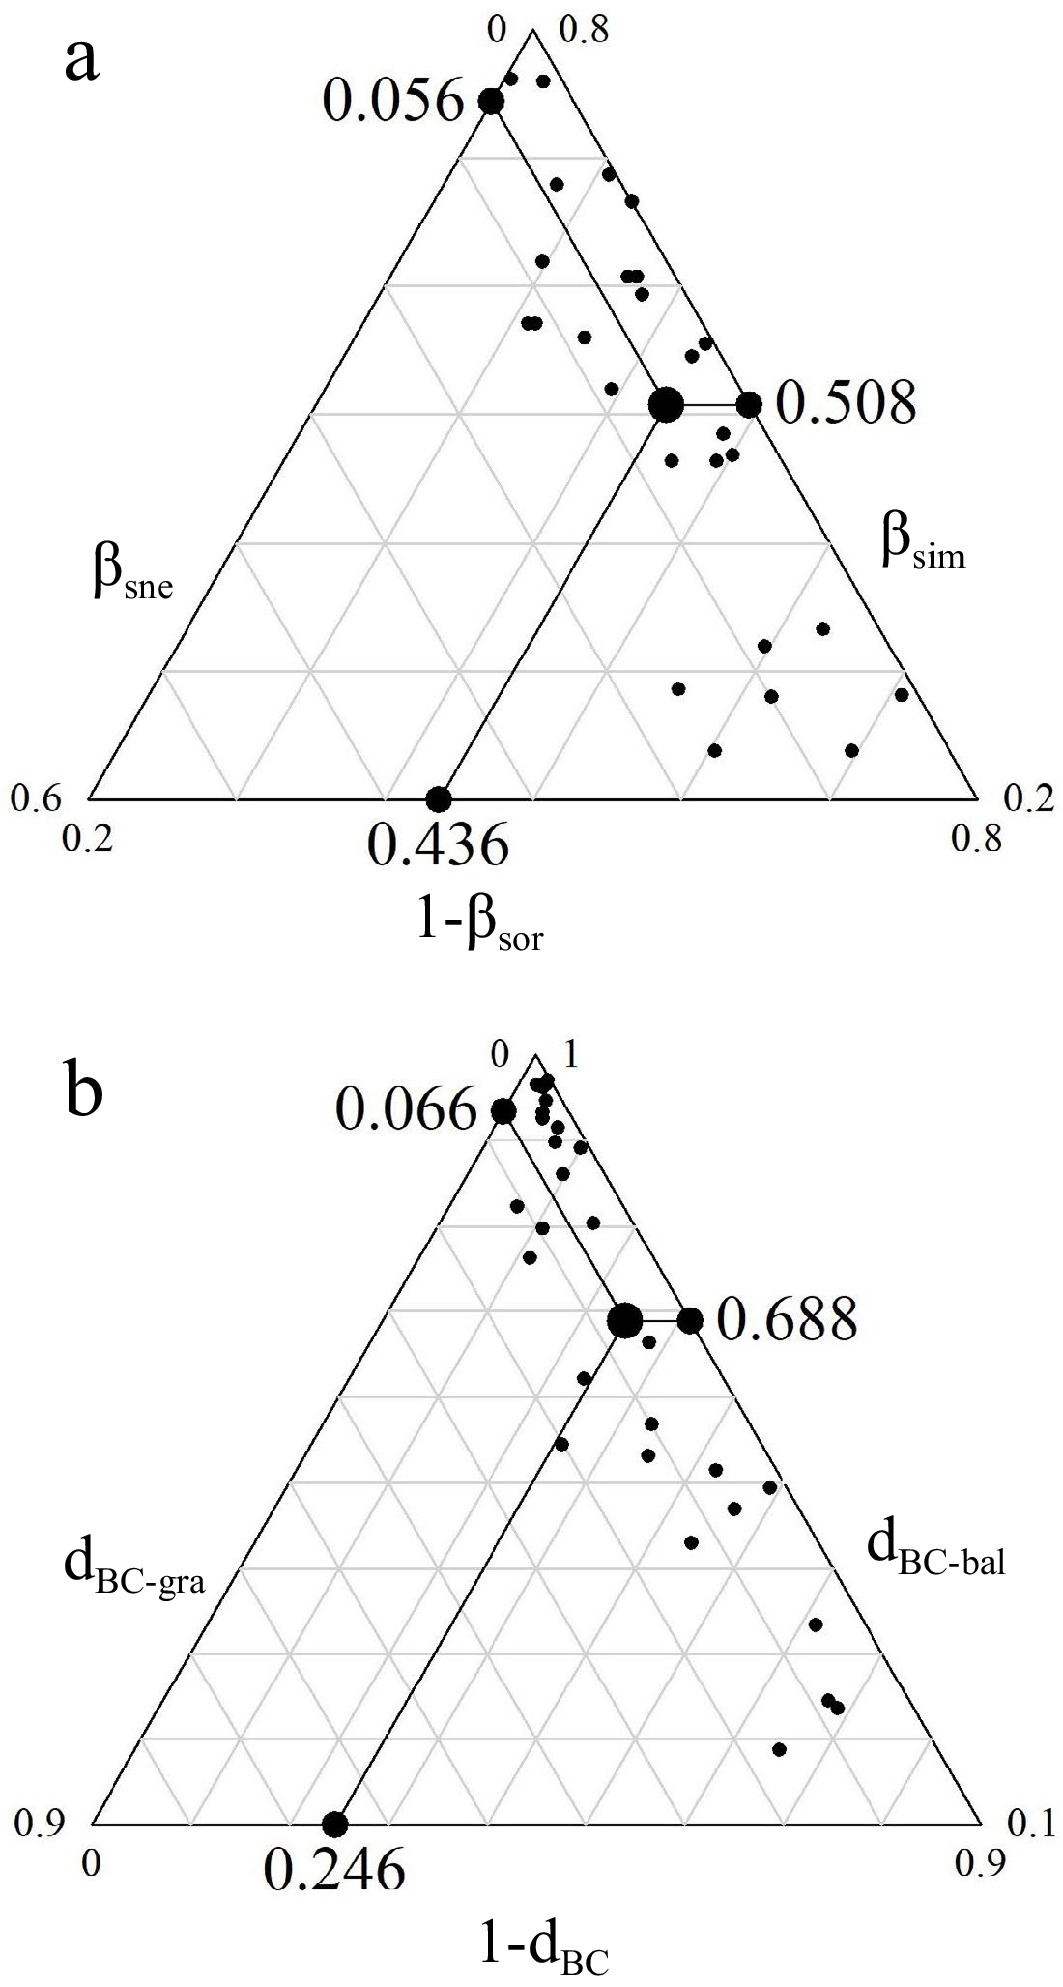
Figure 3.
Community beta diversity and its components in Daiyun Mountain. (a) Displays the beta diversity (βsor), species turnover (βsim), and species nestedness (βsne) using presence-absence data. (b) Presents the Bray-Curtis distance (dBC), balanced variation (dBC-bal), and abundance gradient (dBC-gra) using abundance data.
-
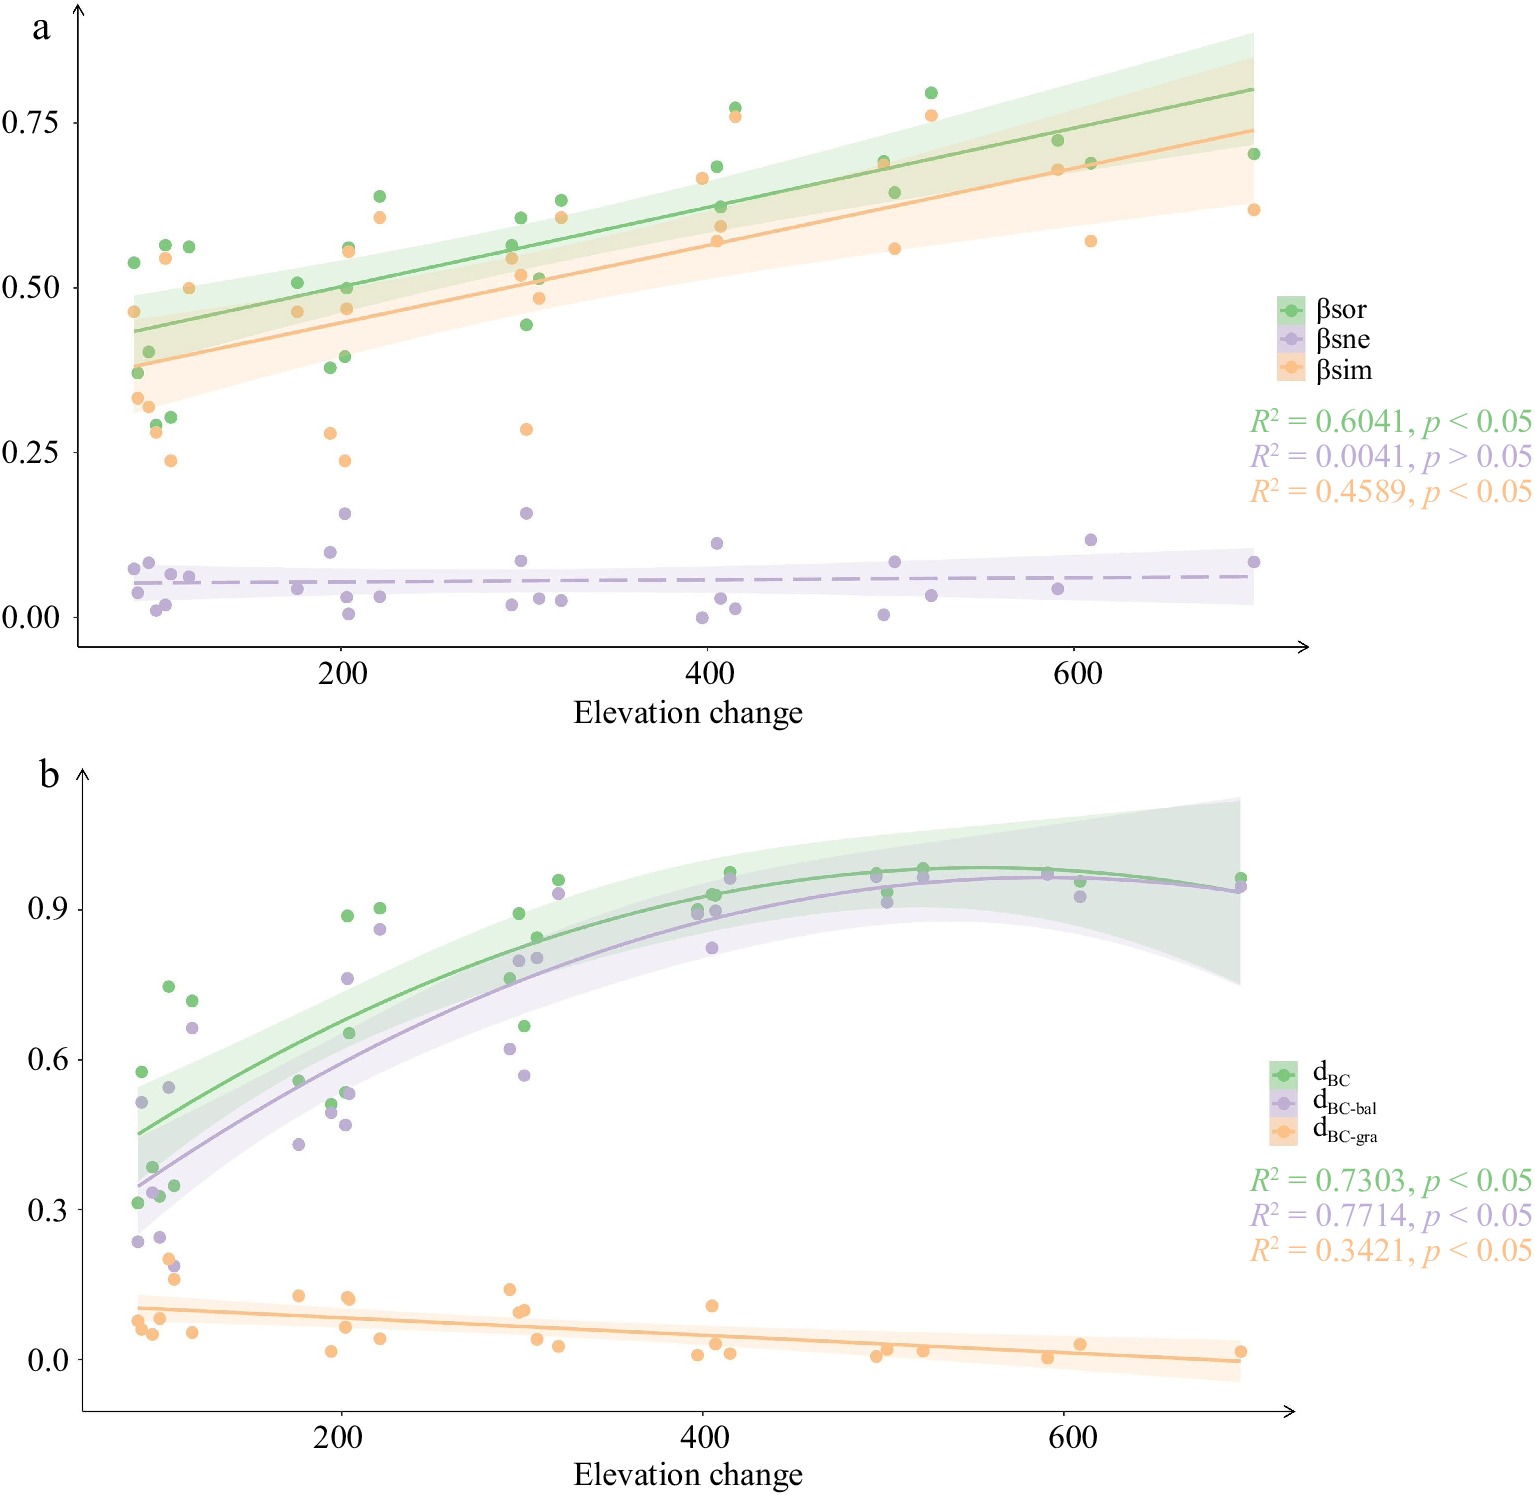
Figure 4.
Community beta diversity and its components changed with the increase of elevation change. (a) Presence-absence data. (b) Abundance data.
-
Plots Abundance Species richness Dominant species
(importance value)DYS900 682 33 Cyclobalanopsis glauca (34.816) DYS1000 509 35 Cunninghamia lanceolata (34.672) DYS1100 432 31 C. lanceolata (33.510) DYS1200 333 39 C. lanceolata (17.609); Machilus thunbergii (14.473) DYS1300 809 32 Eurya rubiginosa var. attenuata (16.141); Pinus taiwanensis (15.129) DYS1400 1,007 31 P. taiwanensis (27.780) DYS1500 864 25 P. taiwanensis (32.591) DYS1600 1,290 24 P. taiwanensis (31.874) Table 1.
Community structure and species composition of wood plant community in Daiyun Mountain.
-
Dataset Responsible
variableModel R2 p Presence-absence βsor ~AT+SLOP 0.560 0.006 AT 0.923 0.002 SLOP 0.601 0.097 βsim ~AT+SLOP 0.565 0.005 AT 0.883 0.008 SLOP 0.657 0.066 βsne ~AT+SLOP 0.178 0.950 AT 0.280 0.417 SLOP 0.916 0.001 Abundance dBC ~AT+SLOP 0.647 0.002 AT 0.884 0.005 SLOP 0.782 0.017 dBC-bal ~AT+SLOP 0.669 0.004 AT 0.838 0.010 SLOP 0.602 0.106 dBC-gra ~AT+SLOP 0.228 0.872 AT 0.143 0.690 SLOP 0.860 0.009 AT and SLOP are air temperature and slope, respectively. Table 2.
dbRDA analysis based on presence-absence data and abundance data.
Figures
(4)
Tables
(2)