-
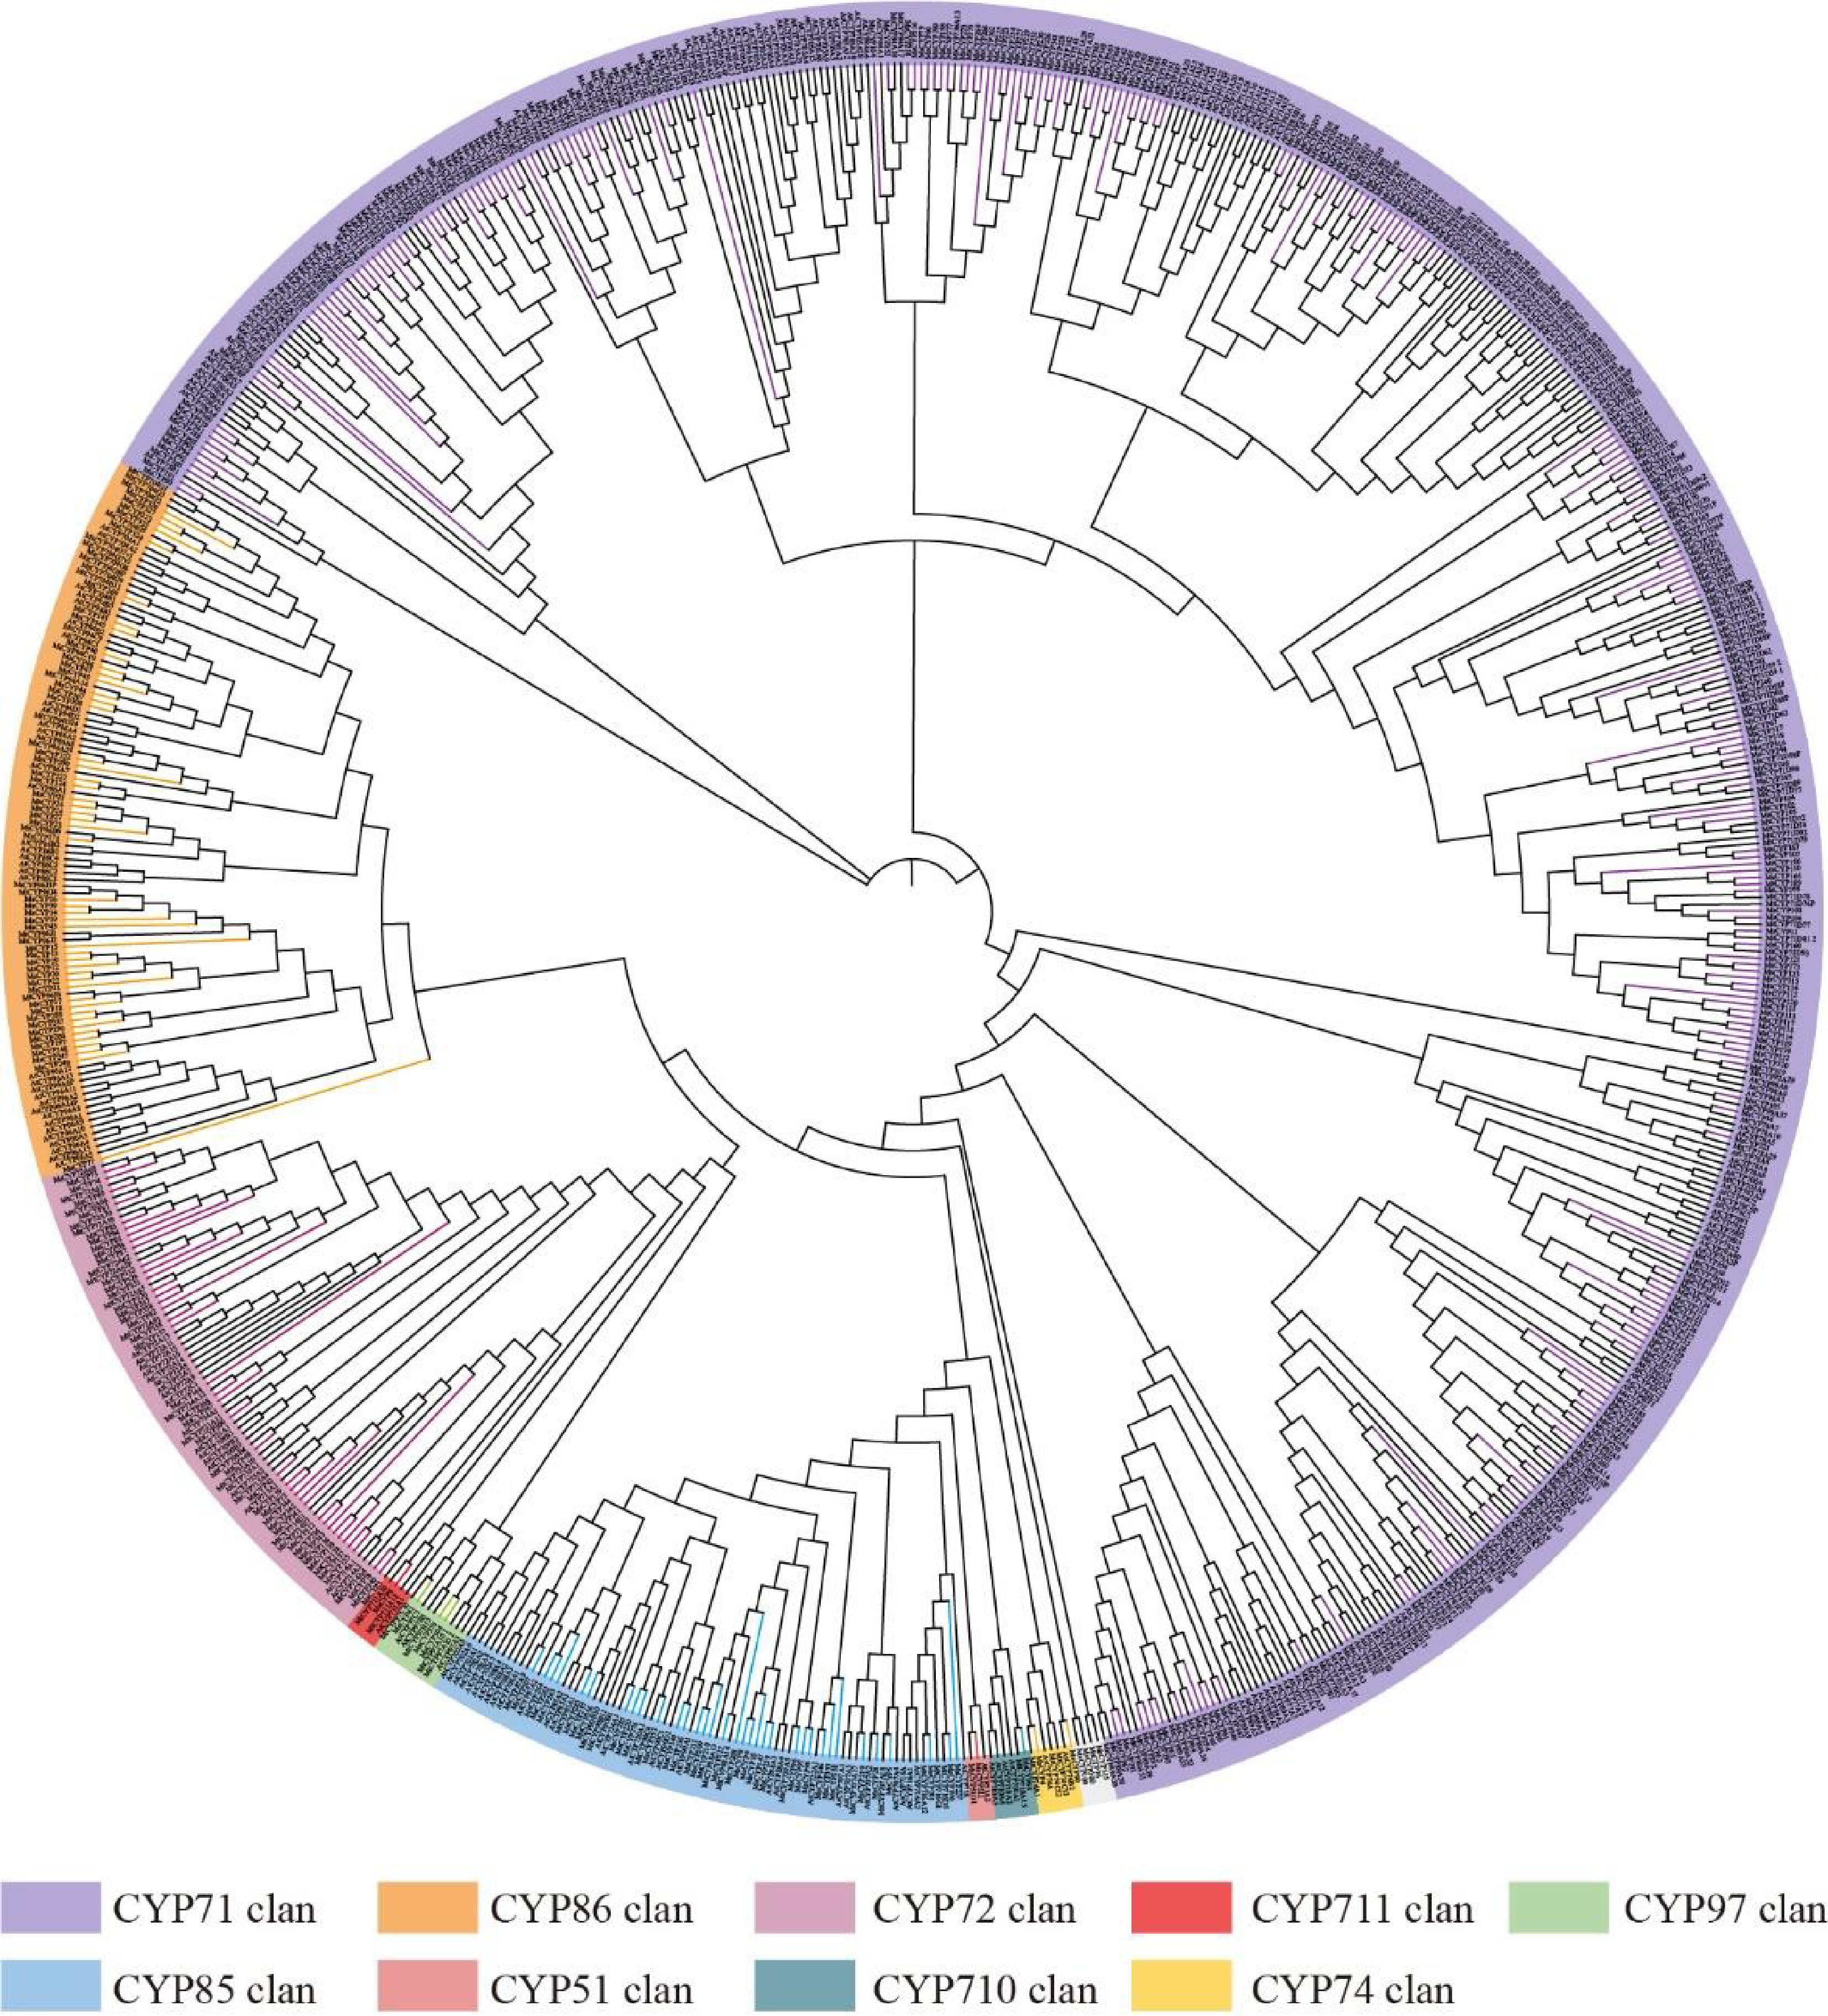
Figure 1.
Phylogenetic analysis of CYP genes from alfalfa, thistle alfalfa, and Arabidopsis. Different colors represent different groups.
-
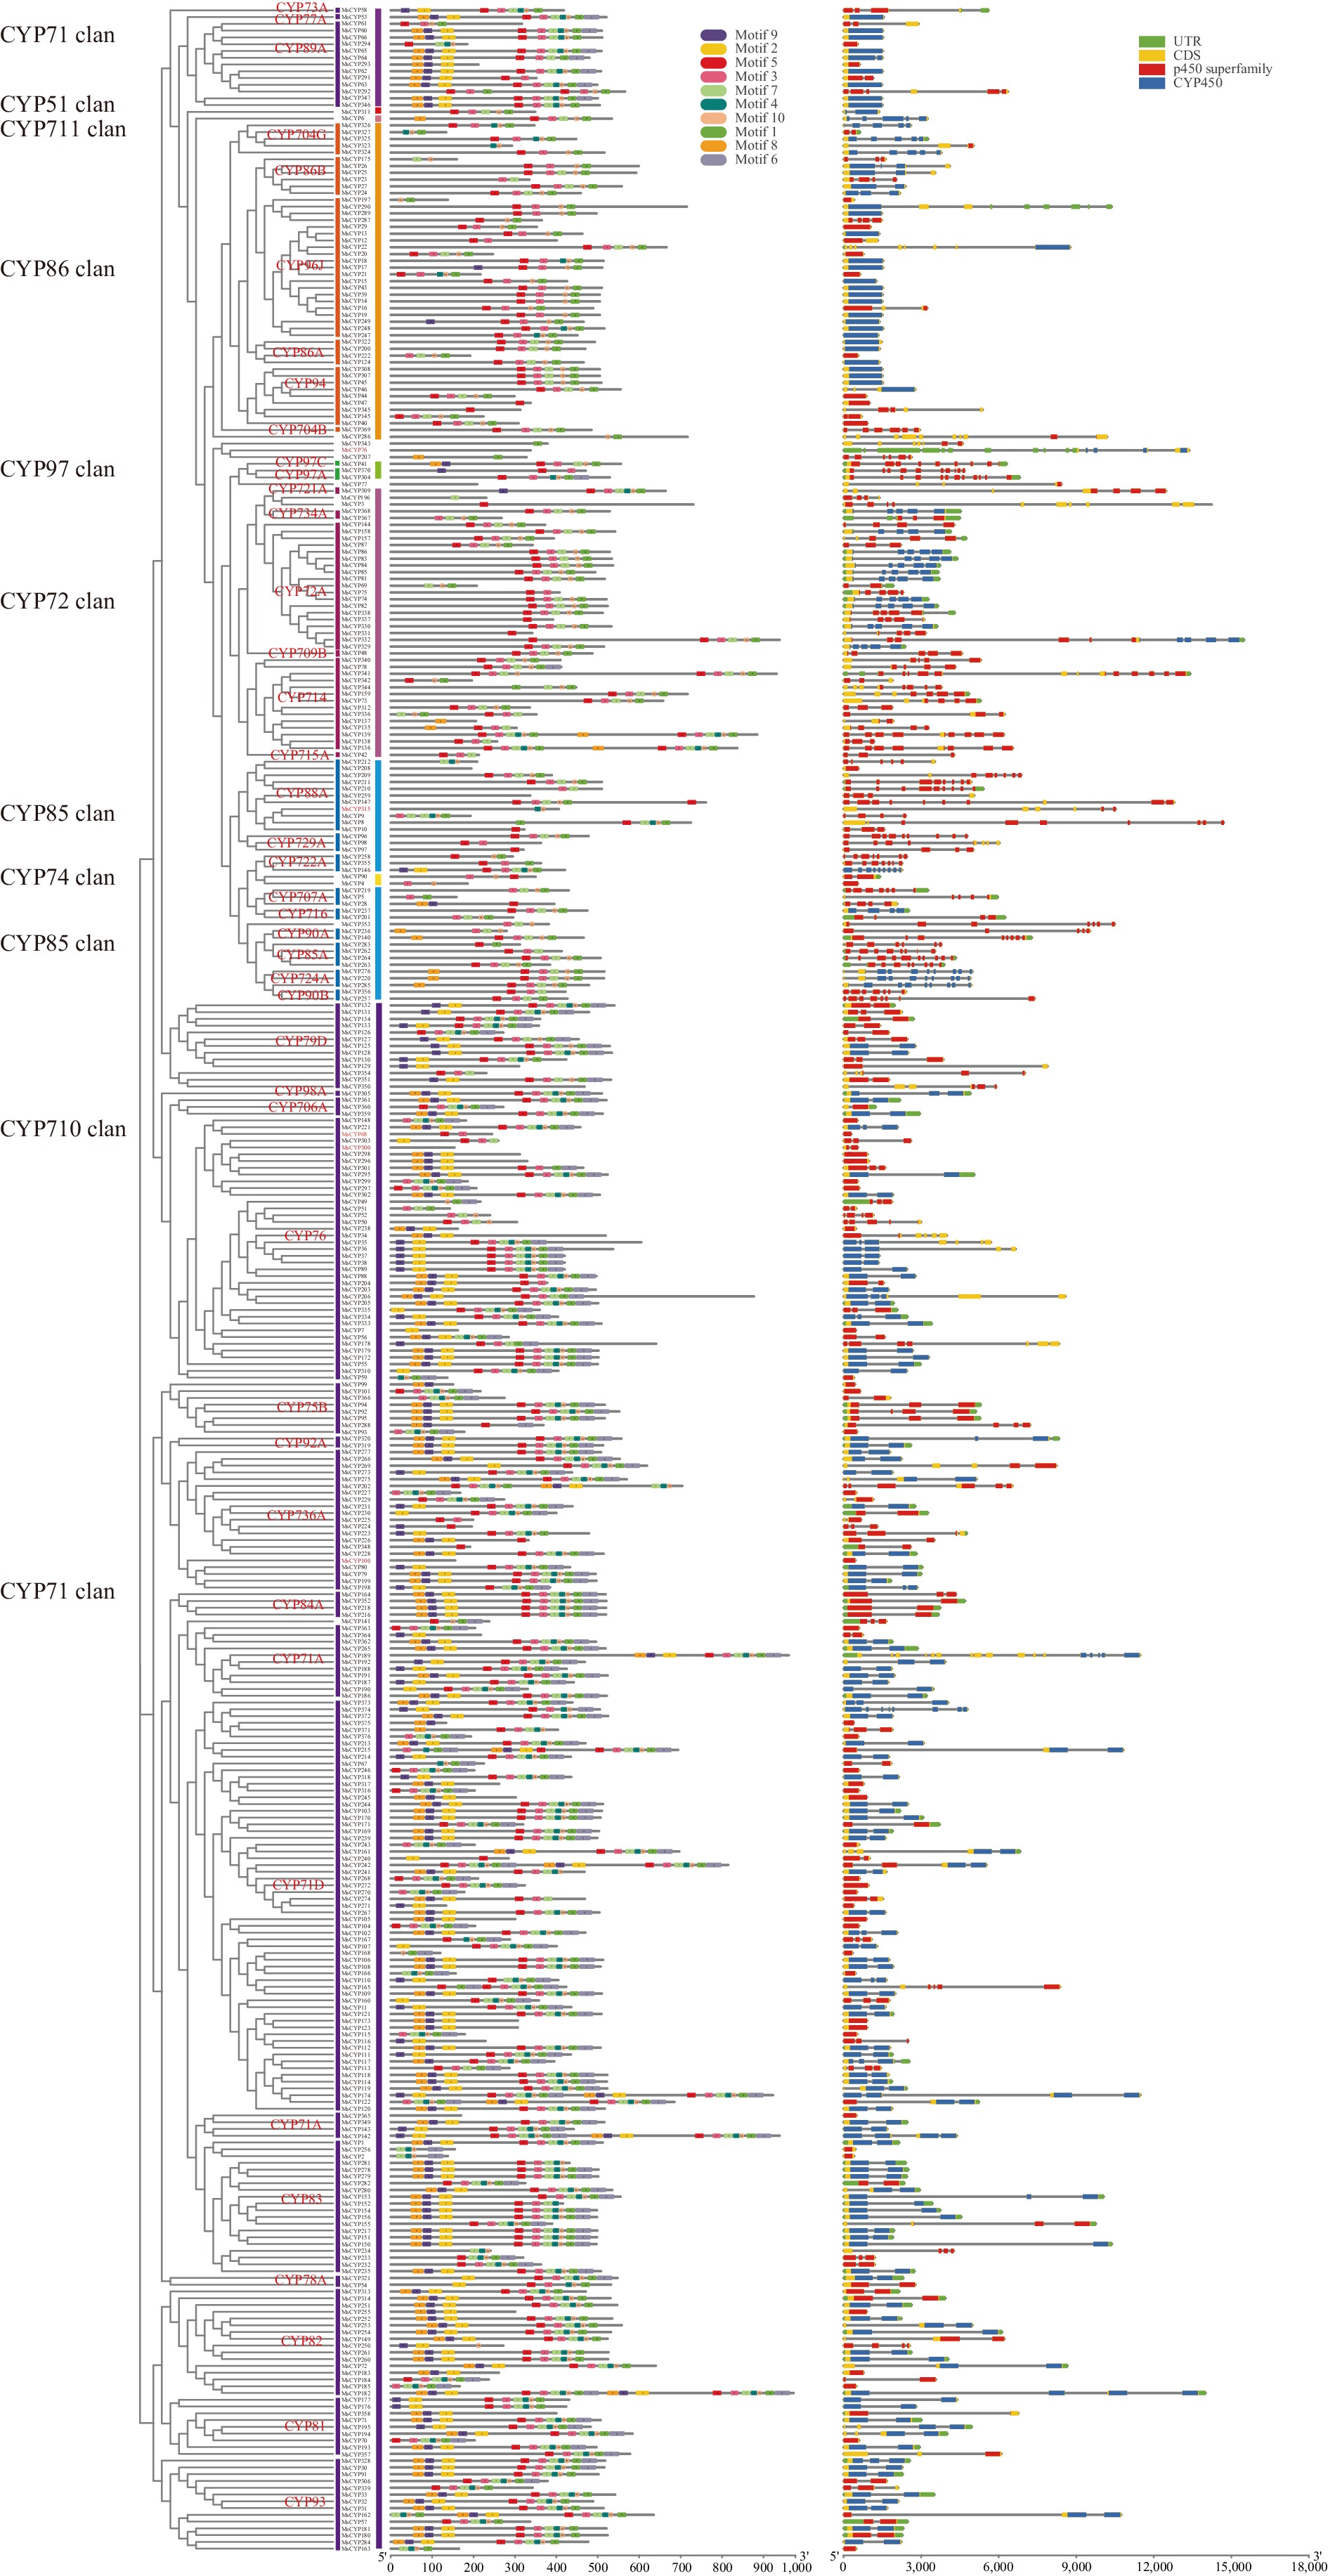
Figure 2.
Phylogeny, conserved motifs, and exon–intron structure of MsCYP genes.
-
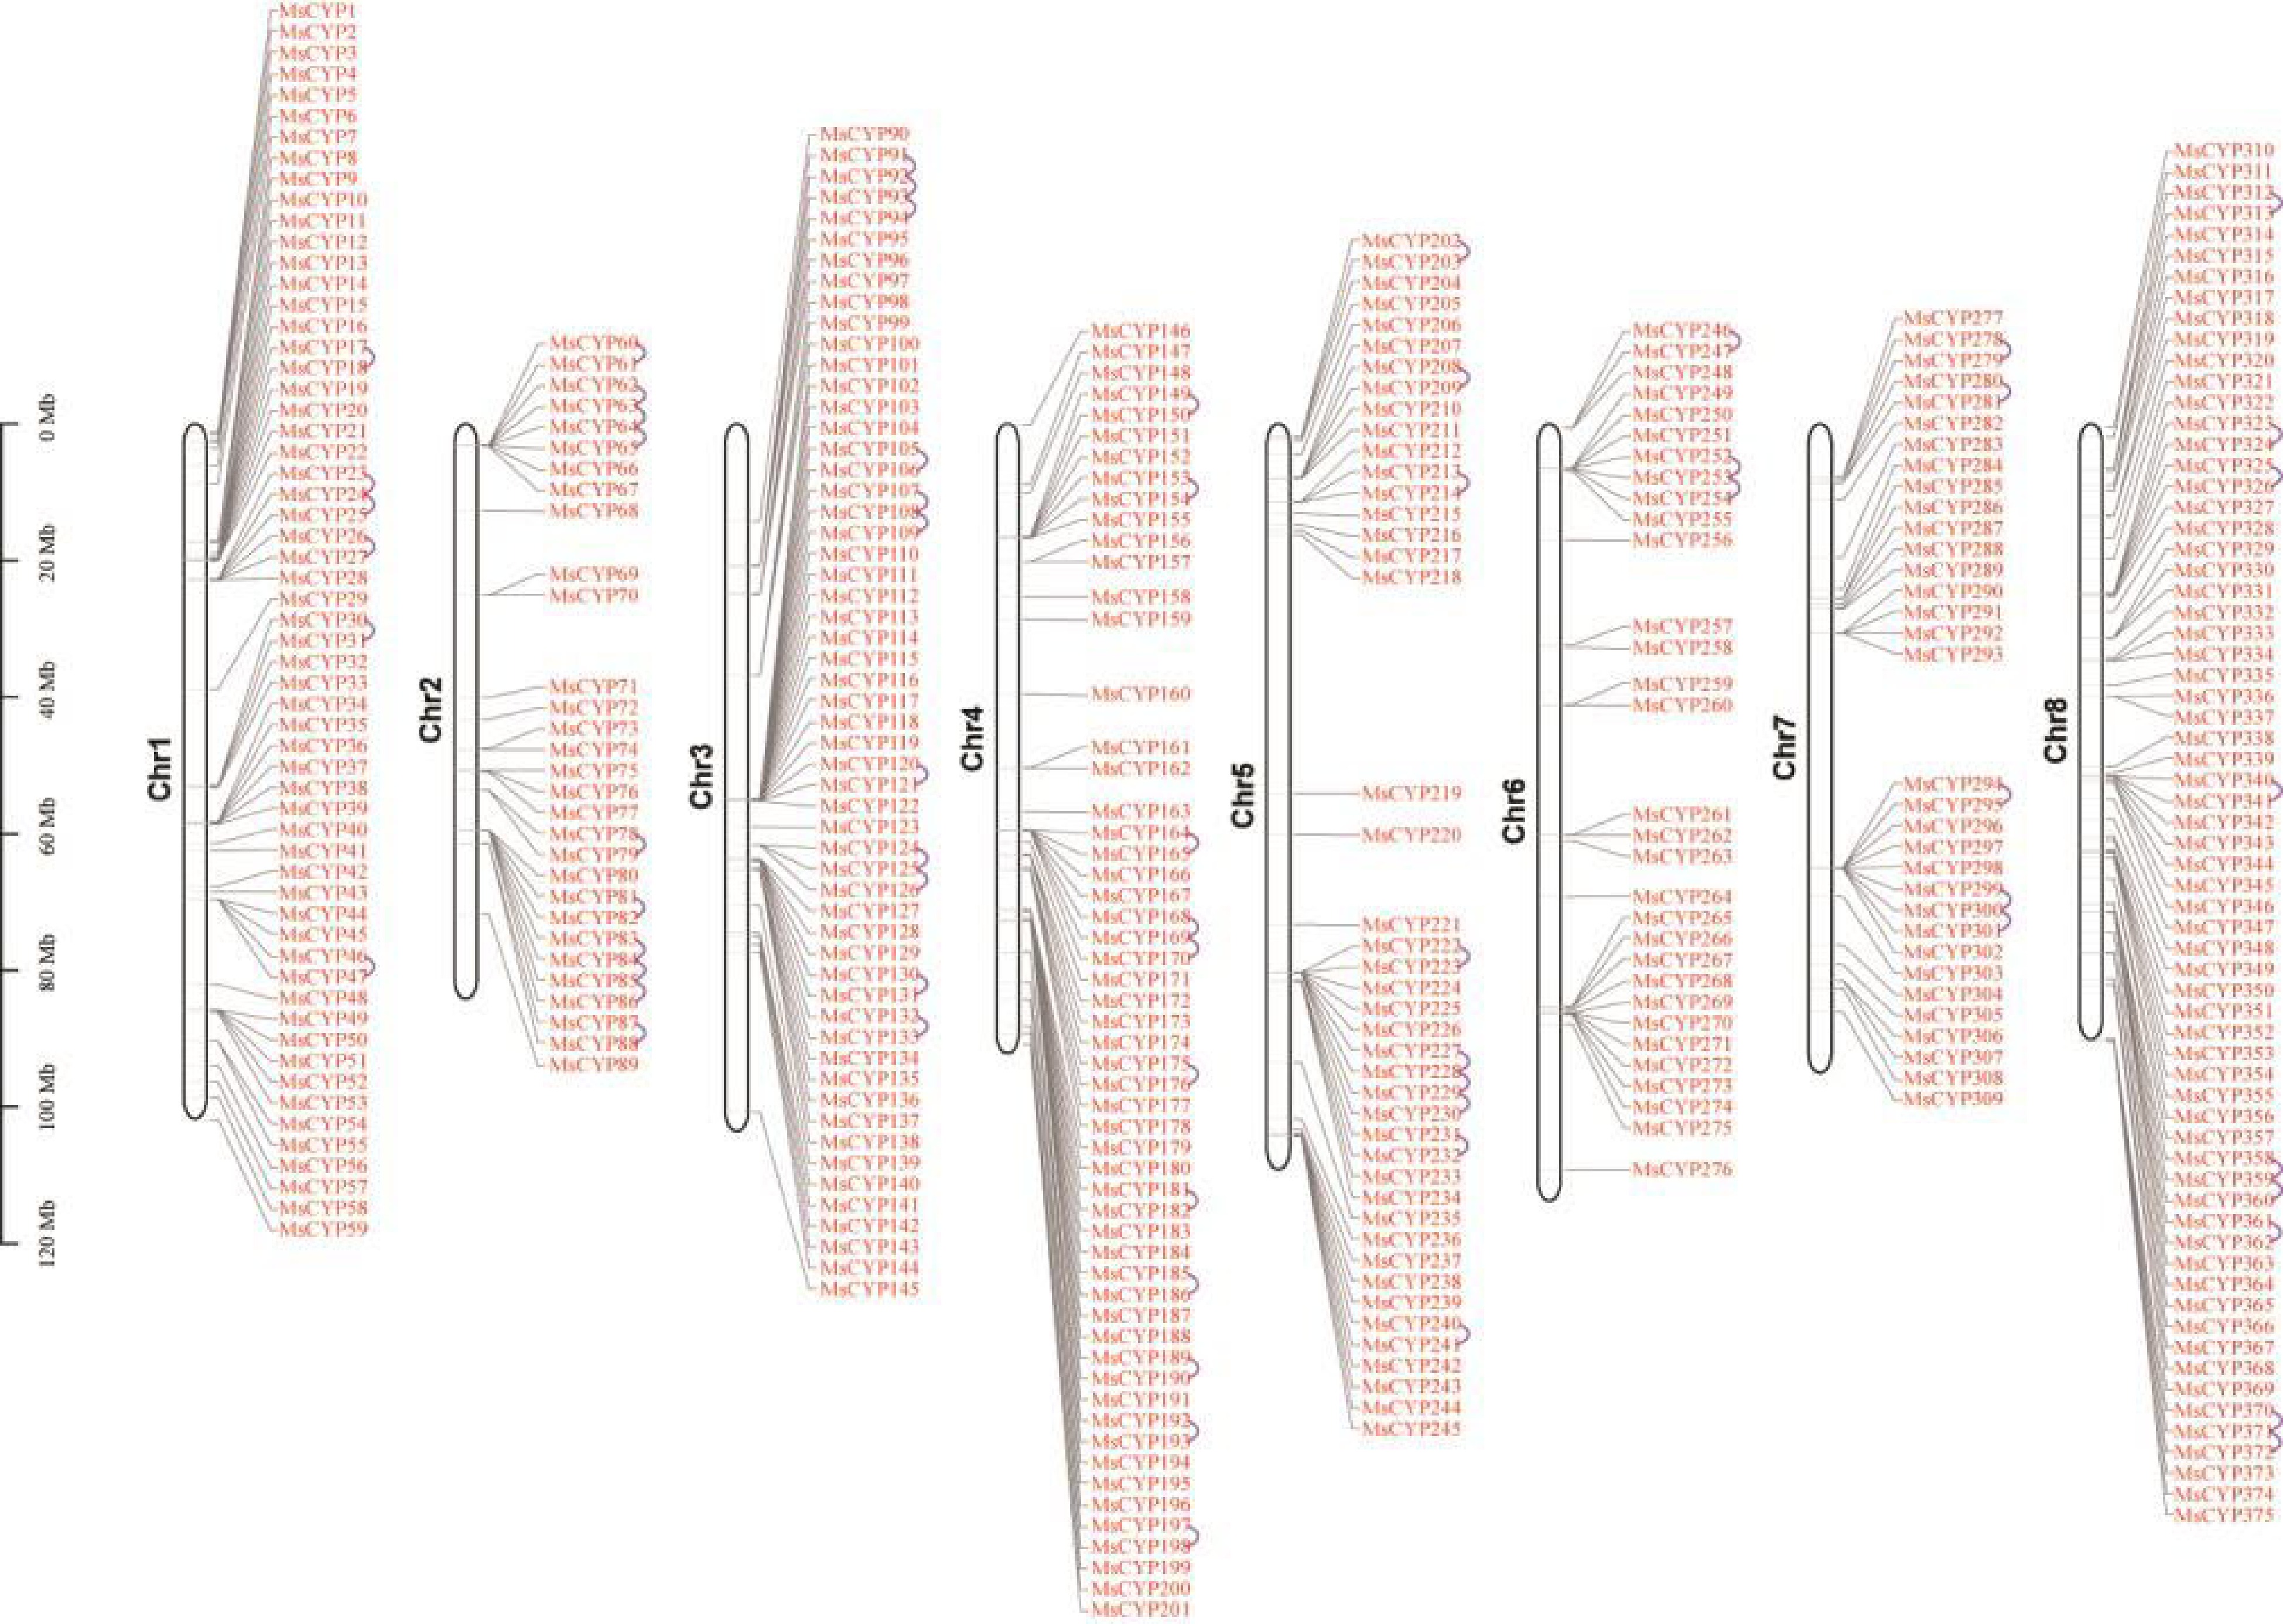
Figure 3.
Chromosomal locations of MsCYP genes. Tandem duplicates are marked with curved lines.
-
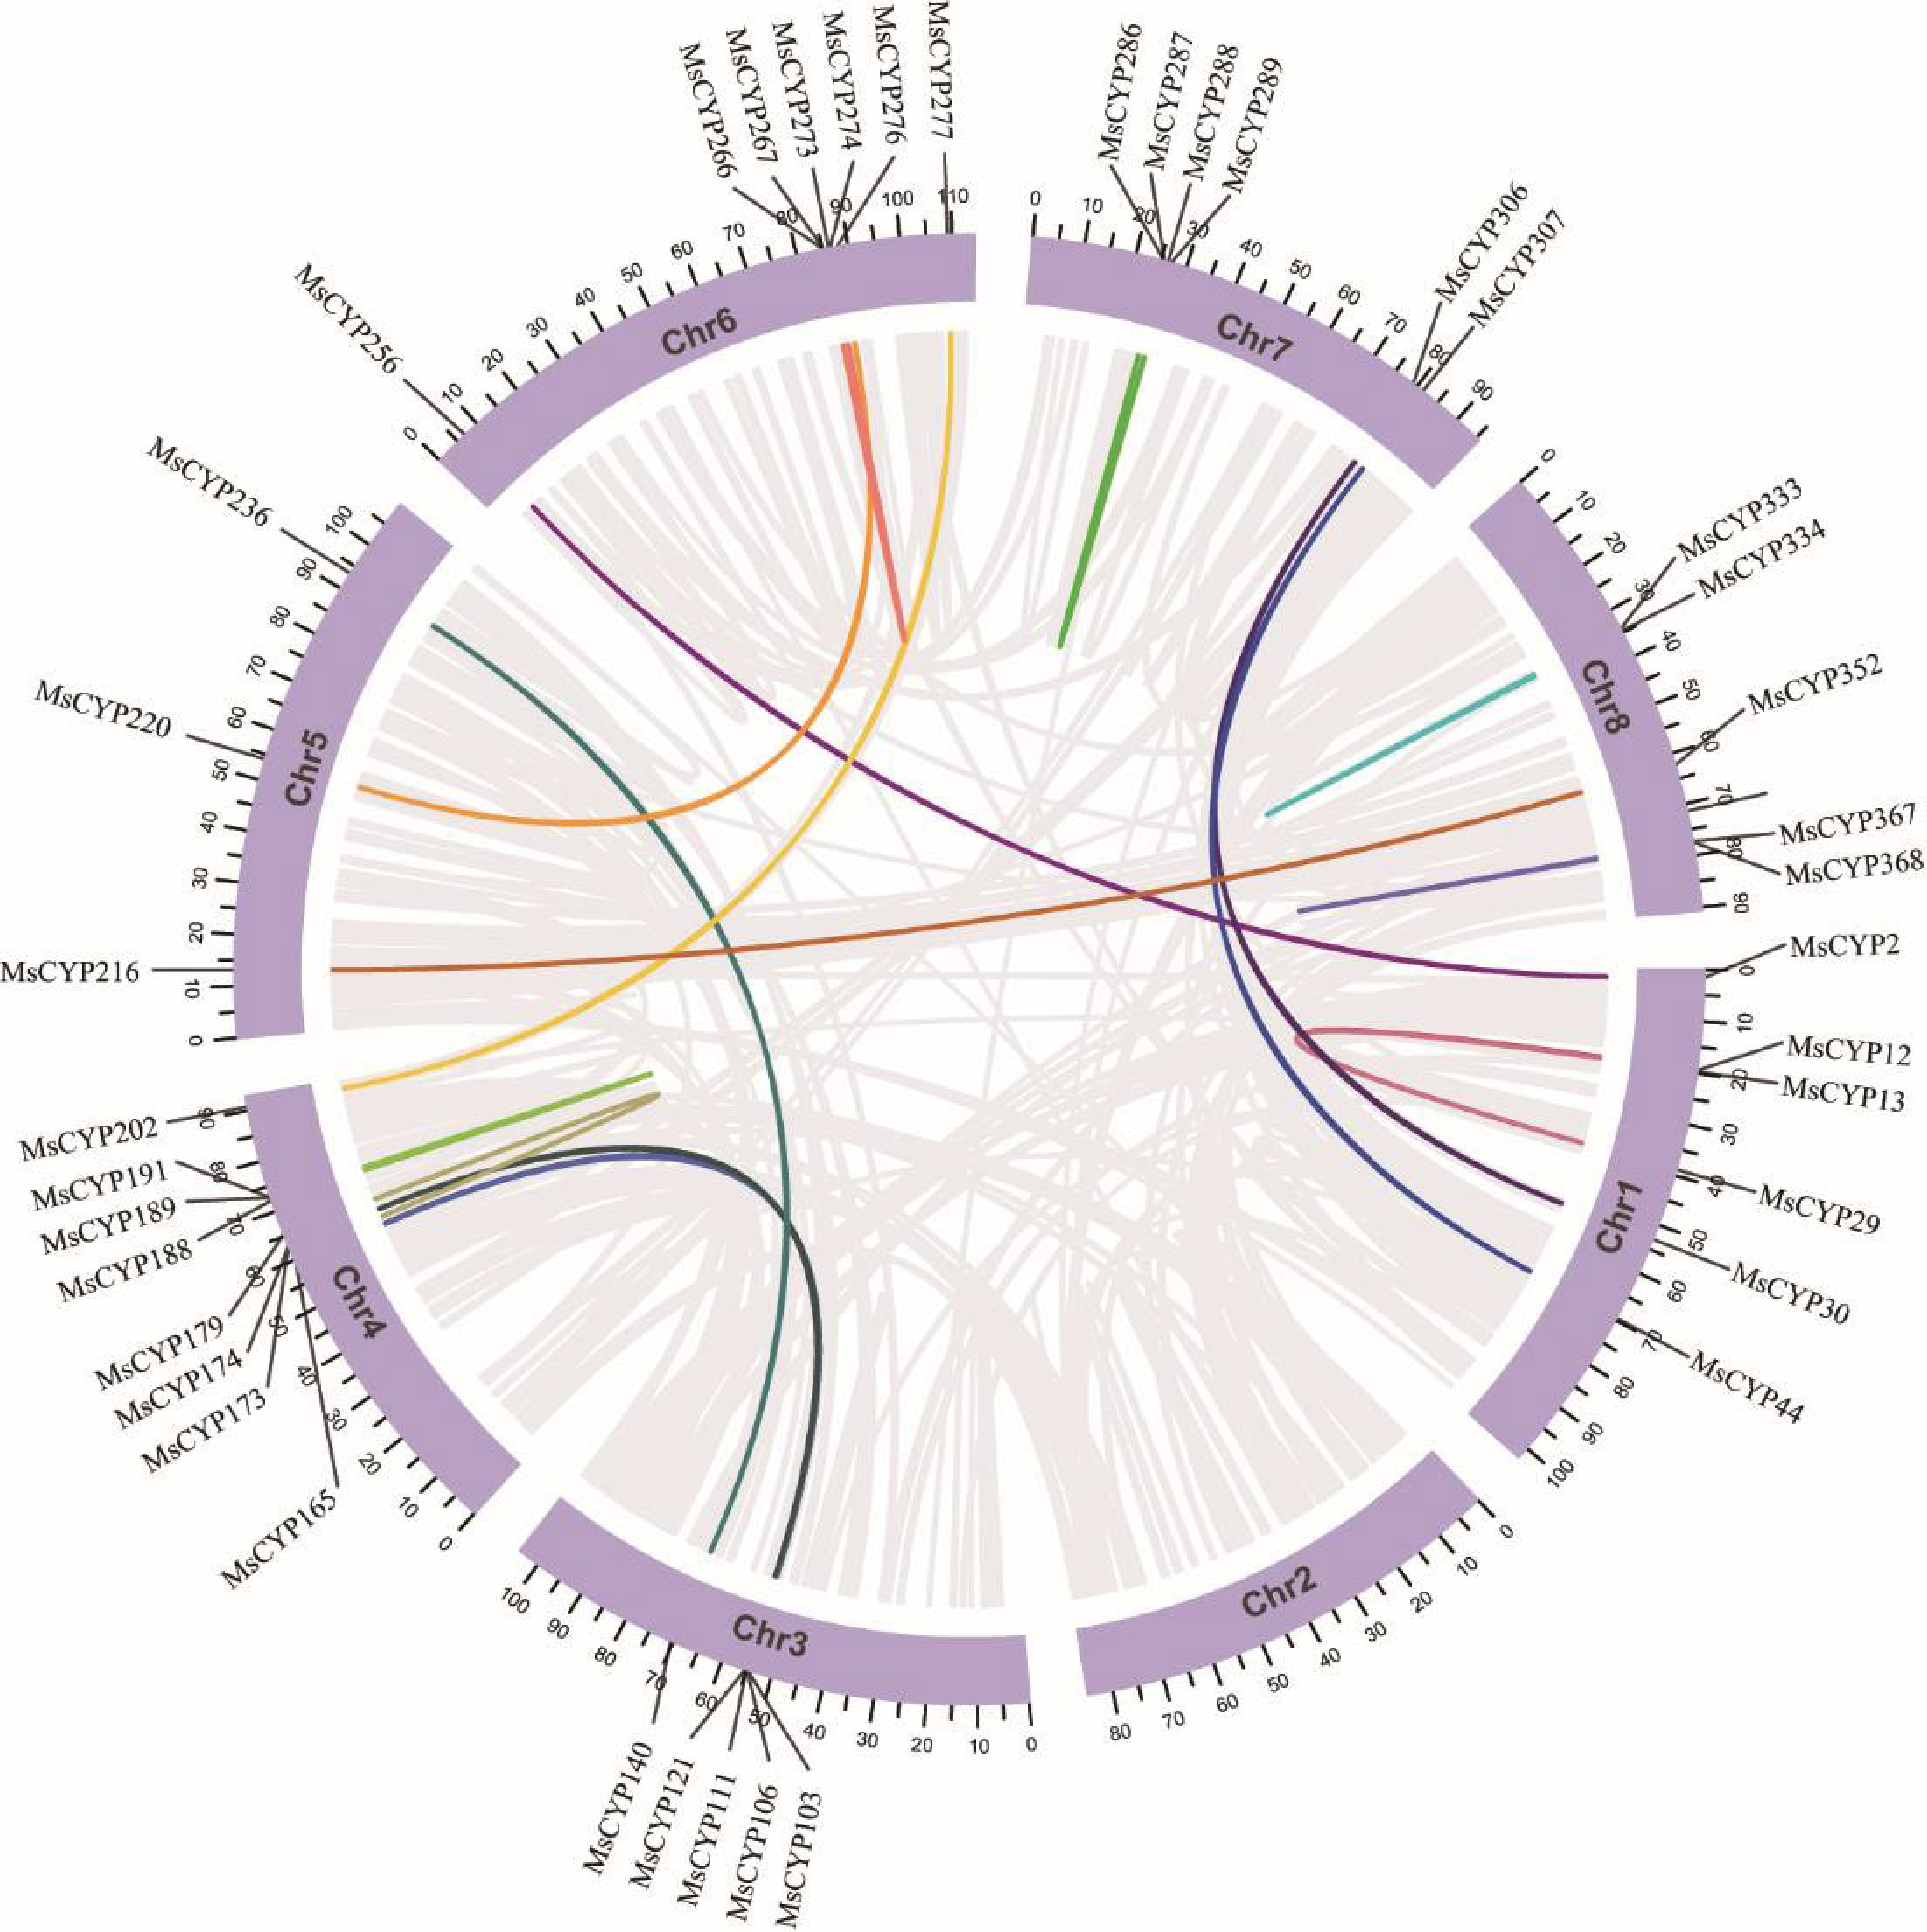
Figure 4.
Synteny analysis of alfalfa CYP genes. Different segmental duplicate pairs are linked with different colors.
-
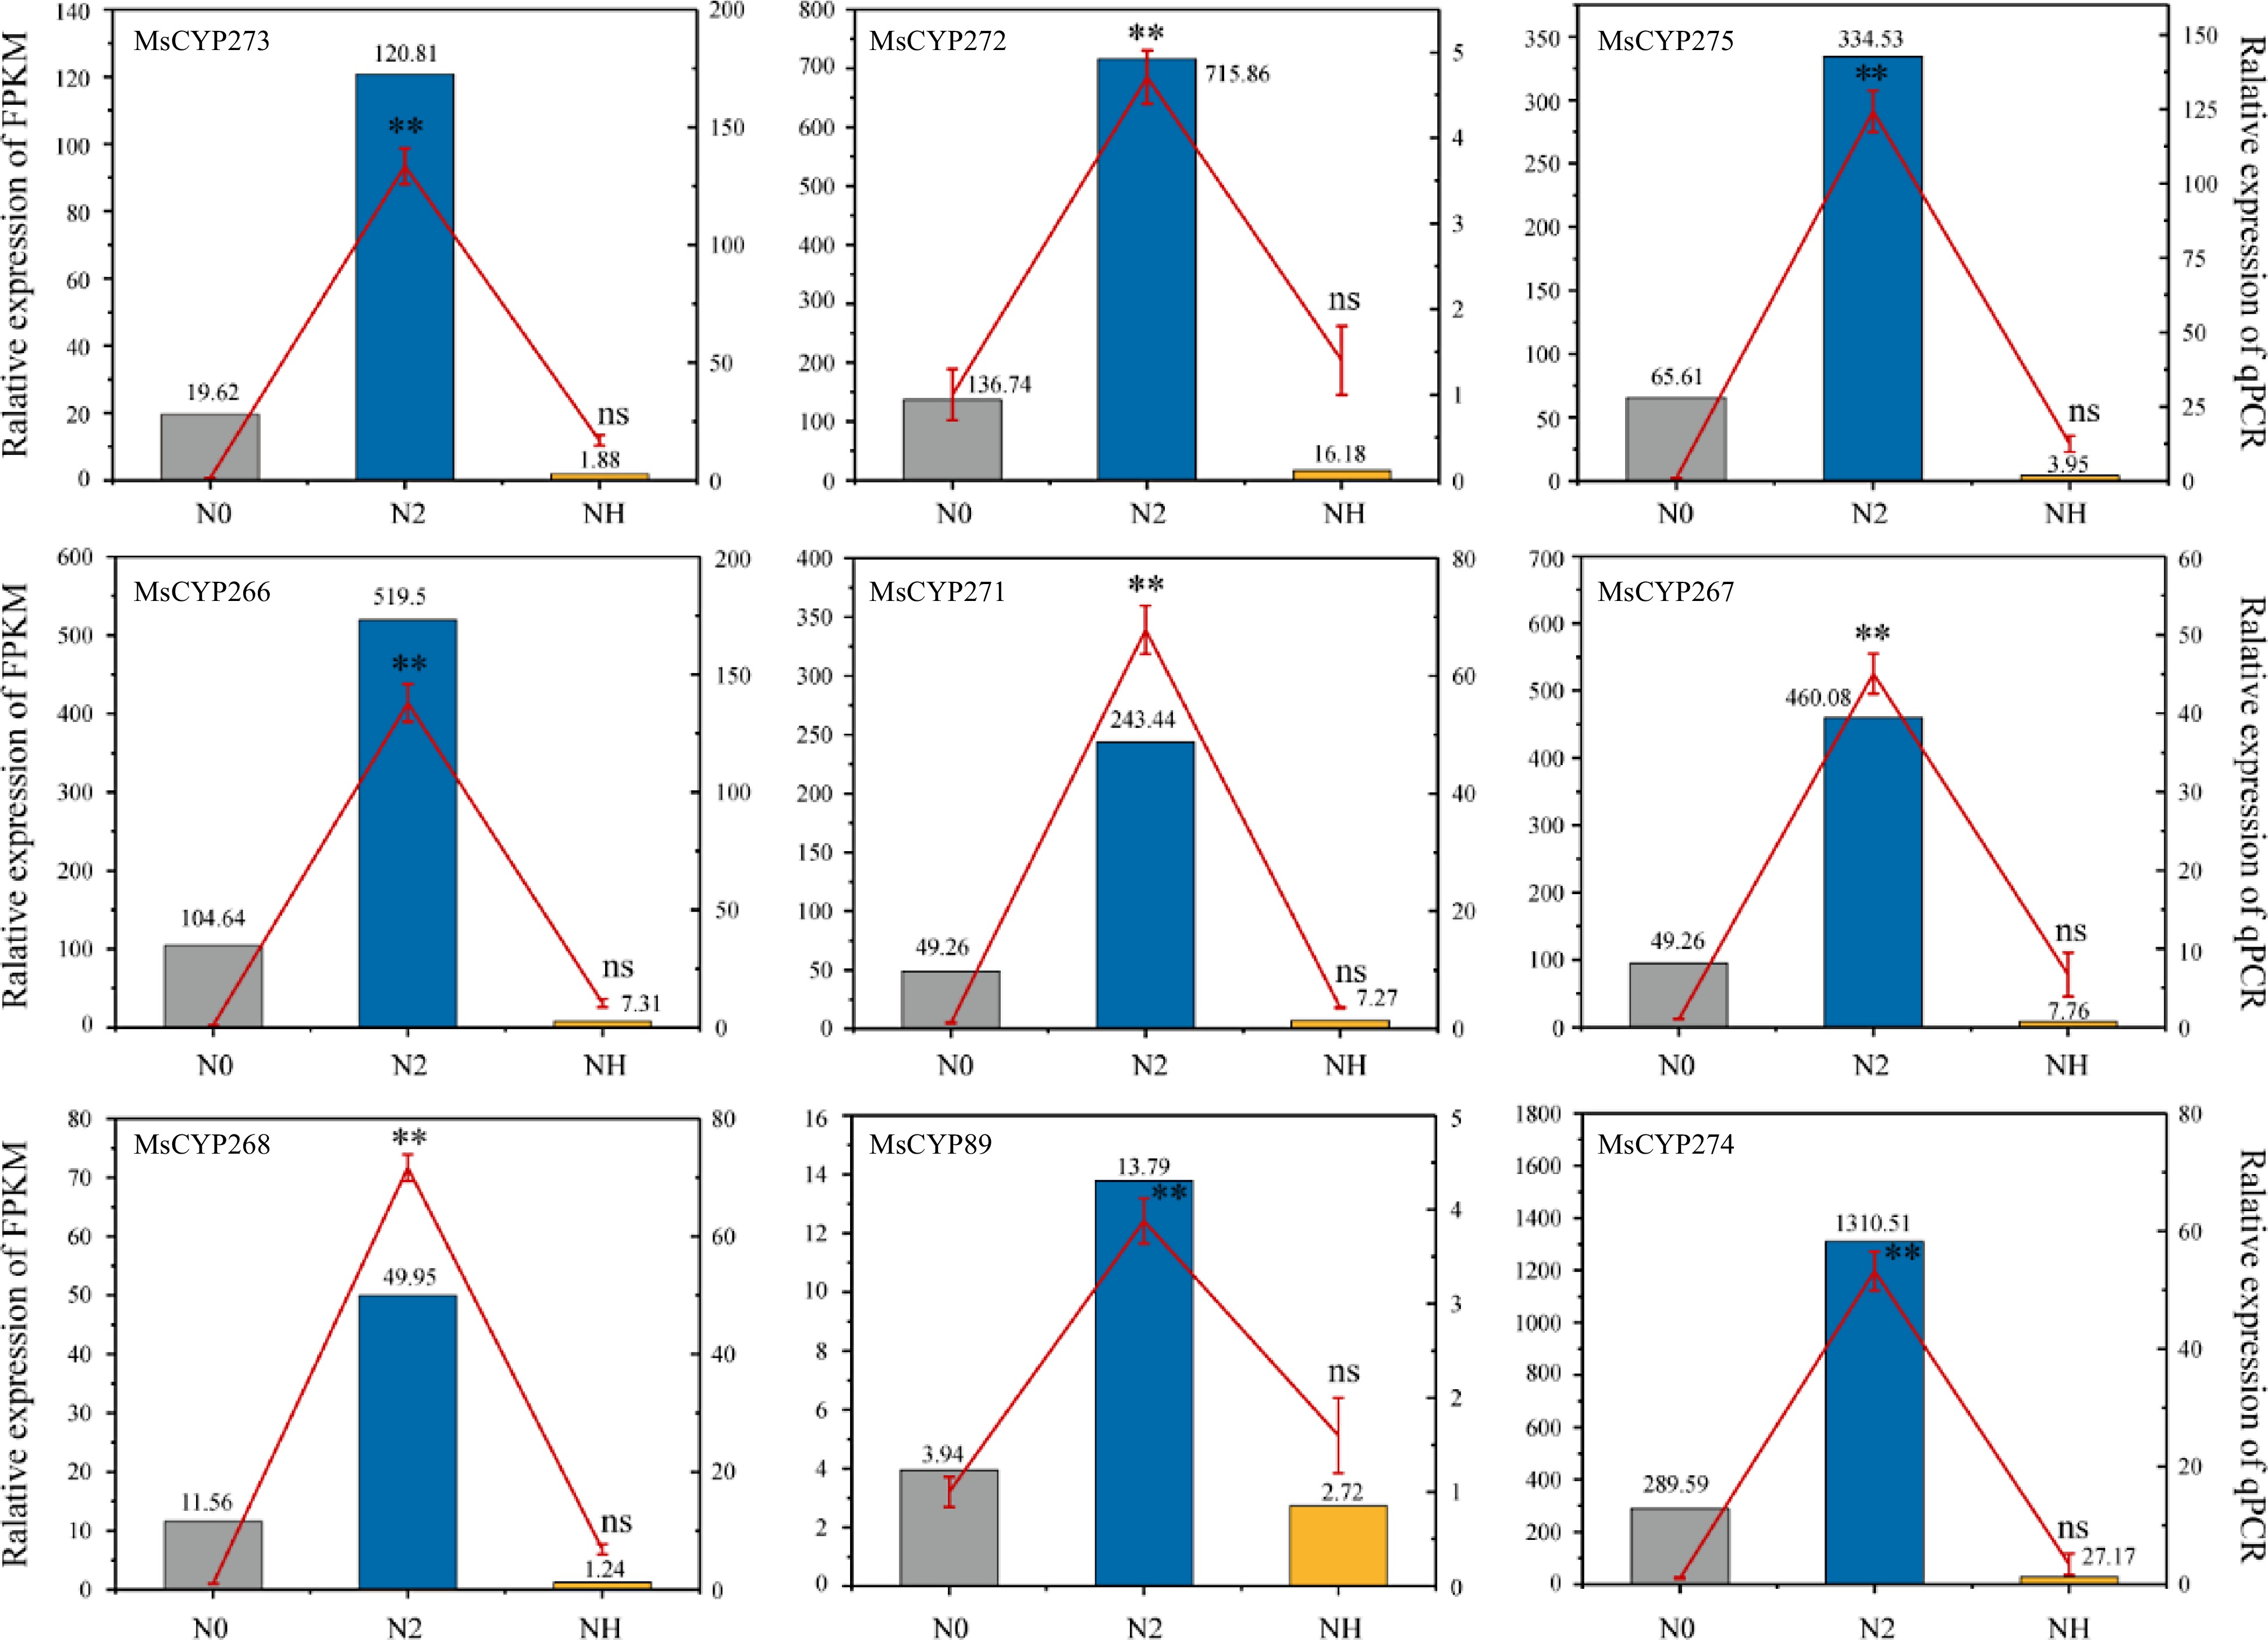
Figure 5.
Expression pattern of nine key MsCYP genes. The column indicates RNA-seq data, the red line indicates RT-qPCR data, and the error bar indicates the standard error of the mean (three biological replicates and three technical replicates). **, p < 0.01. ns, not significant. N0 refers to gene expression before salt treatment; N2 refers to gene expression after salt treatment for 2 h; and NH refers to gene expression after rehydration for 3 d.
-
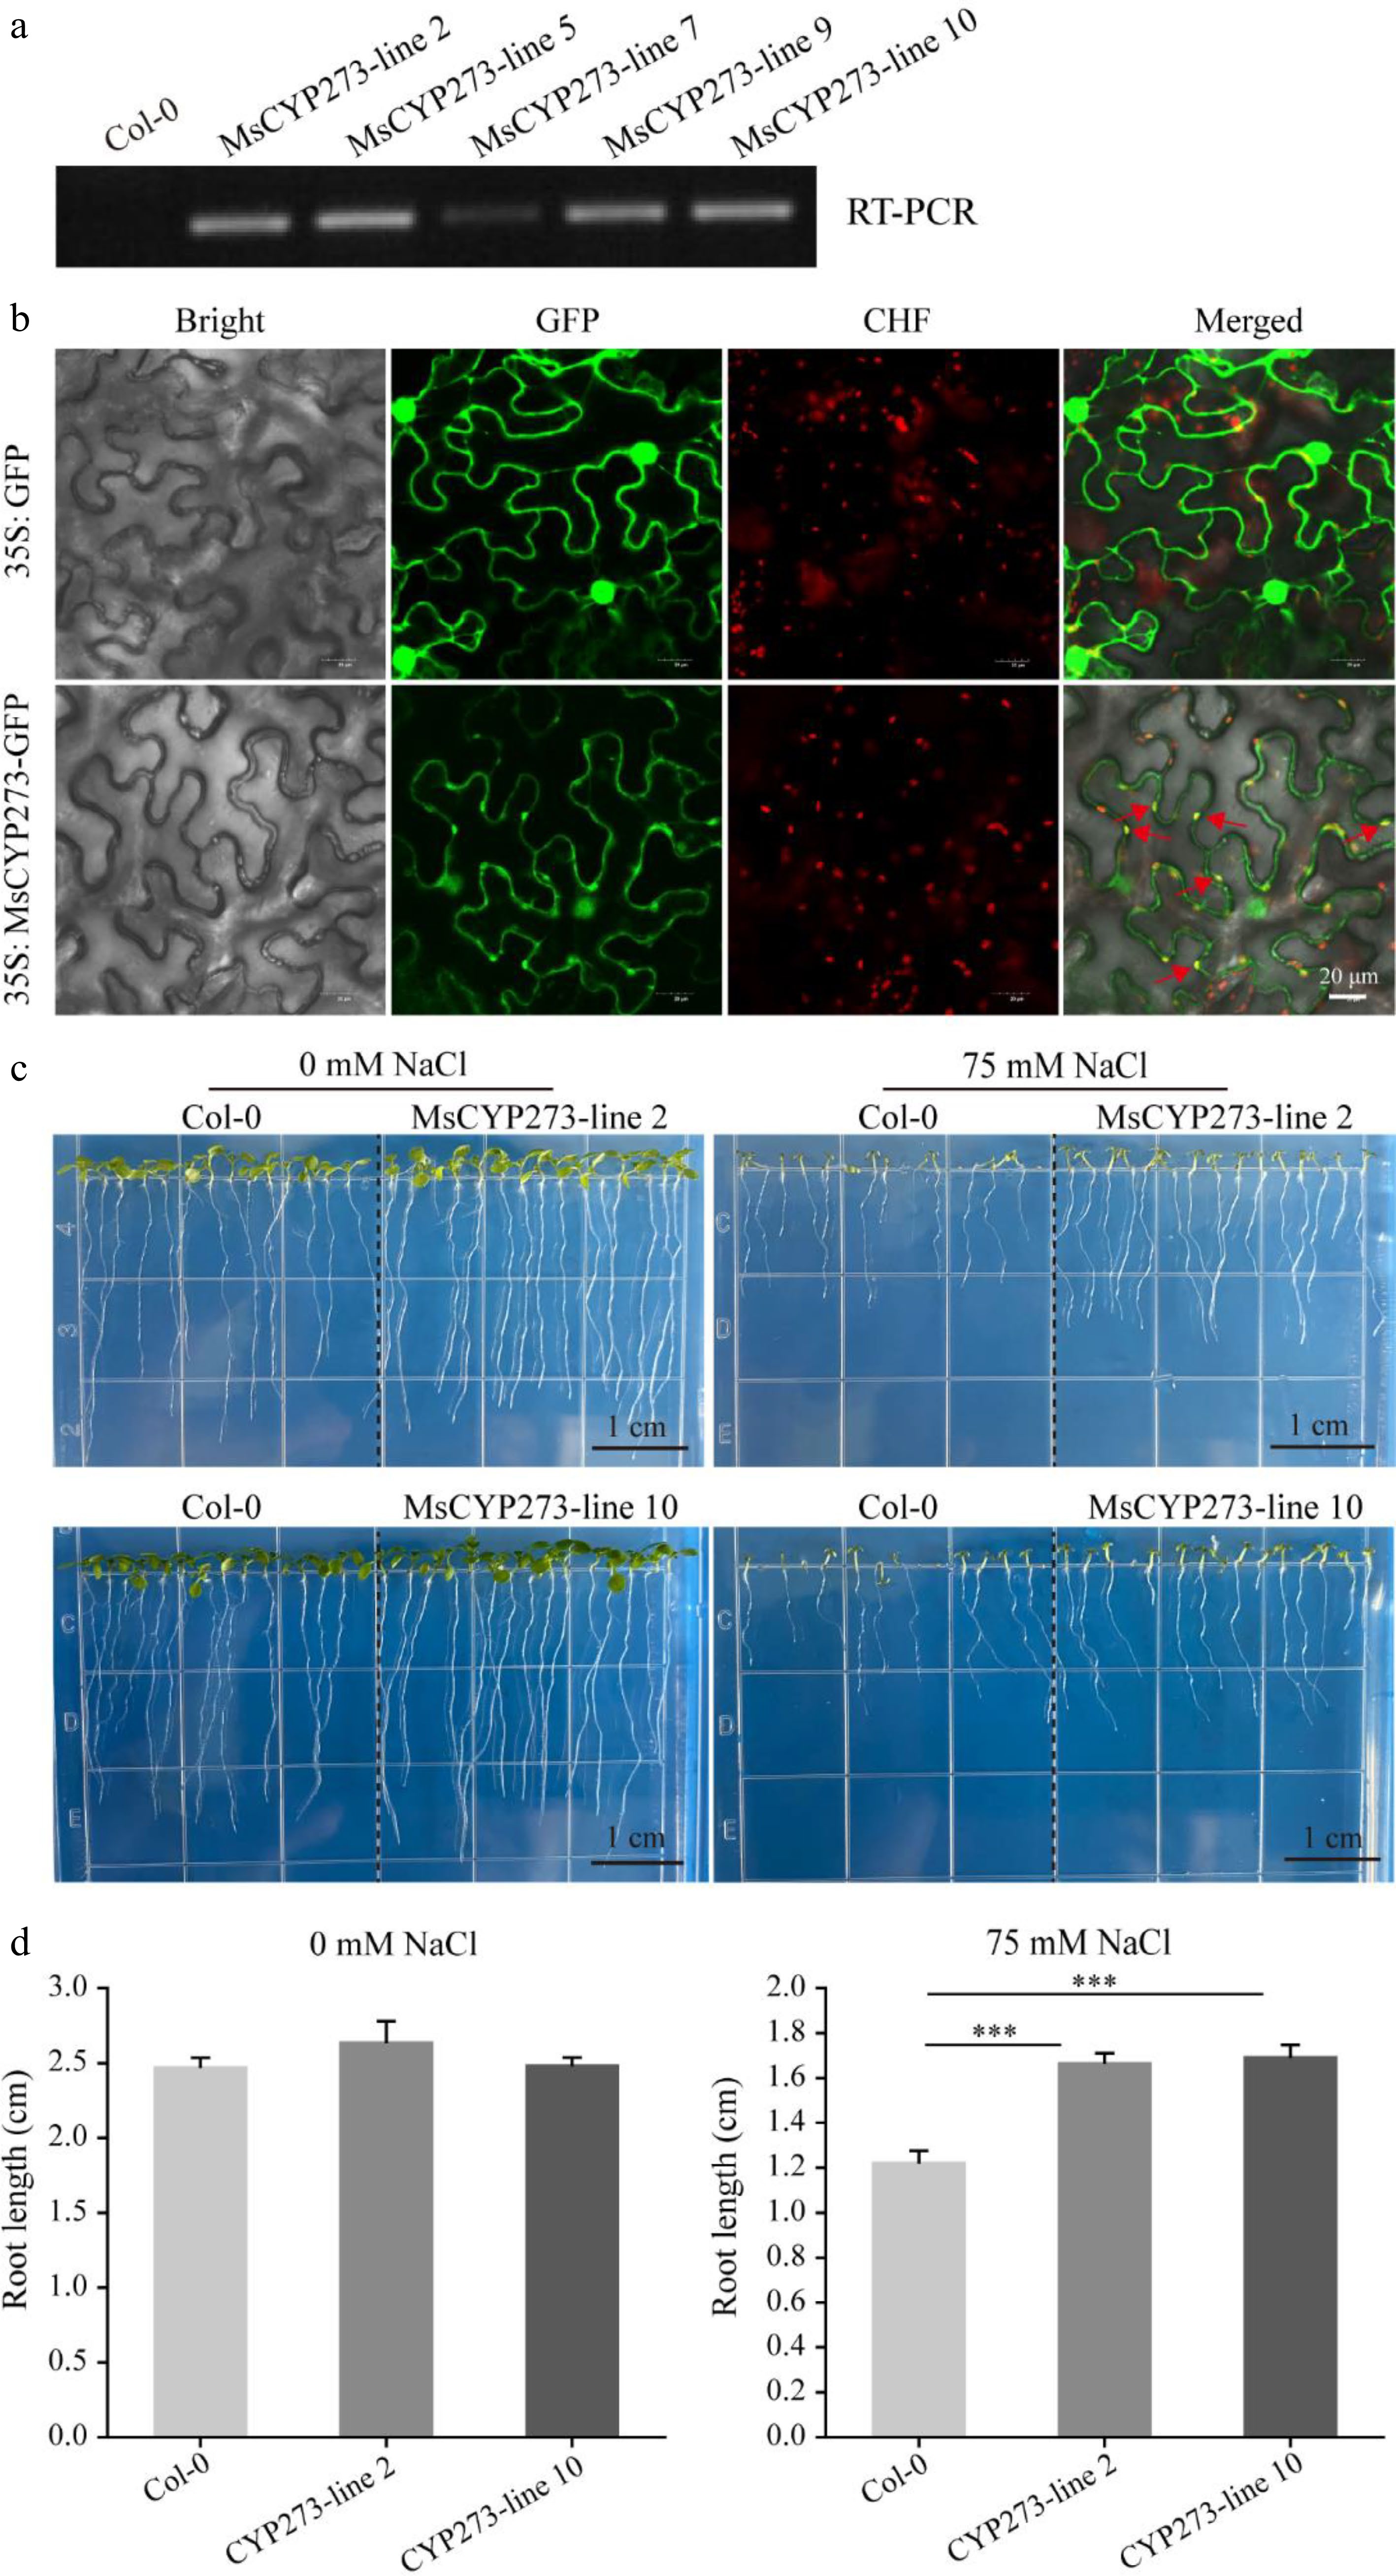
Figure 6.
Analysis of the MsCYP273 protein. (a) RT-PCR results of five MsCYP273 overexpressing lines. (b) Subcellular localization of MsCYP273 protein. Bar = 20 μm. Bright: Bright field; GFP: green fluorescent protein of 495-545 nm; CHF: chloroplast autofluorescence of 590–670 nm. (c) Phenotype of MsCYP273 overexpressing lines (MsCYP273-line2 and MsCYP273-line10) under salt stress. (d) Root length analysis of MsCYP273 overexpressing lines (MsCYP273-line2 and MsCYP273-line10) under salt stress. Bar = 1 cm. ***, p < 0.001.
Figures
(6)
Tables
(0)