-

Figure 1.
Variation of coconut-husk biochar properties with different pyrolysis temperatures.(a) Biochar yield. (b) Variation of biochar-C content. (c) Variation of biochar-O content. (d) Variation of biochar-N content. (e) Variation of biochar-P content. (f) Variation of biochar-K content. (g) Variation of biochar-Na content. (h) Variation of biochar-Ca content. (i) Variation of biochar-Mg content. (j) Variation of biochar-S content. (k) Variation of biochar-Cl content. (l) Variation of biochar-Si content. Means with different letters represent significant differences at p < 0.05 level.
-

Figure 2.
Graphical display of the correlation matrix, using the 'corrplot' package of R-software. Red color indicates the negative correlations between shown variables; blue color indicates the positive correlations; white color indicates no correlation. The areas of the squares show the absolute value of corresponding correlation coefficients. Parameters covered by blue lines show similar correlation variation patterns.
-
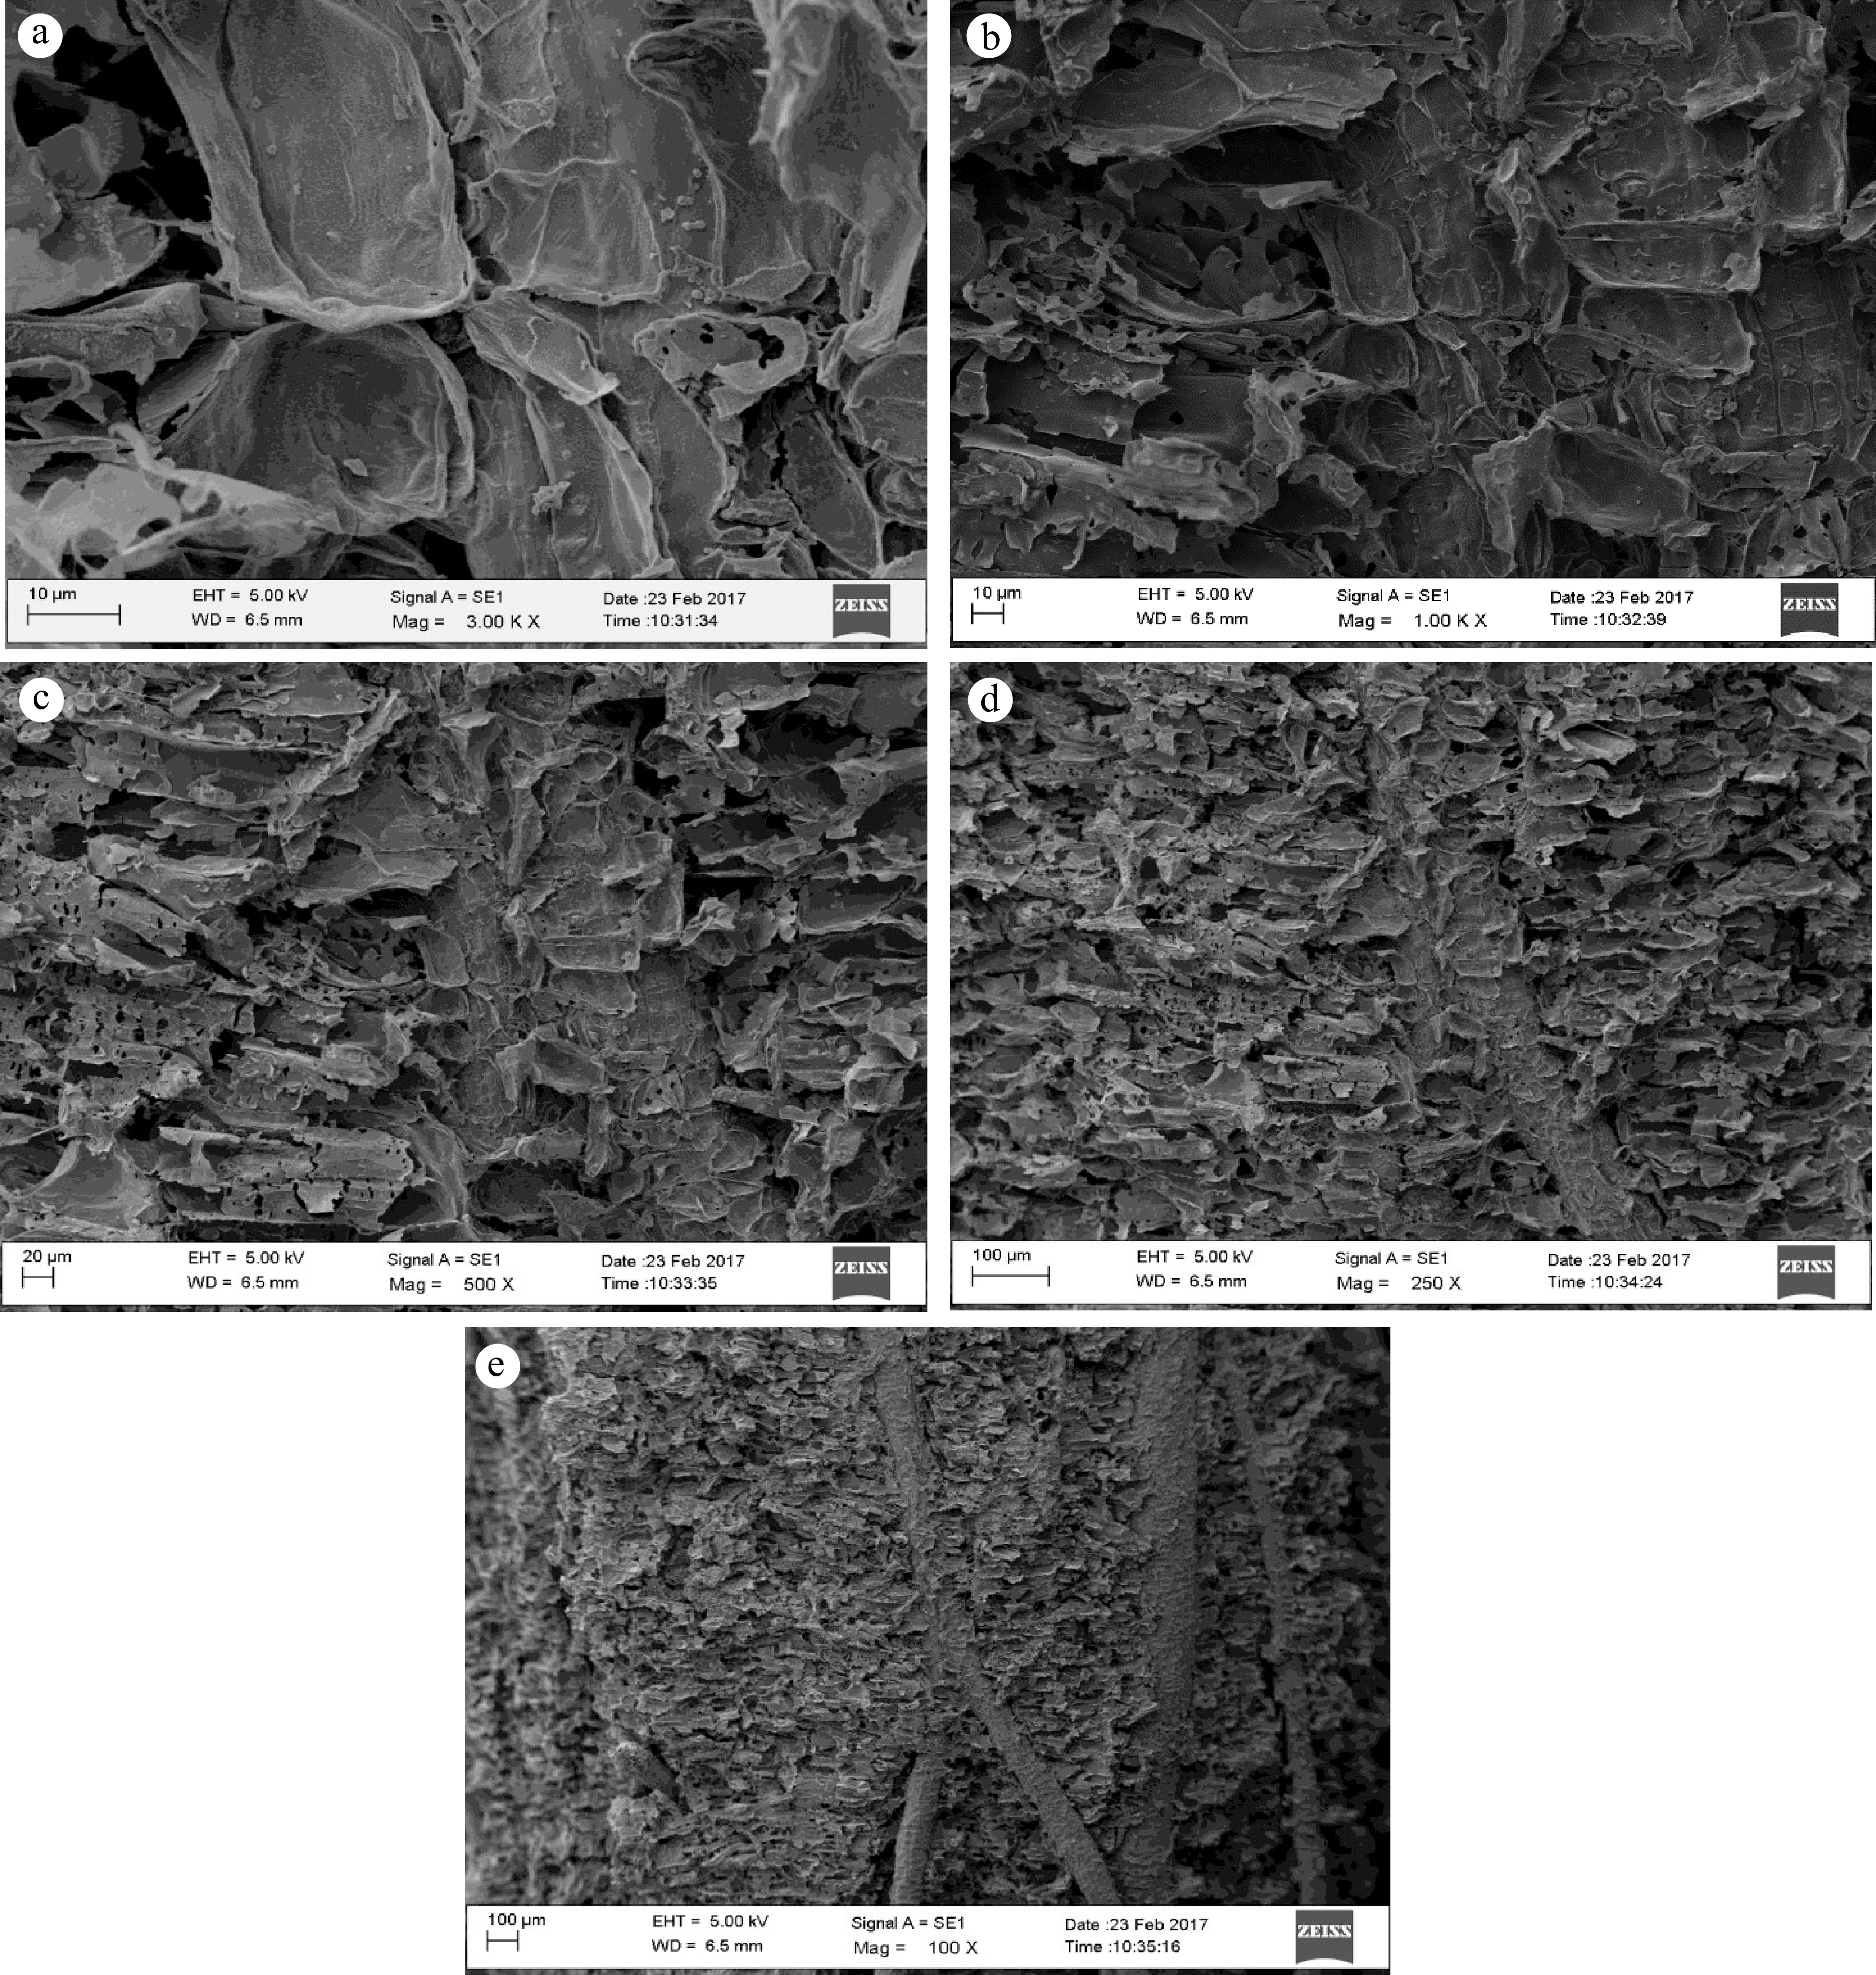
Figure 3.
Scanning Electron Microscopy (SEM) micrographs of coconut-husk biochar produced at 400 °C. (a) Under 3.00 K X of magnification. (b) Under 1.00 K X of magnification. (c) Under 500 X of magnification. (d) Under 250 X of magnification. (e) Under 100 X of magnification.
-
Pyrolysis temperature (°C) O/C ratio of coconut-husk biochar 325 0.49 350 0.46 400 0.32 500 0.22 600 0.08 700 0.10 Table 1.
Variation of O/C ratio at different pyrolysis temperatures.
Figures
(3)
Tables
(1)