-
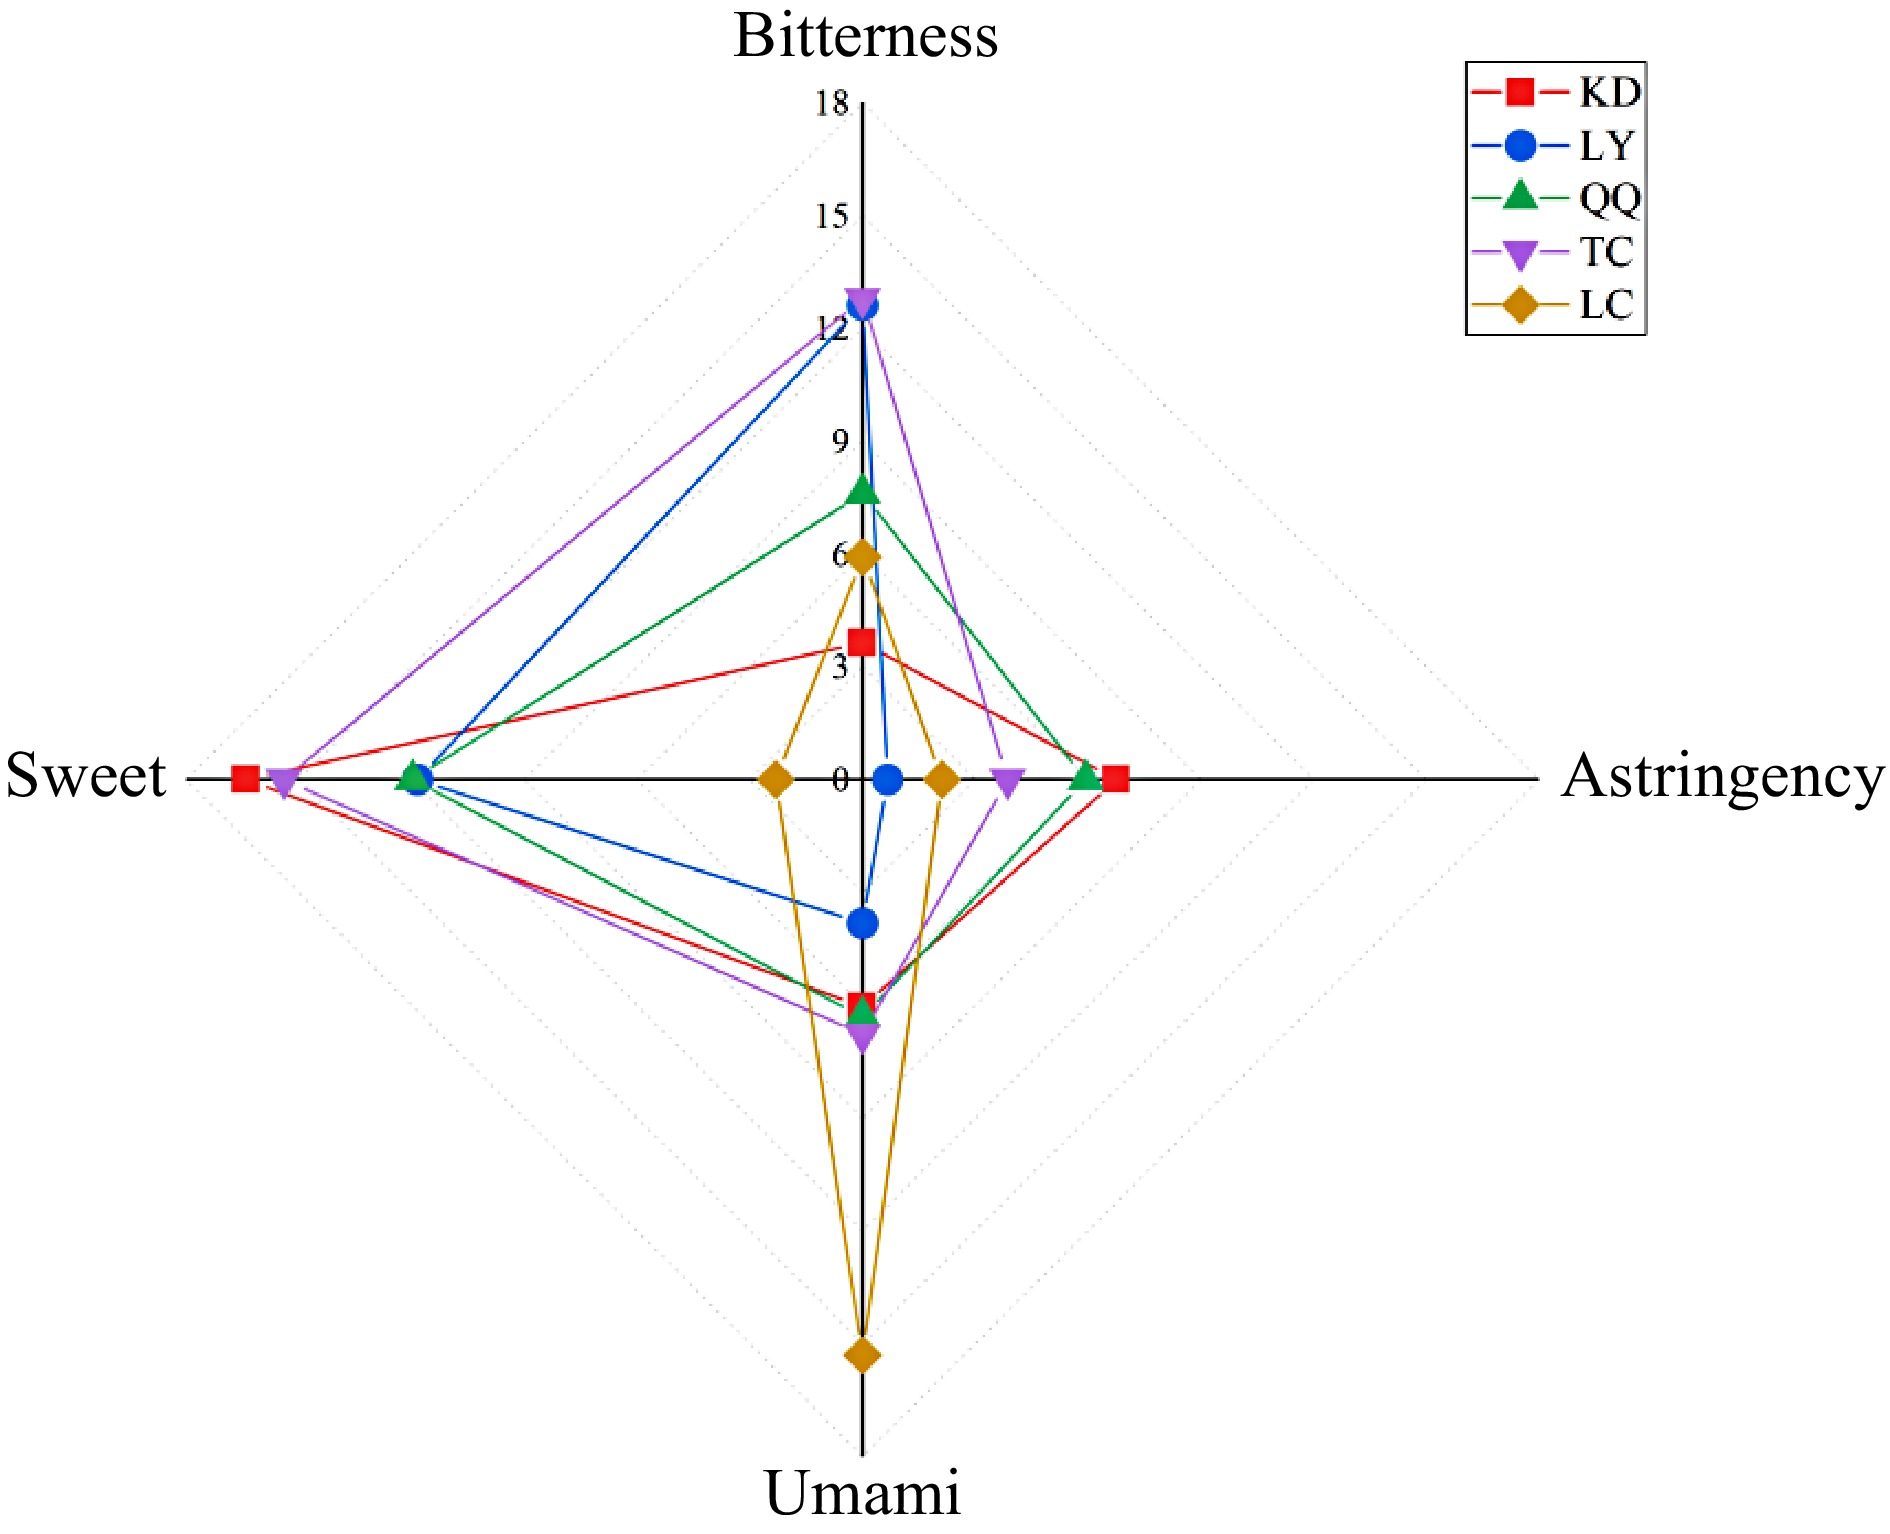
Figure 1.
E-tongue radar map of the four substitute teas.
-
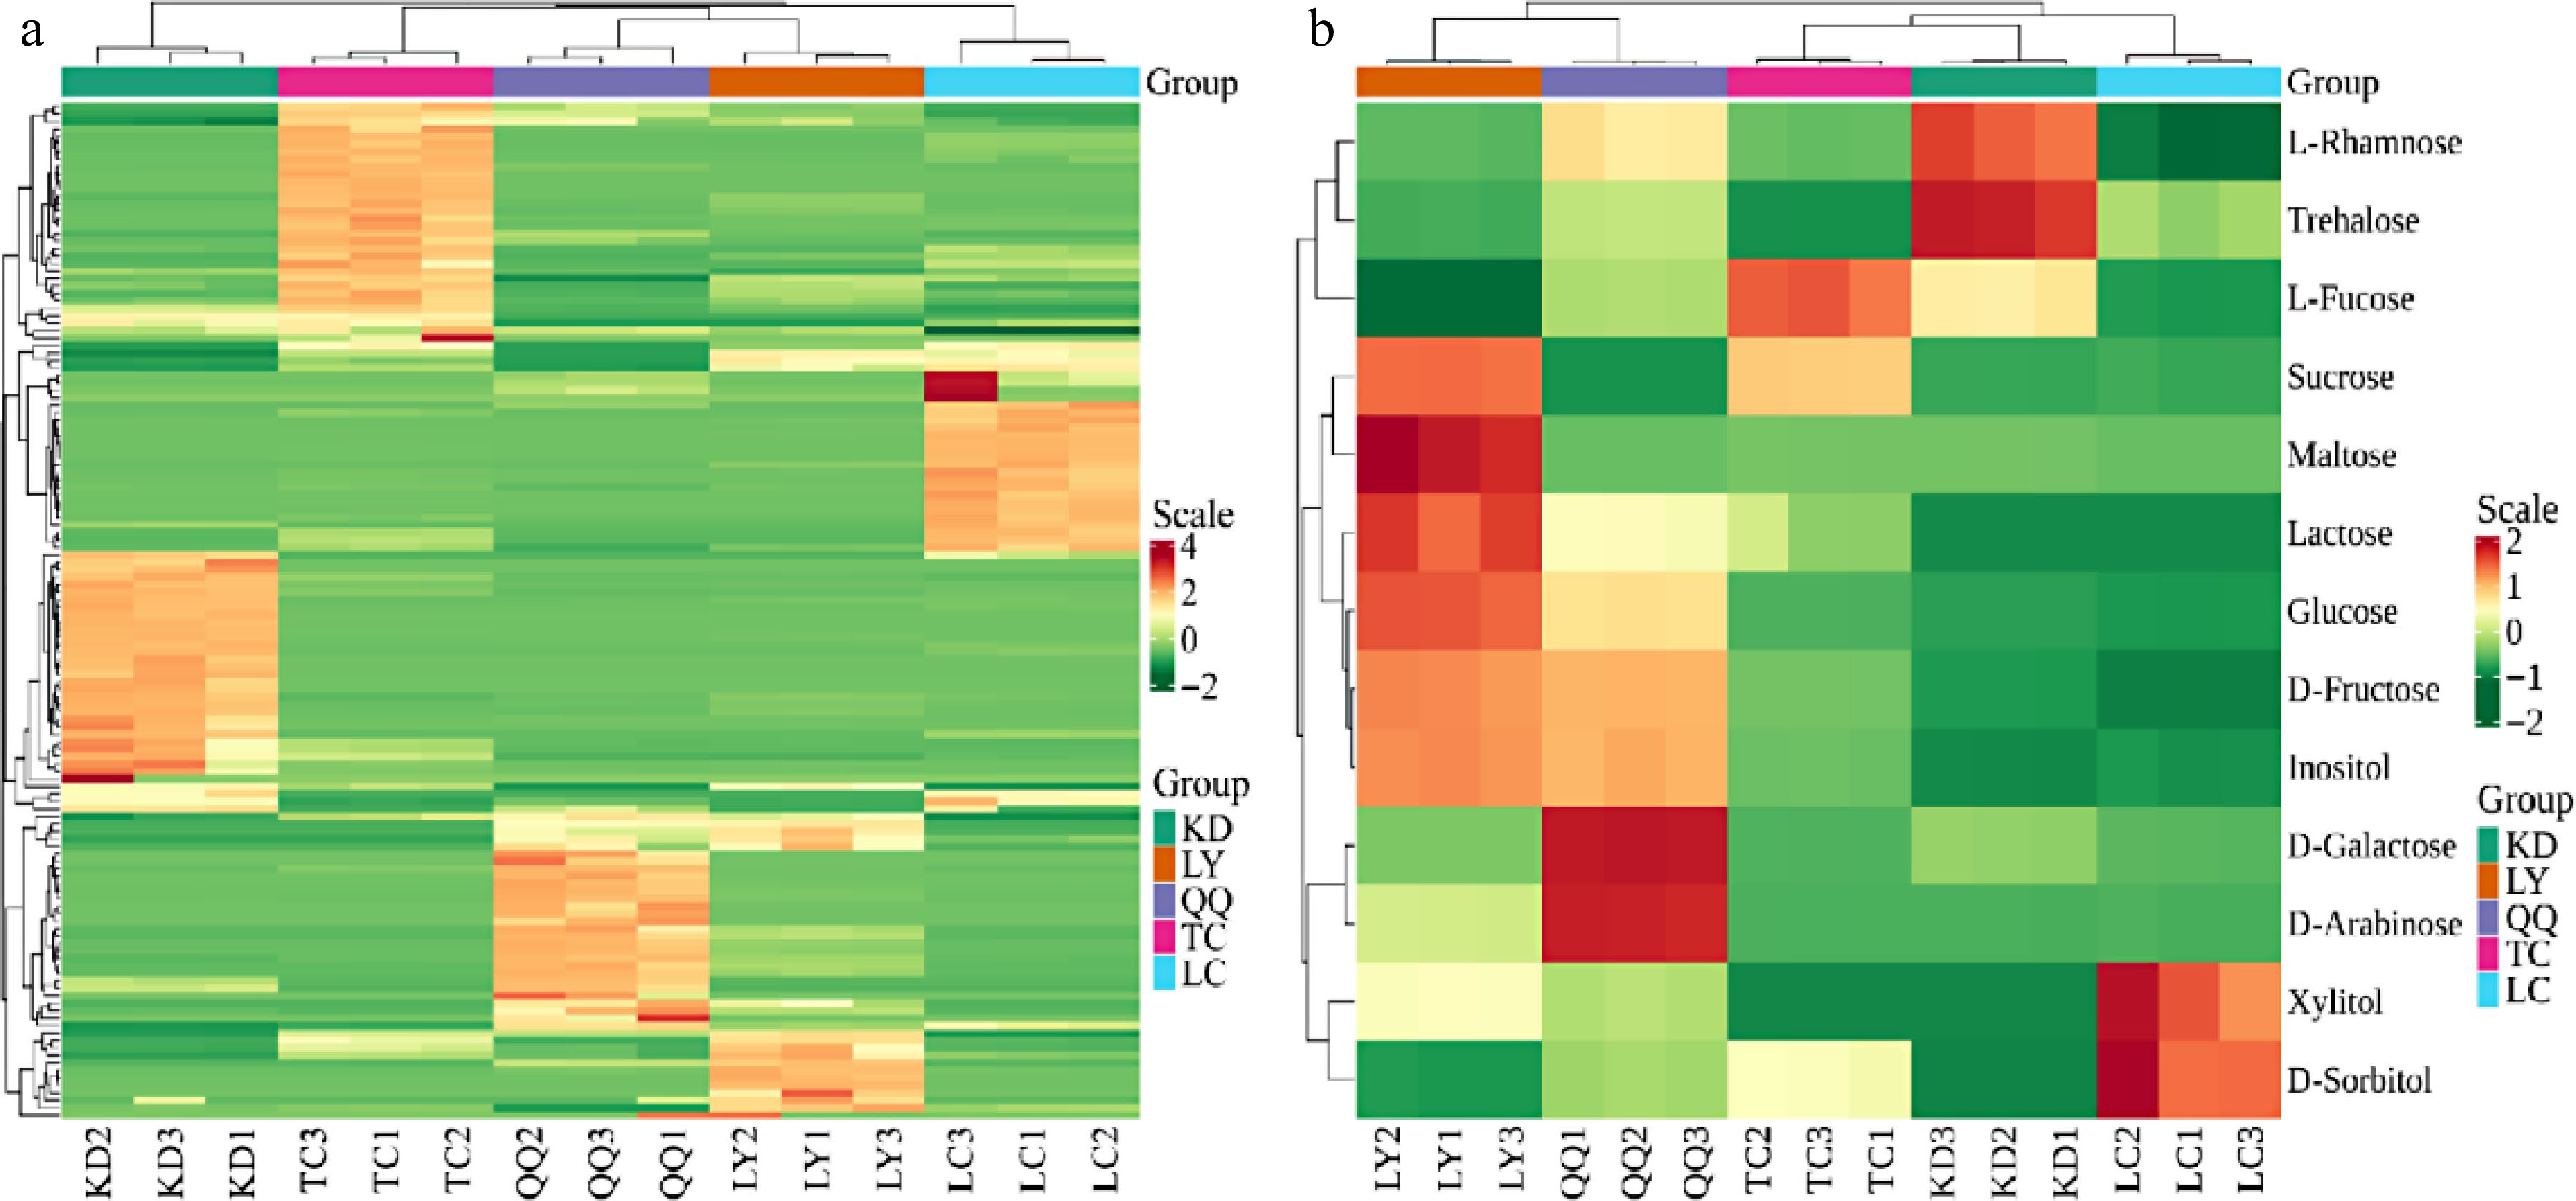
Figure 2.
Heat map of (a) flavonoid metabolite and (b) sugar metabolite contents of the four substitute teas.
-
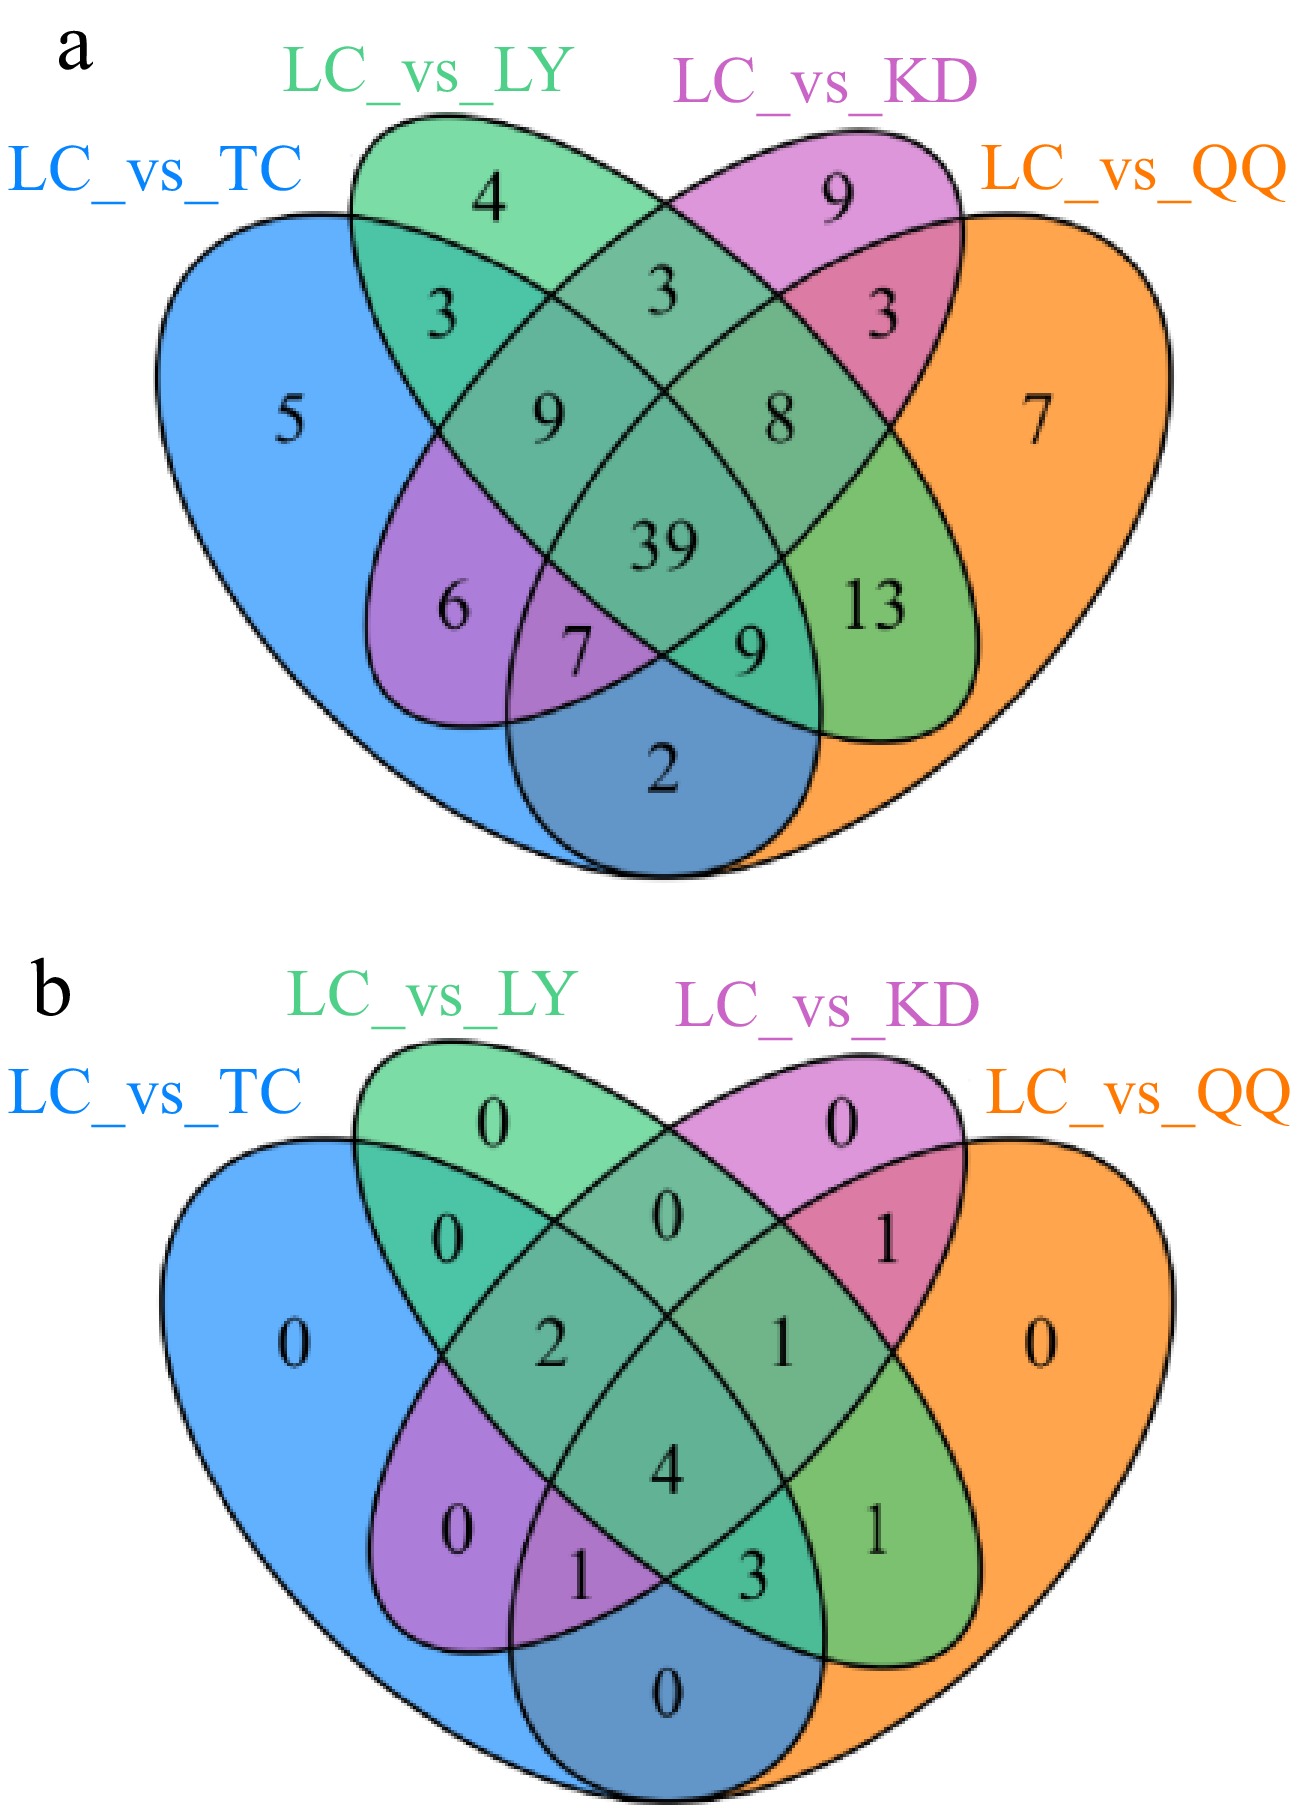
Figure 3.
Venn diagram of the differential metabolites of the (a) four substitute tea flavonoids and (b) sugars.
-
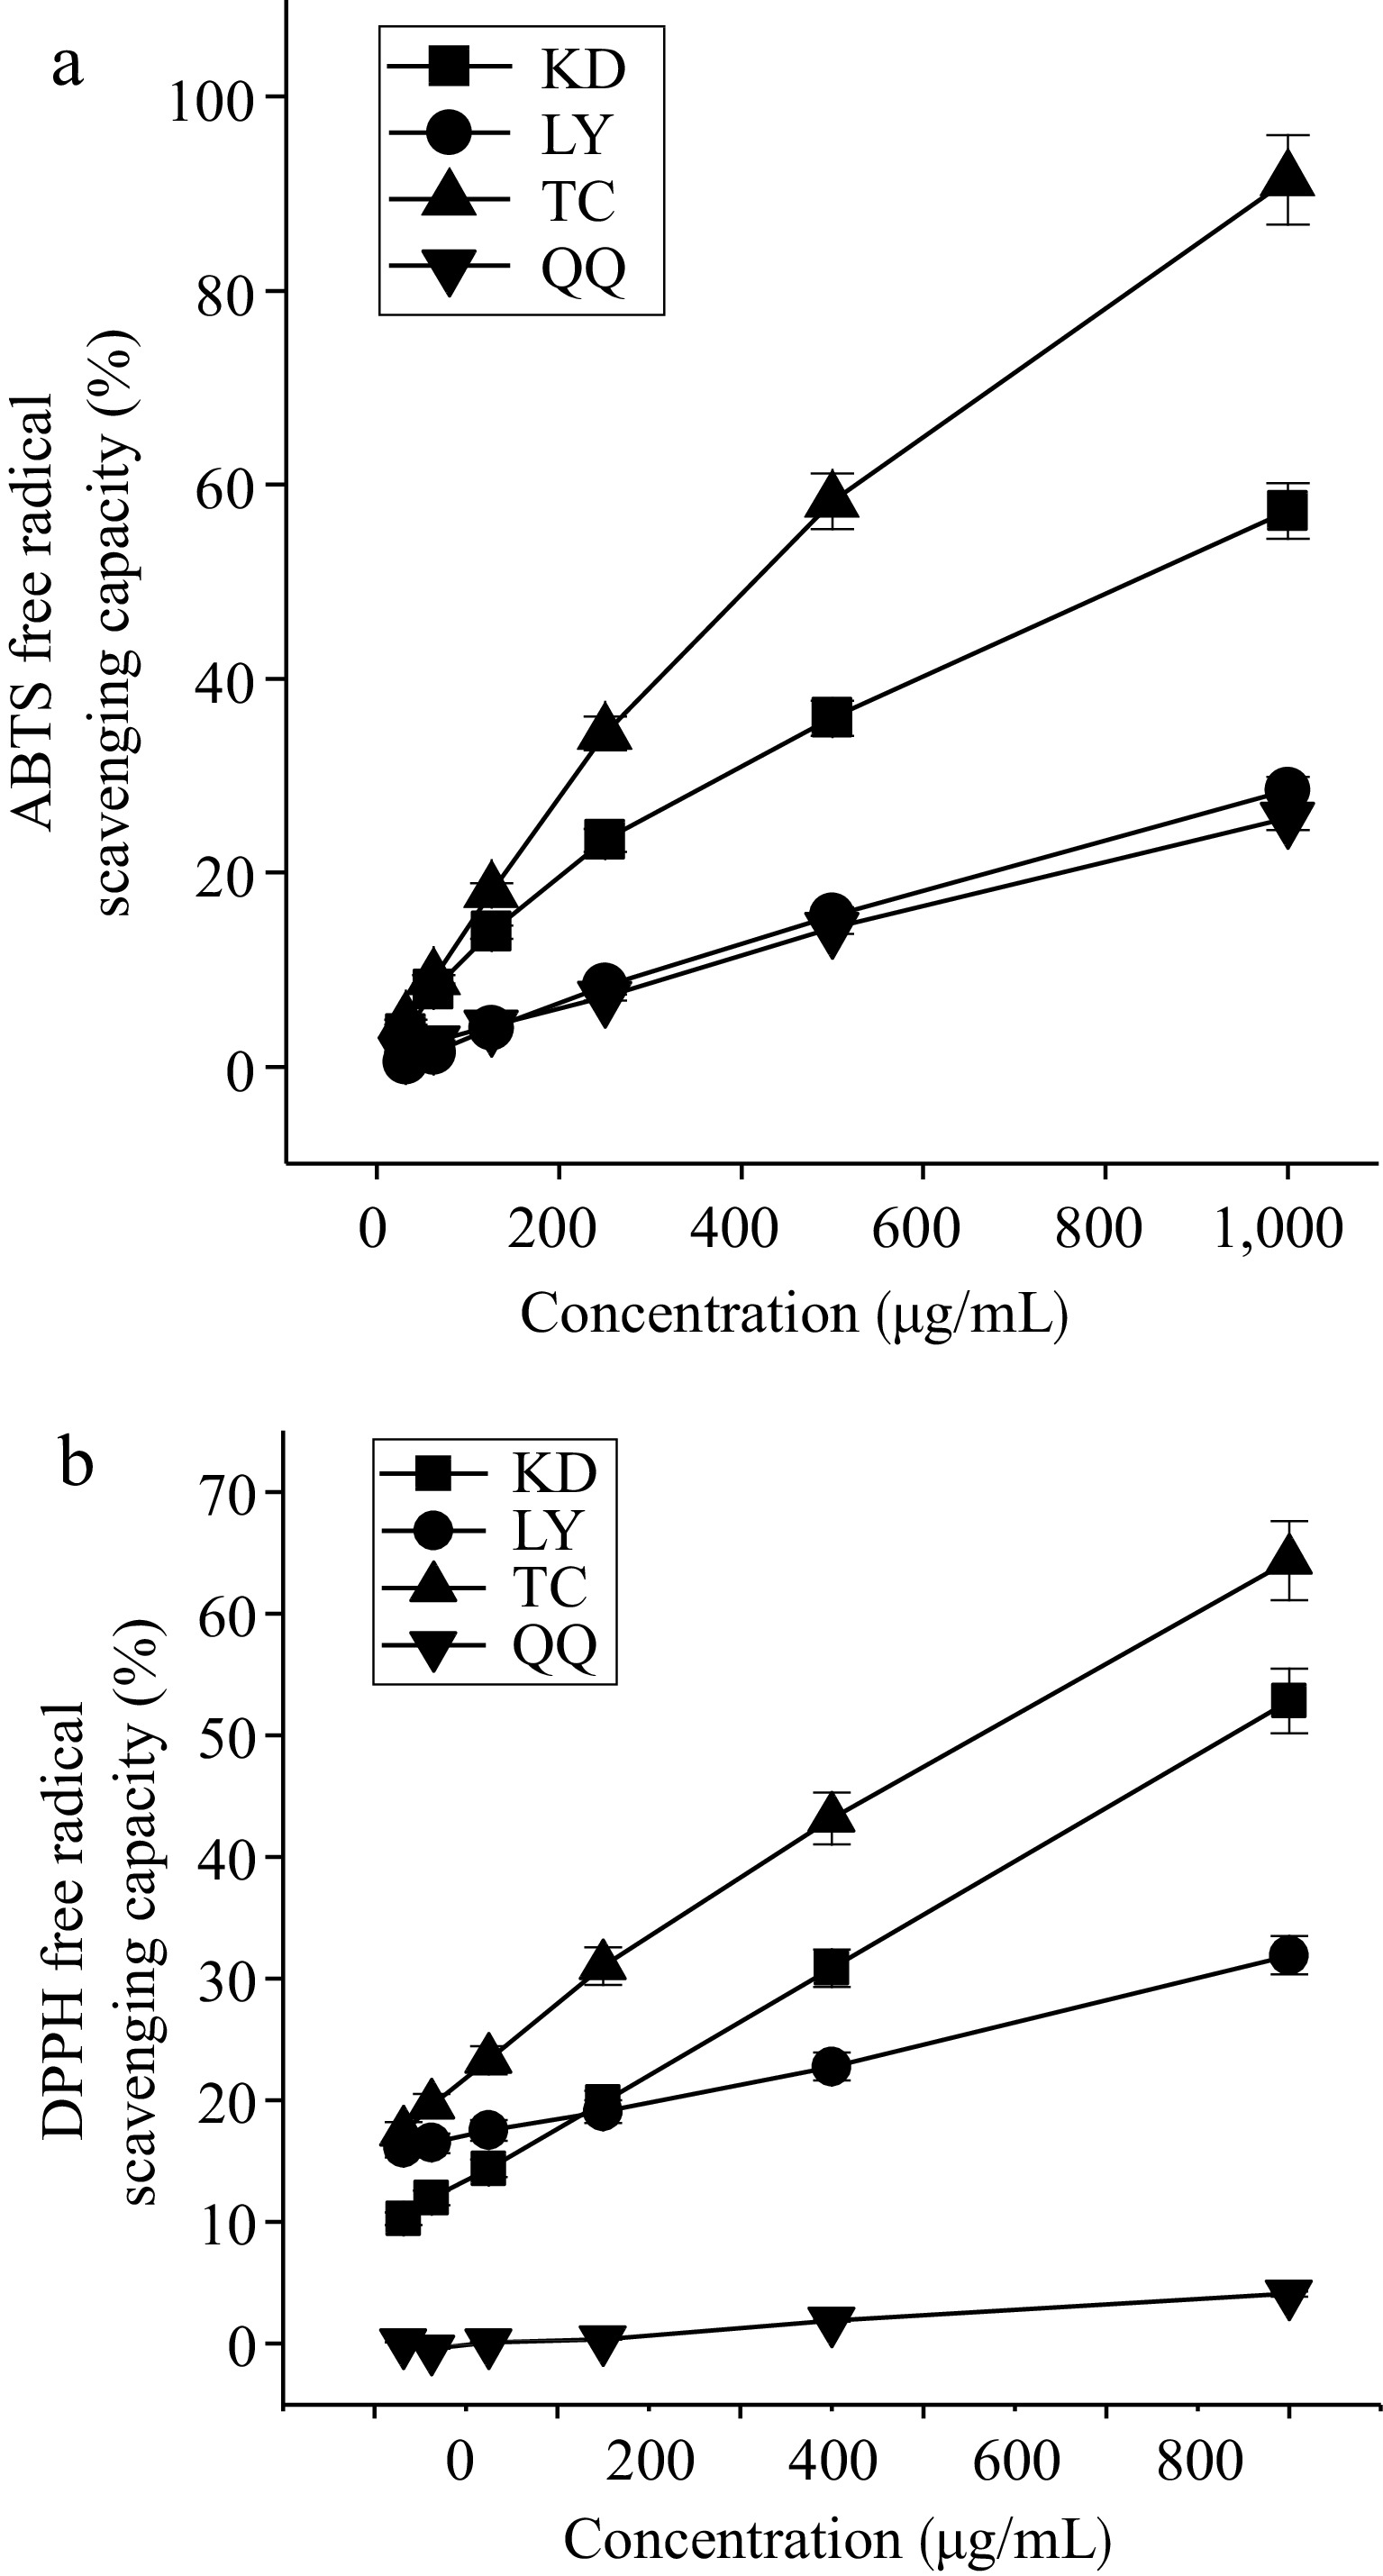
Figure 4.
Scavenging capacity of the four substitute teas for (a) ABTS radicals and (b) DPPH radicals.
-
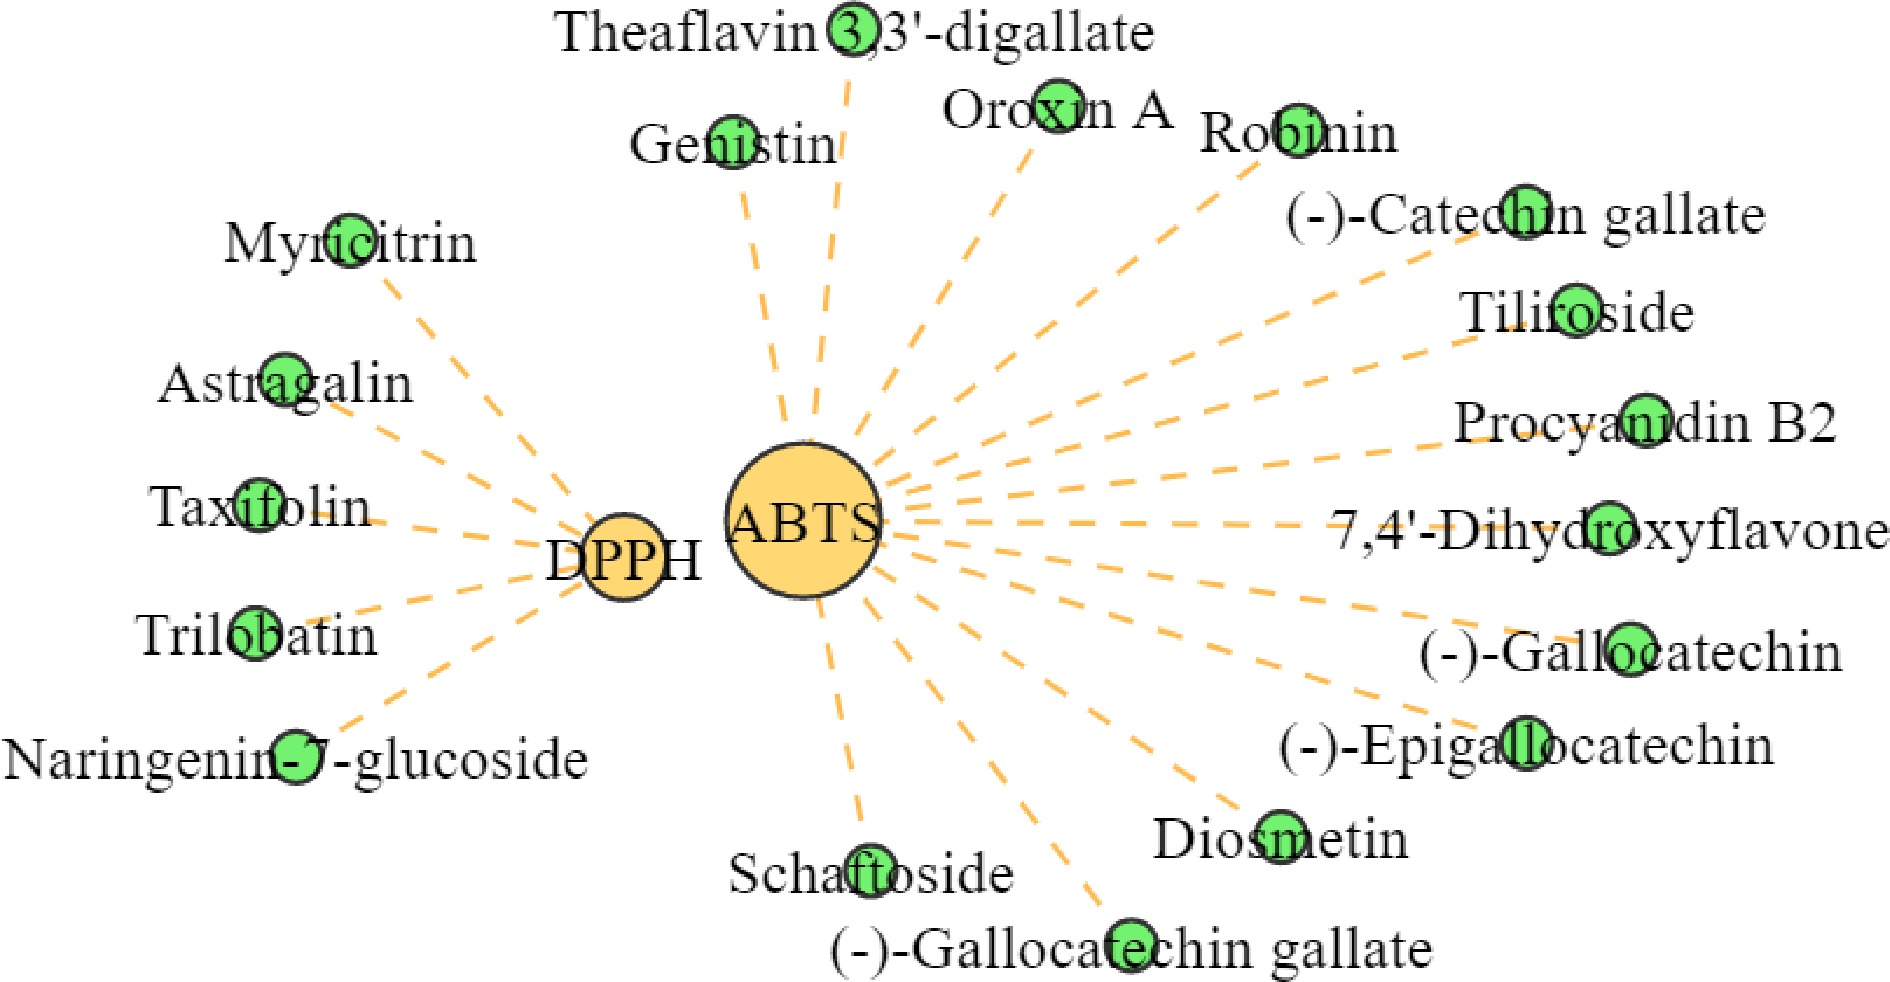
Figure 5.
Network diagram of antioxidant correlation of flavonoids. Note: The green circles in the figure indicates the substance and the orange circles indicates the antioxidant properties.
-
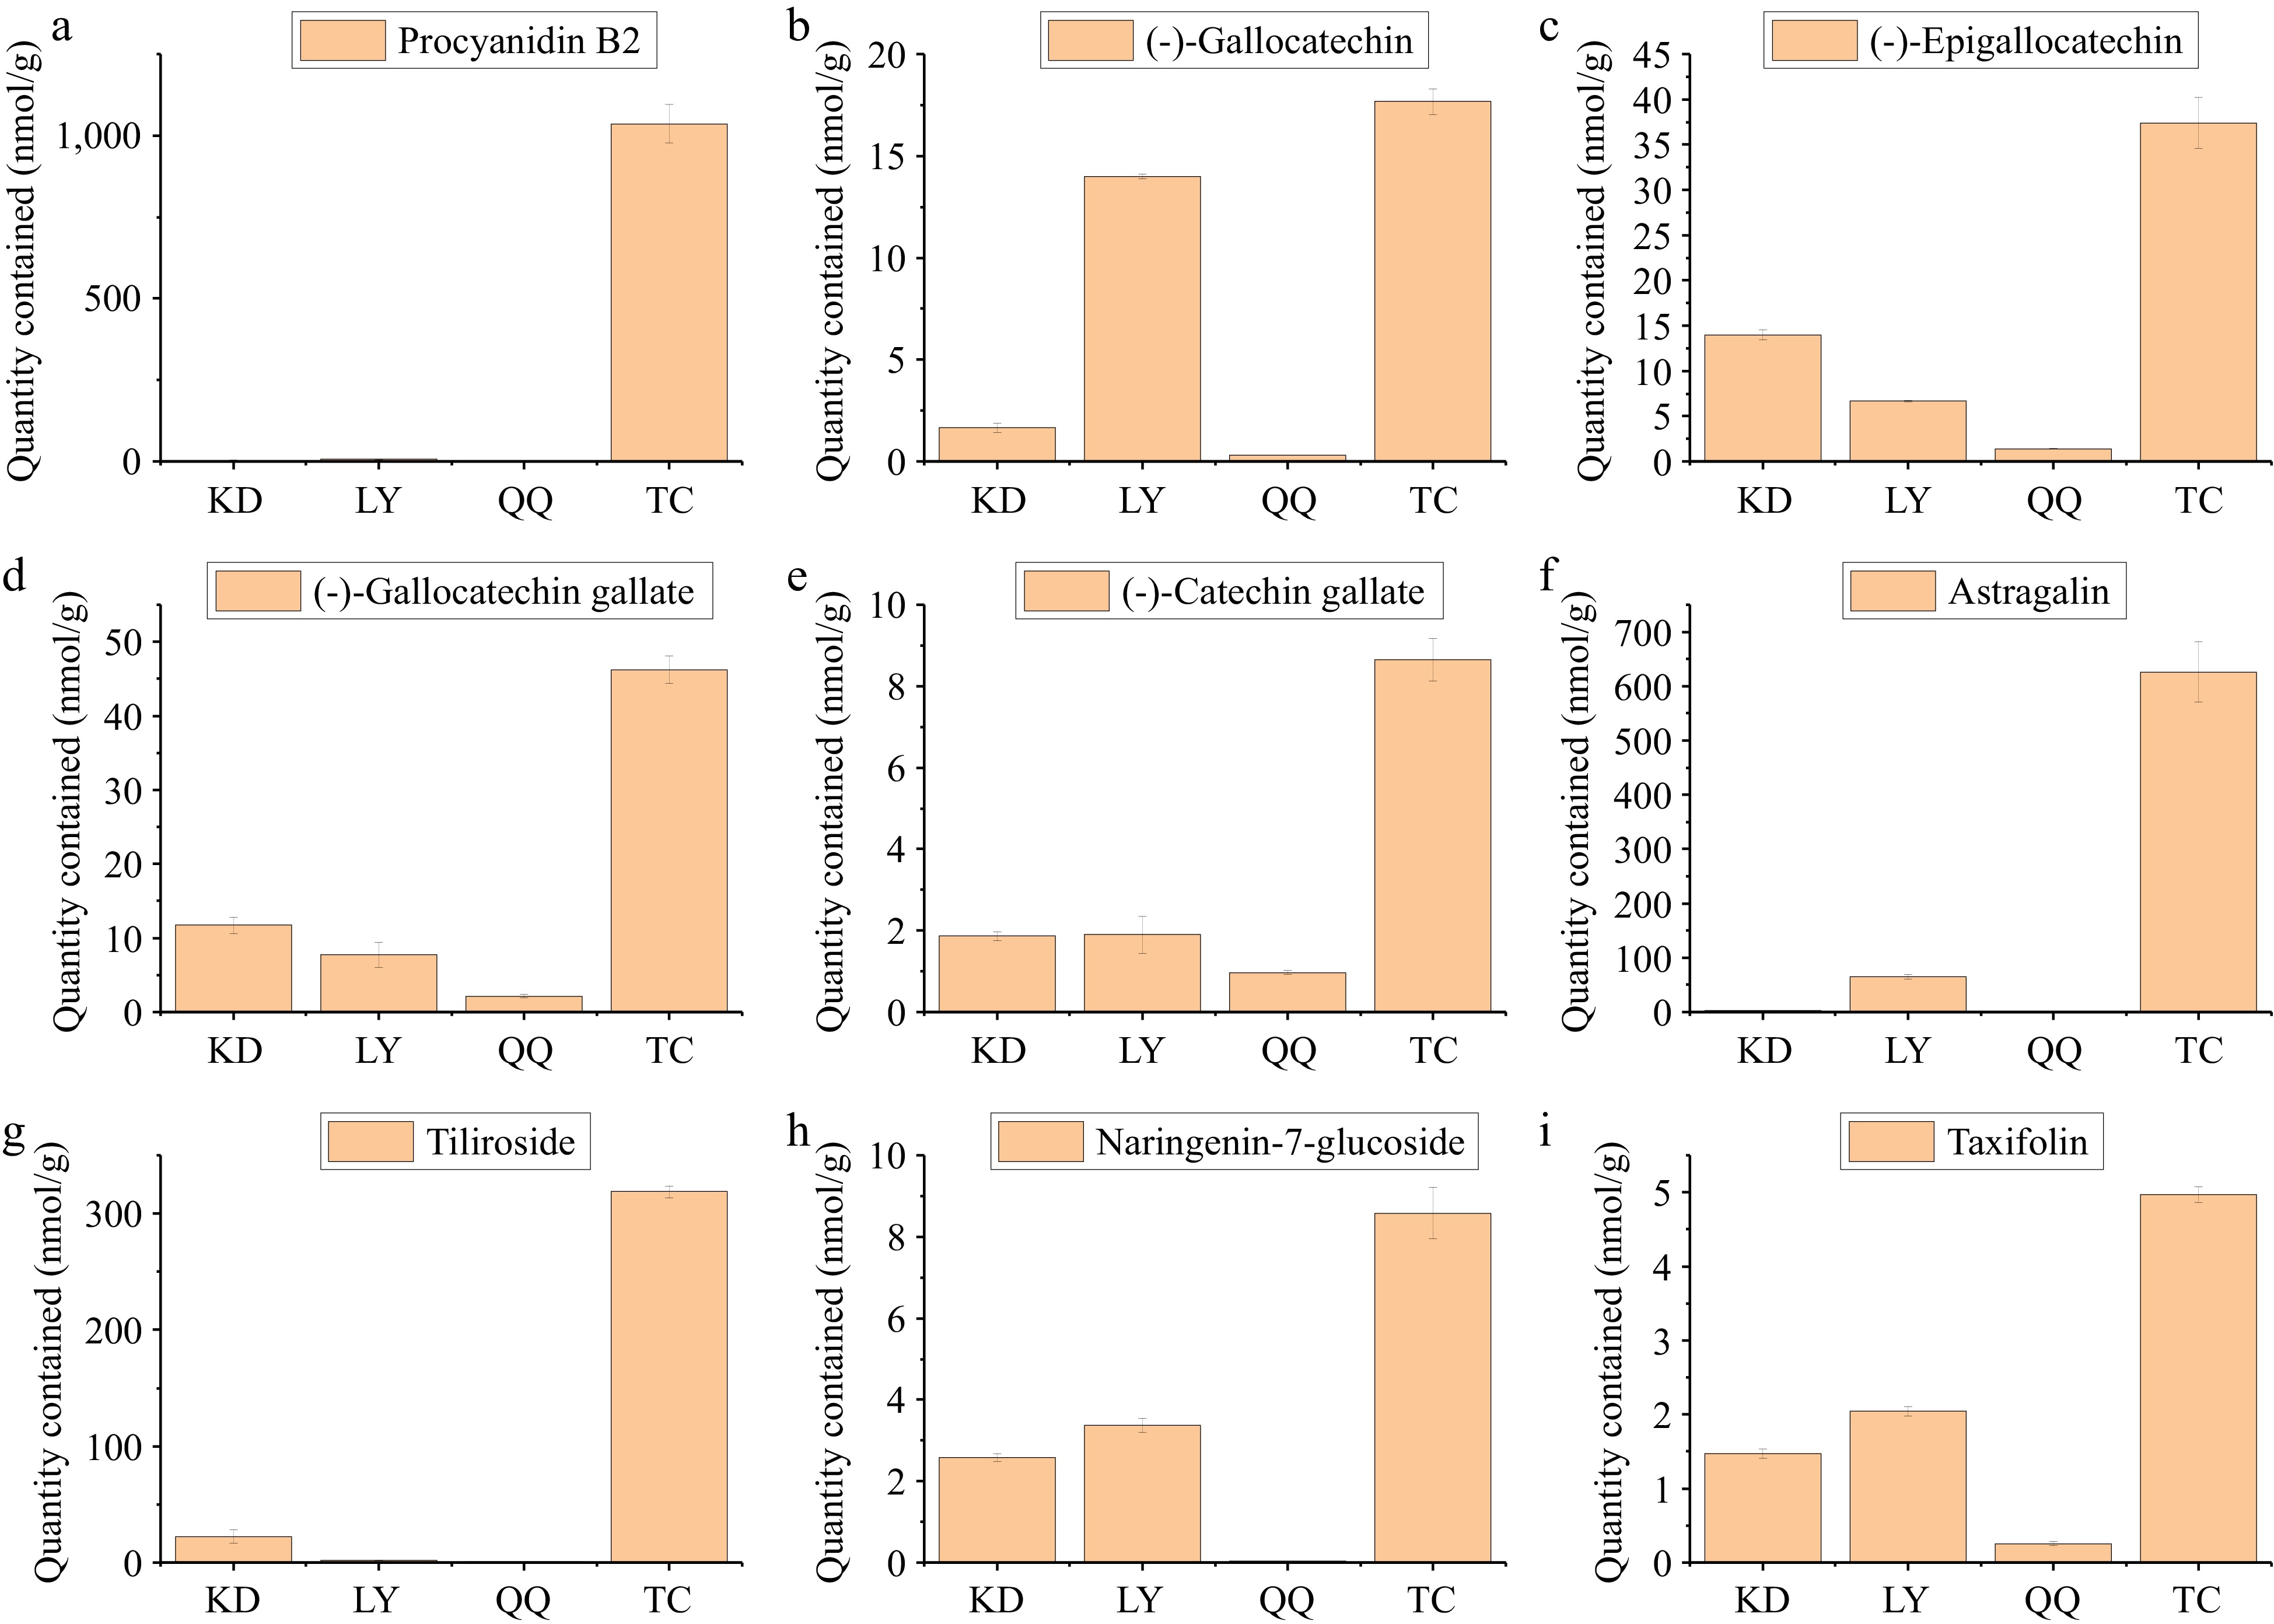
Figure 6.
Flavonoids with high correlation in four kinds of substitute teas. Note: (a)−(i) correspond respectively to Procyanidin B2, (−)-Gallocatechin.
-
Sample Taste KD Bitter, sweeter, with a sweet aftertaste TC Sweet, slightly bitter, calm LY Sweet and mellow, with a camphoraceous flavor LC Fresh and mellow QQ Sweet, astringent and medicinal flavors Table 1.
Results of the sensory review of the taste of the four substitute teas
-
KD LY QQ TC LC Anthocyanins 3.13 ± 0.49c 6.46 ± 0.78c 2.59 ± 0.27c 1036.37 ± 59.53b 3238.45 ± 82.64a Biflavonoids 0.12 ± 0.06a − − − − Chalcones 0.85 ± 0.05b 11.9 ± 0.09b 1.4 ± 0.01b 97.18 ± 12.72a 9.03 ± 0.56b Flavanols 35.79 ± 1.42c 49.83 ± 3.02c 55.34 ± 2.22c 7402.47 ± 136.25b 19411.19 ± 365.66a Flavanones 54.05 ± 2.81b 12.04 ± 0.03d 5.13 ± 0.13e 68.9 ± 2.16a 37.93 ± 3.36c Flavanonols 3.73 ± 0.12c 15.27 ± 0.46b 1.78 ± 0.04c 16.35 ± 0.71b 95.21 ± 4.36a Flavone glycosides 2.48 ± 0.09b 1.18 ± 0.02d 1.82 ± 0.04c 0.9 ± 0.04d 6.03 ± 0.55a Flavones 394.85 ± 13.13a 7.74 ± 0.28d 19.74 ± 0.93c 82.95 ± 3.44b 26.5 ± 1.39c Flavonols 380.02 ± 9.97d 1766.96 ± 79.16b 787.8 ± 36.16c 2763.33 ±1 33.39a 423.6 ± 34.27d Isoflavanones 0.65 ± 0.09c 0.14 ± 0.01e 0.3 ± 0.05d 1.04 ± 0.09b 1.37 ± 0.08a Phenolic acids 8.66 ± 0.22a 2.06 ± 0.16c 3.2 ± 0.16b 3.32 ± 1.14b − Xanthones − 0.22 ± 0.02b − 0.07 ± 0.01c 0.59 ± 0.02a Others 9.49 ± 1.07b 11.57 ± 5.05b 8.06 ± 3.14b 40.05 ± 9.08b 1707.99 ± 202.53a Total 893.82 ± 0.12c 1885.37 ± 0.28a 887.16 ± 0.35d 11512.93 ± 0.14c 24957 ± 0.28a.89 N indicates biological sample size; data are mean ± standard deviation; peer data followed by different letters indicate significant differences (p < 0.05), and those with the same letter indicate non-significant differences (p > 0.05). Table 2.
Statistical results of the flavonoid content of the four substitute teas. Unit: nmol/g.
-
Class Compounds RT KD LY QQ TC LC Disaccharide Sucrose 13.053 2.55 ± 0.06c 39.24 ± 0.36a 0.03 ± 0d 30.19 ± 0.27b 2.77 ± 0.44c Trehalose 14.342 0.1 ± 0a 0.01 ± 0d 0.03 ± 0b − 0.03 ± 0c Maltose 14.264 0.01 ± 0b 0.39 ± 0.02a − 0.01 ± 0b − Lactose 13.662 − 0.02 ± 0a 0.01 ± 0b 0.01 ± 0c − Total disaccharide 2.66 ± 0.07c 39.66 ± 0.38a 0.08 ± 0d 30.21 ± 0.27b 2.8 ± 0.45c Monosaccharide D-Arabinose 3.965 0.01 ± 0c 0.09 ± 0b 0.29 ± 0a 0.01 ± 0c 0.01 ± 0c D-Fructose 5.758 1.15 ± 0.02d 13.18 ± 0.32a 11.98 ± 0.05b 3.33 ± 0.04c 0.1 ± 0.01e D-Galactose 5.937 0.13 ± 0.01b 0.1 ± 0c 0.97 ± 0.01a 0.01 ± 0e 0.03 ± 0.01d Glucose 5.991 1.19 ± 0.02d 31.34 ± 0.74a 21.31 ± 0.15b 3.23 ± 0.05c 0.34 ± 0.04e L-Rhamnose 4.424 0.05 ± 0a 0.03 ± 0c 0.04 ± 0b 0.03 ± 0c 0.02 ± 0d D-Sorbitol 6.361 − − − 0.01 ± 0b 0.01 ± 0a L-Fucose 4.634 0.07 ± 0b − 0.04 ± 0c 0.11 ± 0a 0.01 ± 0d Xylitol 4.318 − − − − 0.01 ± 0a Total monosaccharide 2.61 ± 0.06d 44.74 ± 1.12a 34.63 ± 0.29b 6.73 ± 0.12c 0.54 ± 0.13e Other Inositol 7.772 0.5 ± 0.01e 4.82 ± 0.06a 4.46 ± 0.09b 1.38 ± 0.02c 0.62 ± 0.07d Total sugar 5.27 ± 0.14a 114.4 ± 0.09b 34.71 ± 0.12c 36.94 ± 0.52a 3.34 ± 2.12c Data are mean ± standard deviation. Peer data followed by different letters indicate significant differences (p < 0.05), and those with the same letter indicate non-significant differences (p > 0.05). Total sugar content does not include inositol. Table 3.
Statistical results of the sugar content of the four substitute teas. Unit: mg/g.
-
Sample Flavonoids Sugars R2X R2Y Q2 R2X R2Y Q2 LC vs. KD 0.949 1 1 0.926 1 0.999 LC vs. LY 0.942 1 0.998 0.934 1 1 LC vs. QQ 0.946 1 1 0.906 1 0.997 LC vs. TC 0.973 1 1 0.937 1 1 Table 4.
Parameters for PLS analysis of the four substitute teas flavonoids and sugars.
-
LC vs KD LC vs LY LC vs QQ LC vs TC Up Down Up Down Up Down Up Down Anthocyanins 1 1 1 1 Biflavonoids 1 1 - 1 Chalcones 2 5 3 3 3 6 7 2 Flavanols 6 6 6 3 4 Flavanones 4 3 3 2 5 4 2 4 Flavanonols 2 3 2 4 1 5 1 3 Flavone glycosides 1 2 3 3 4 Flavones 15 5 15 9 14 8 12 5 Flavonols 7 10 18 5 8 9 15 6 Isoflavanones 6 2 3 3 3 3 2 2 Phenonic acids 3 3 4 1 Xanthones 2 1 2 2 Total flavonoids 41 39 48 37 38 47 44 33 Disaccharide 2 3 1 1 1 3 1 Monosaccharide 5 2 4 2 6 2 3 2 Inositol 1 1 1 Total sugar 7 2 9 3 8 3 7 3 Table 5.
Statistical results of the different flavonoid and sugar metabolites of the four substitute teas.
-
Pearson correlation Total flavone Total sugar Total DPPG clearance Total ABTS clearance Total flavone 1 −0.461 0.103 0.626* Total sugar 1 −0.286 −0.645** Total DPPG clearance 1 0.793** Total ABTS clearance 1 * Correlation is significant at the 0.05 level (2-tailed).** Correlation is significant at the 0.01 level (2-tailed). Table 6.
Correlation analysis between taste substances and antioxidant properties.
Figures
(6)
Tables
(6)