-

Figure 1.
Phylogenetic relationship of SWI3 family. Branches in purple, red, blue and yellow represent the subfamily SWI3A to SWI3D respectively. Different colored marks next to the labels depict different species: red pentagram, sweet orange; purple circle, Aridopsis; blue square, rice and green triangle, tomato.
-
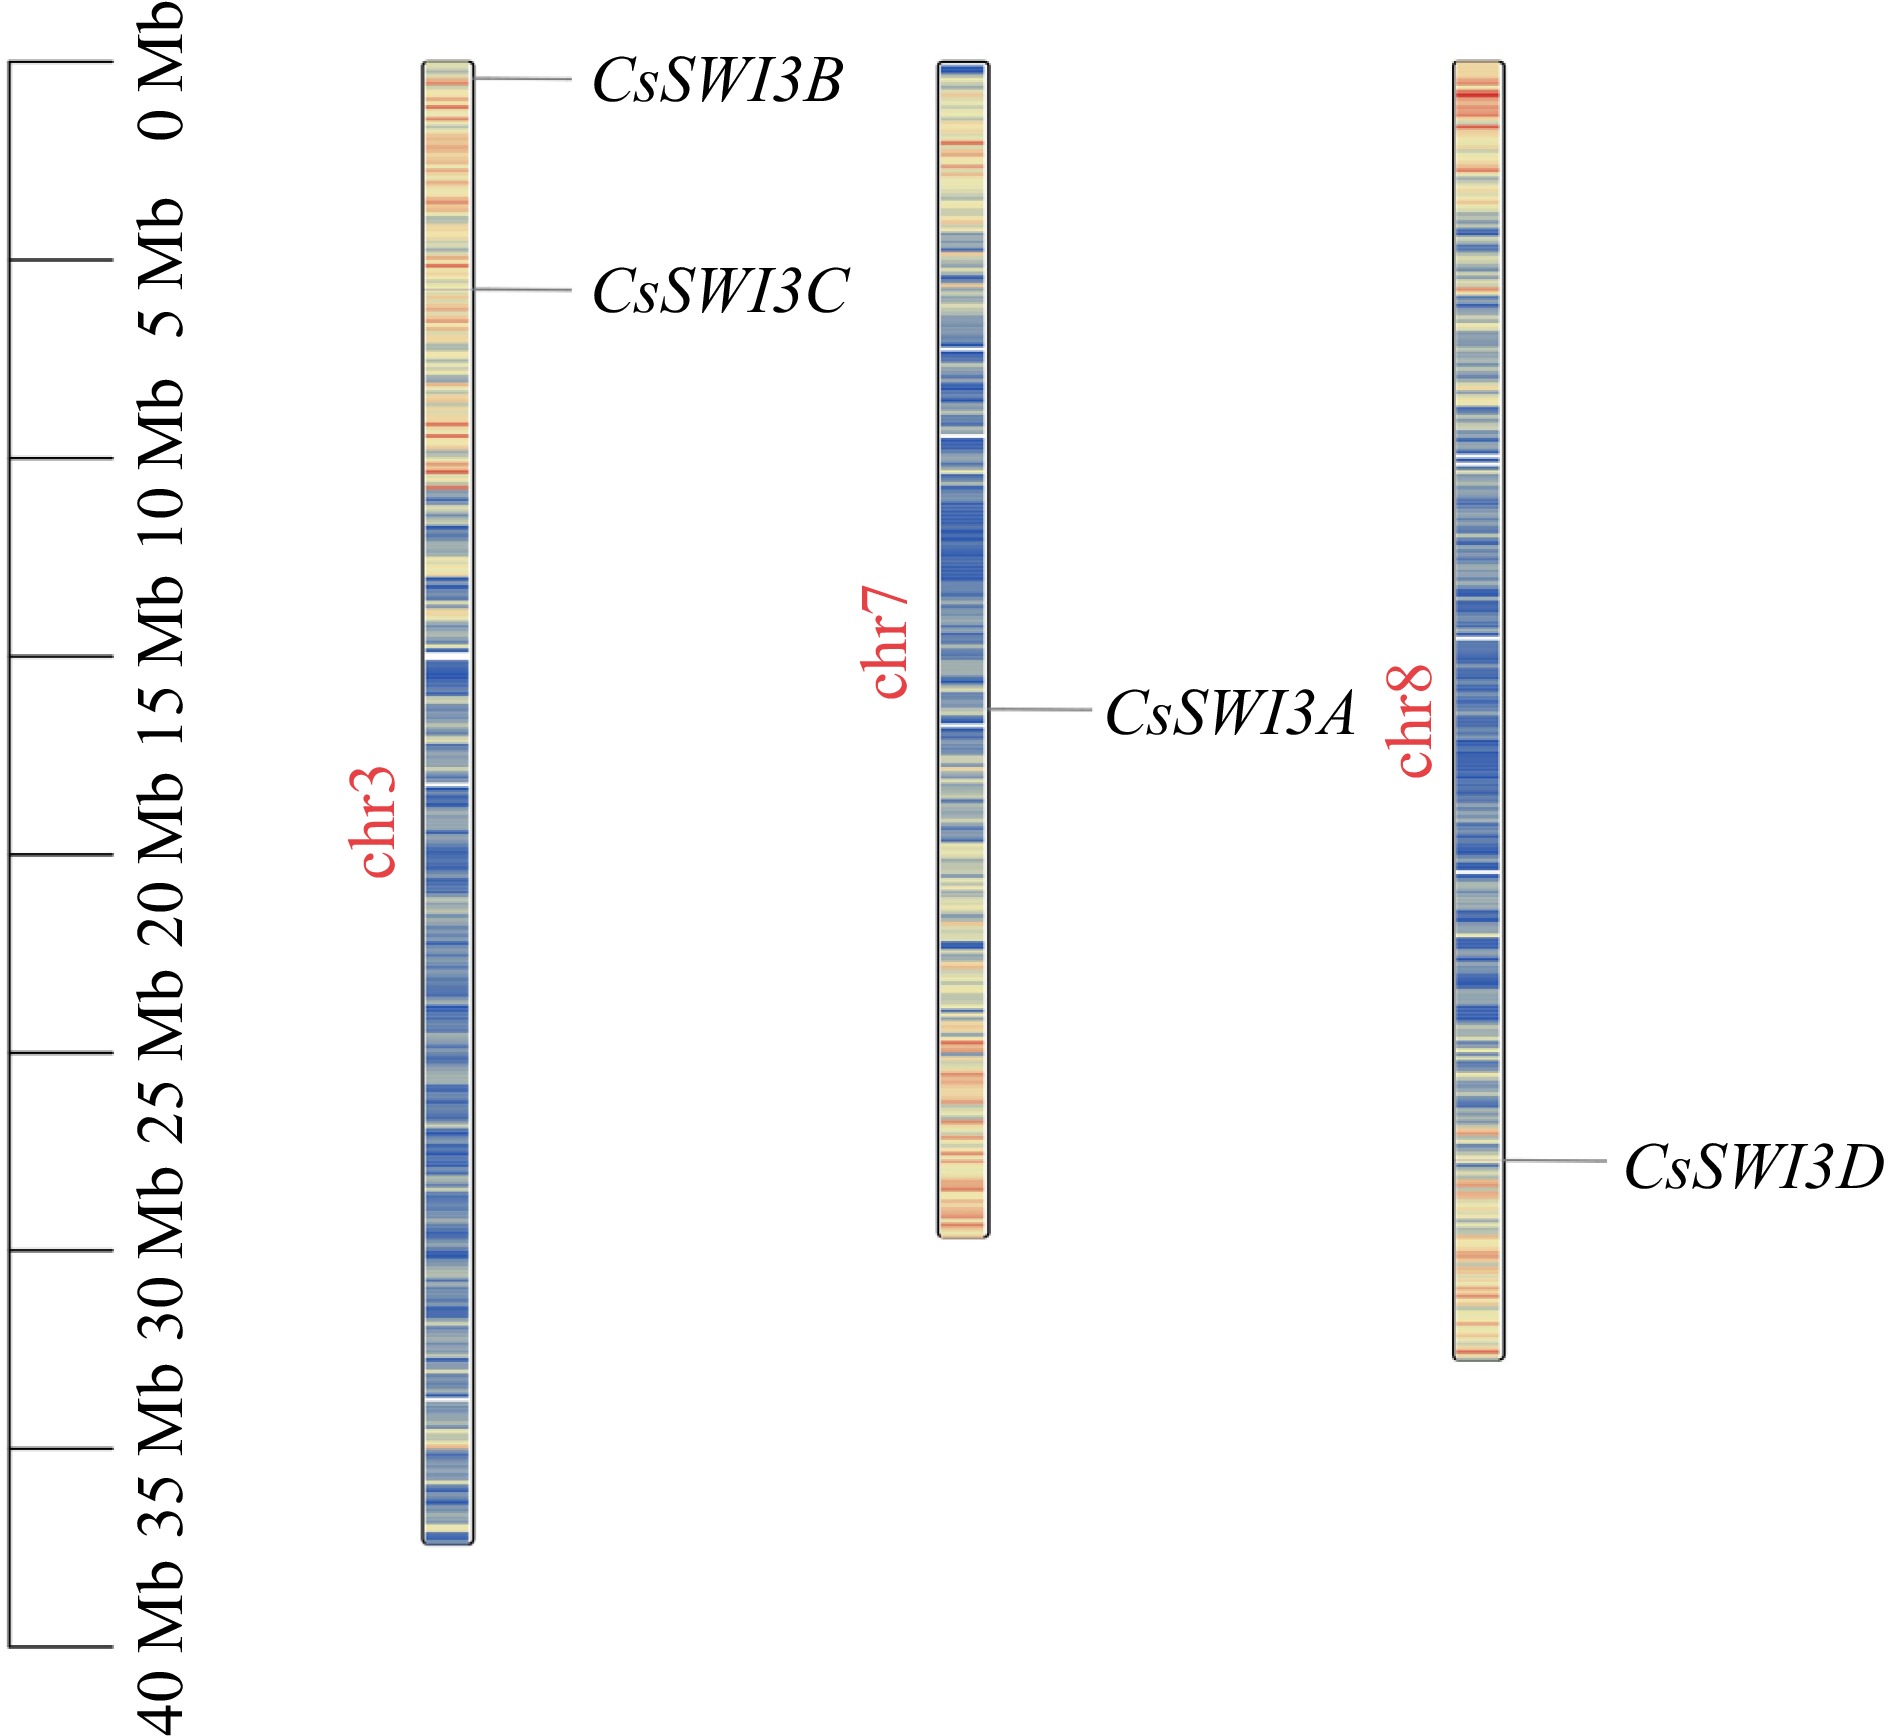
Figure 2.
Chromosomal distribution of CsSWI3s. Color of the chromosome represents the gene density.
-
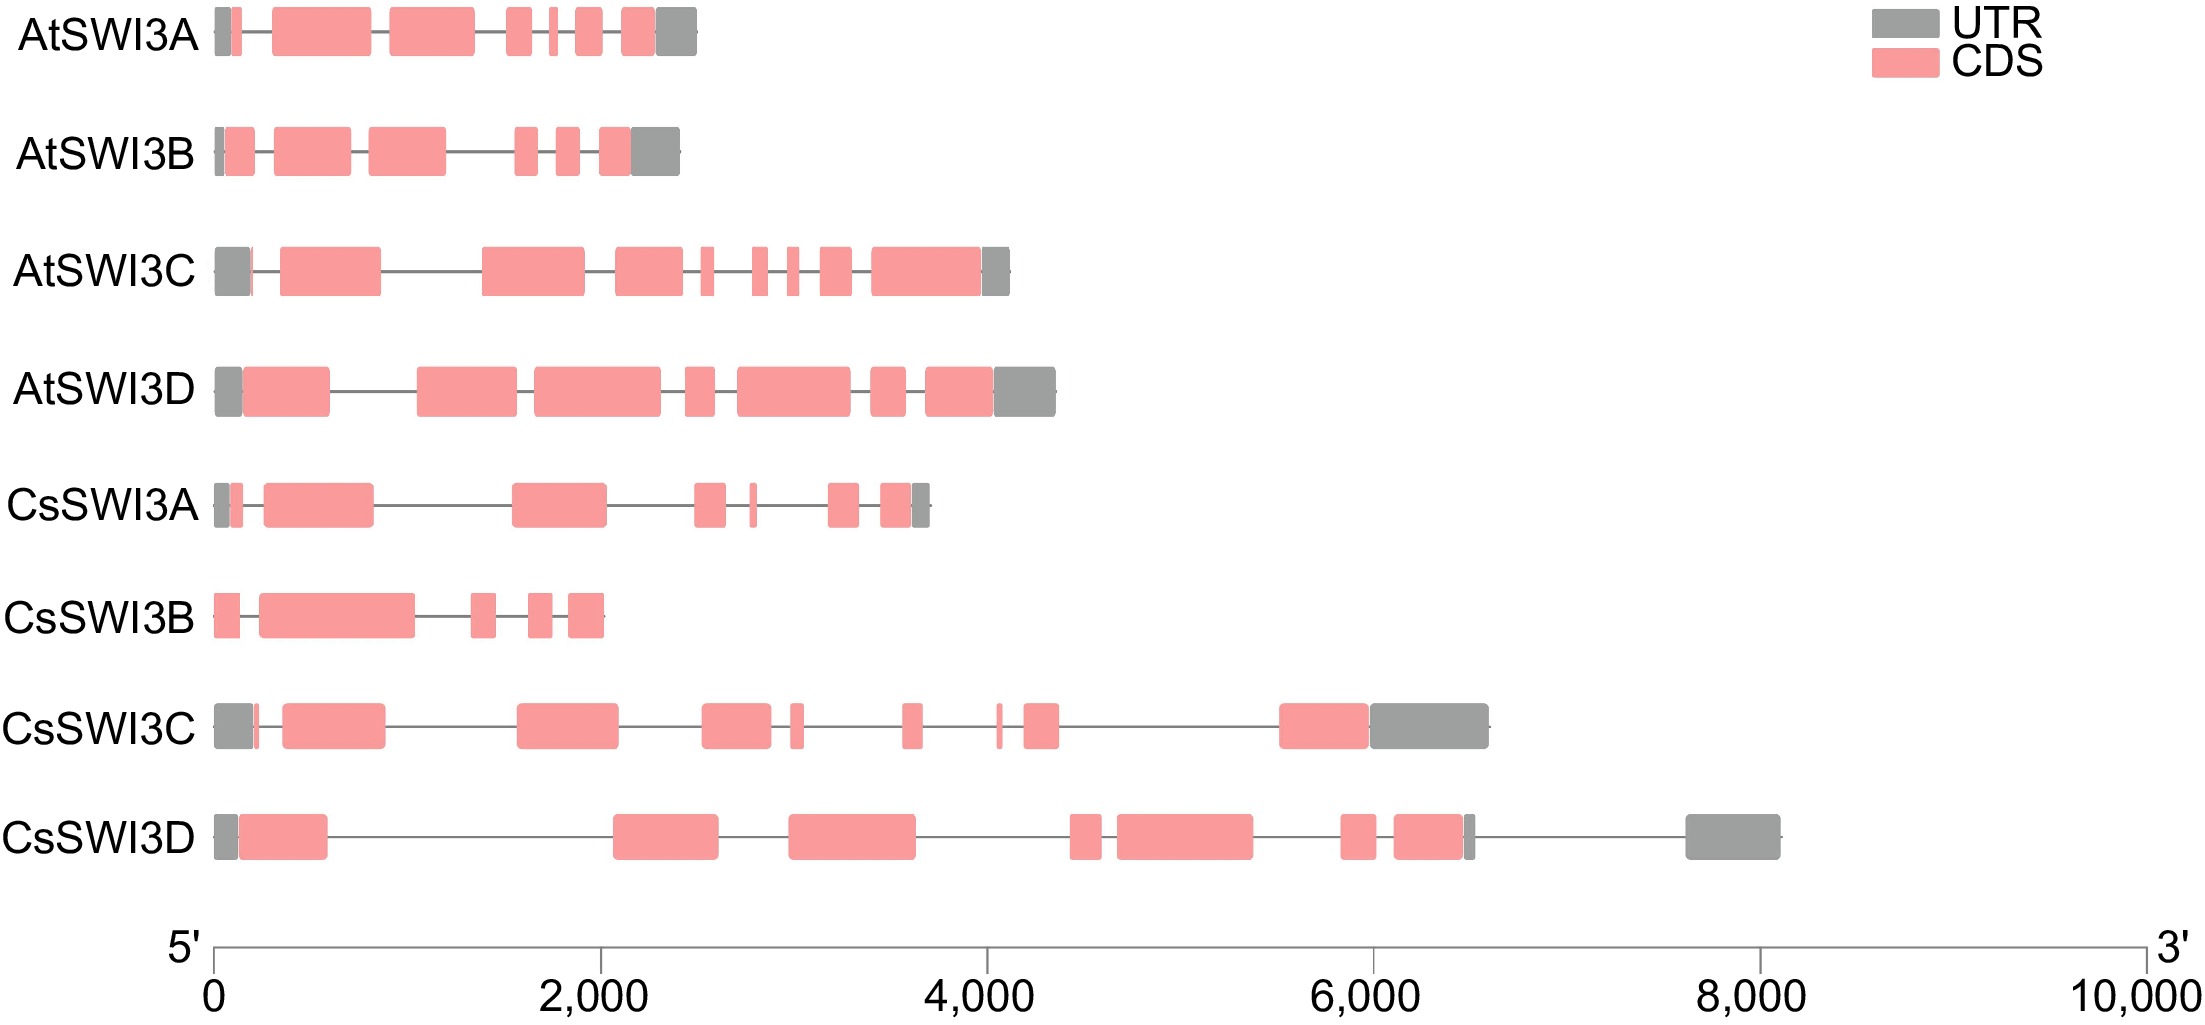
Figure 3.
Gene structure of CsSWI3s and AtSWI3s. Red and gray blocks represent exons and untranslated regions (UTRs) respectively, black lines represent introns.
-

Figure 4.
Conserved motif and domain analysis of SWI3 proteins. (a) Phylogenetic tree of 18 SWI3 proteins. (b) Conserved motifs distribution of SWI3 proteins. Blocks in different colors refer to different motifs. (c) Conserved domains distribution of SWI3 proteins. Different domains are presented in different colored blocks. (d) Ten conserved motifs with the consensus sequences predicted by MEME.
-
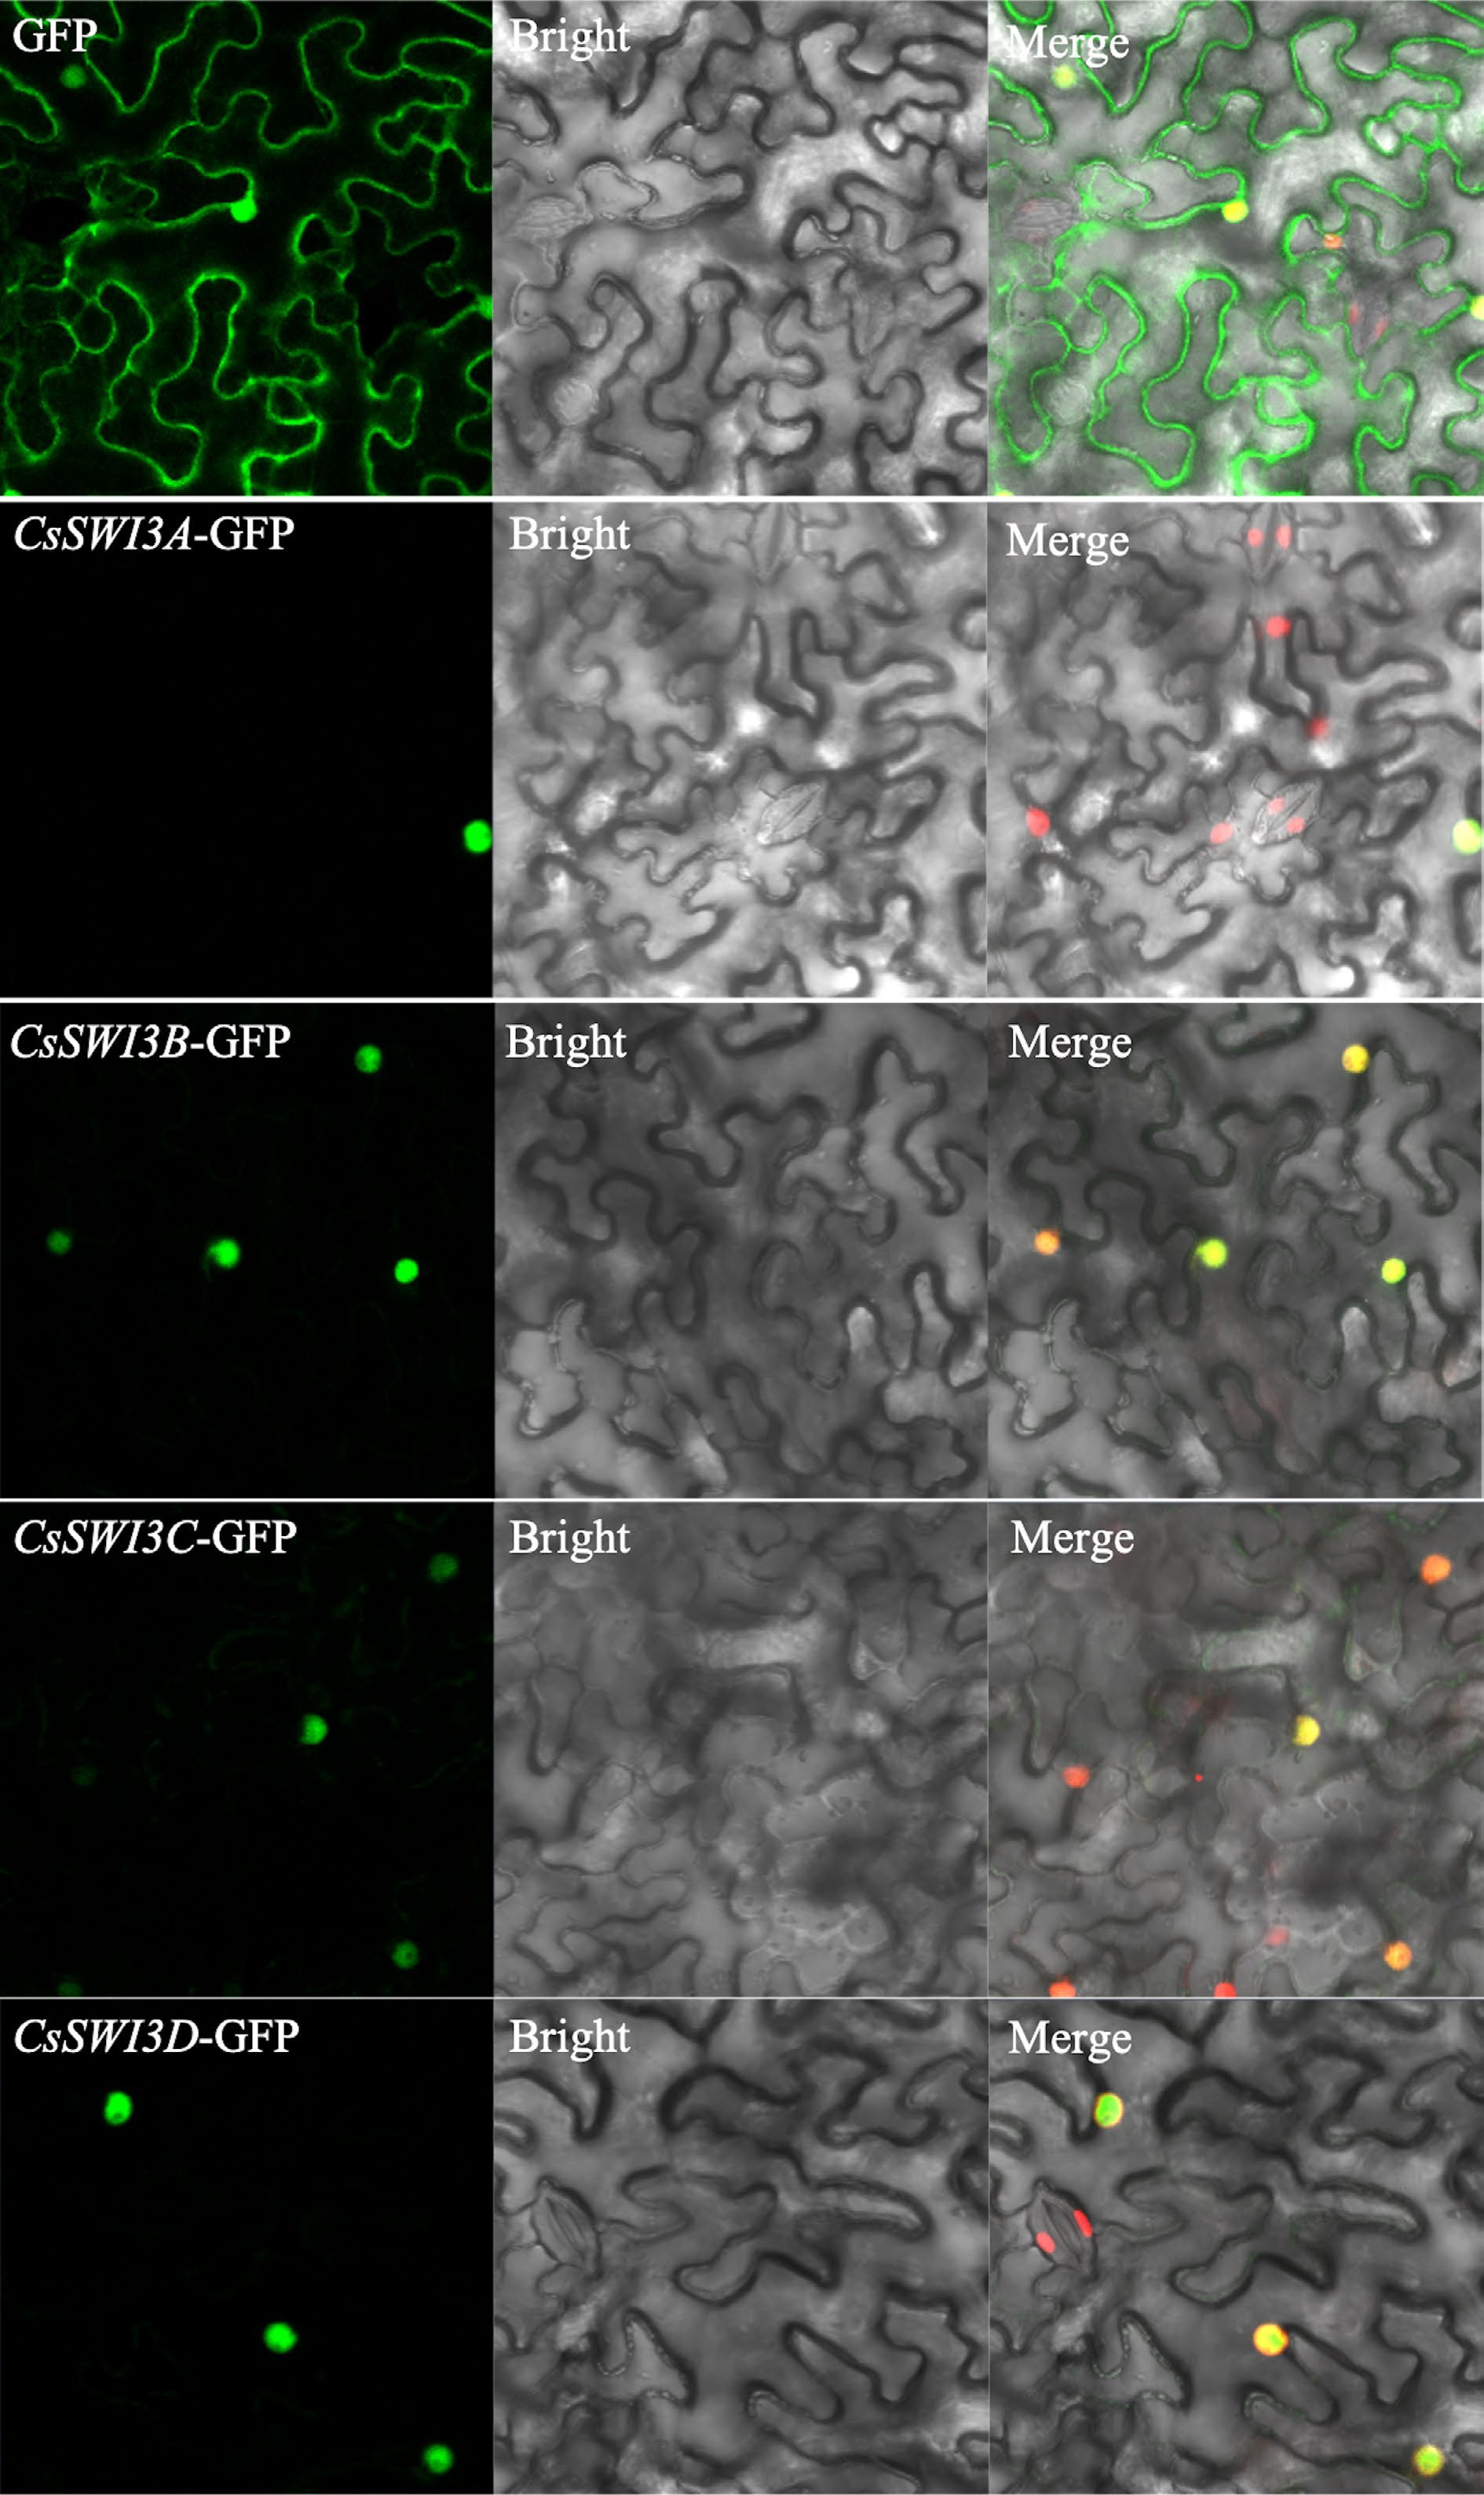
Figure 5.
Subcellular localization of CsSWI3s. Bar = 20 μm.
-
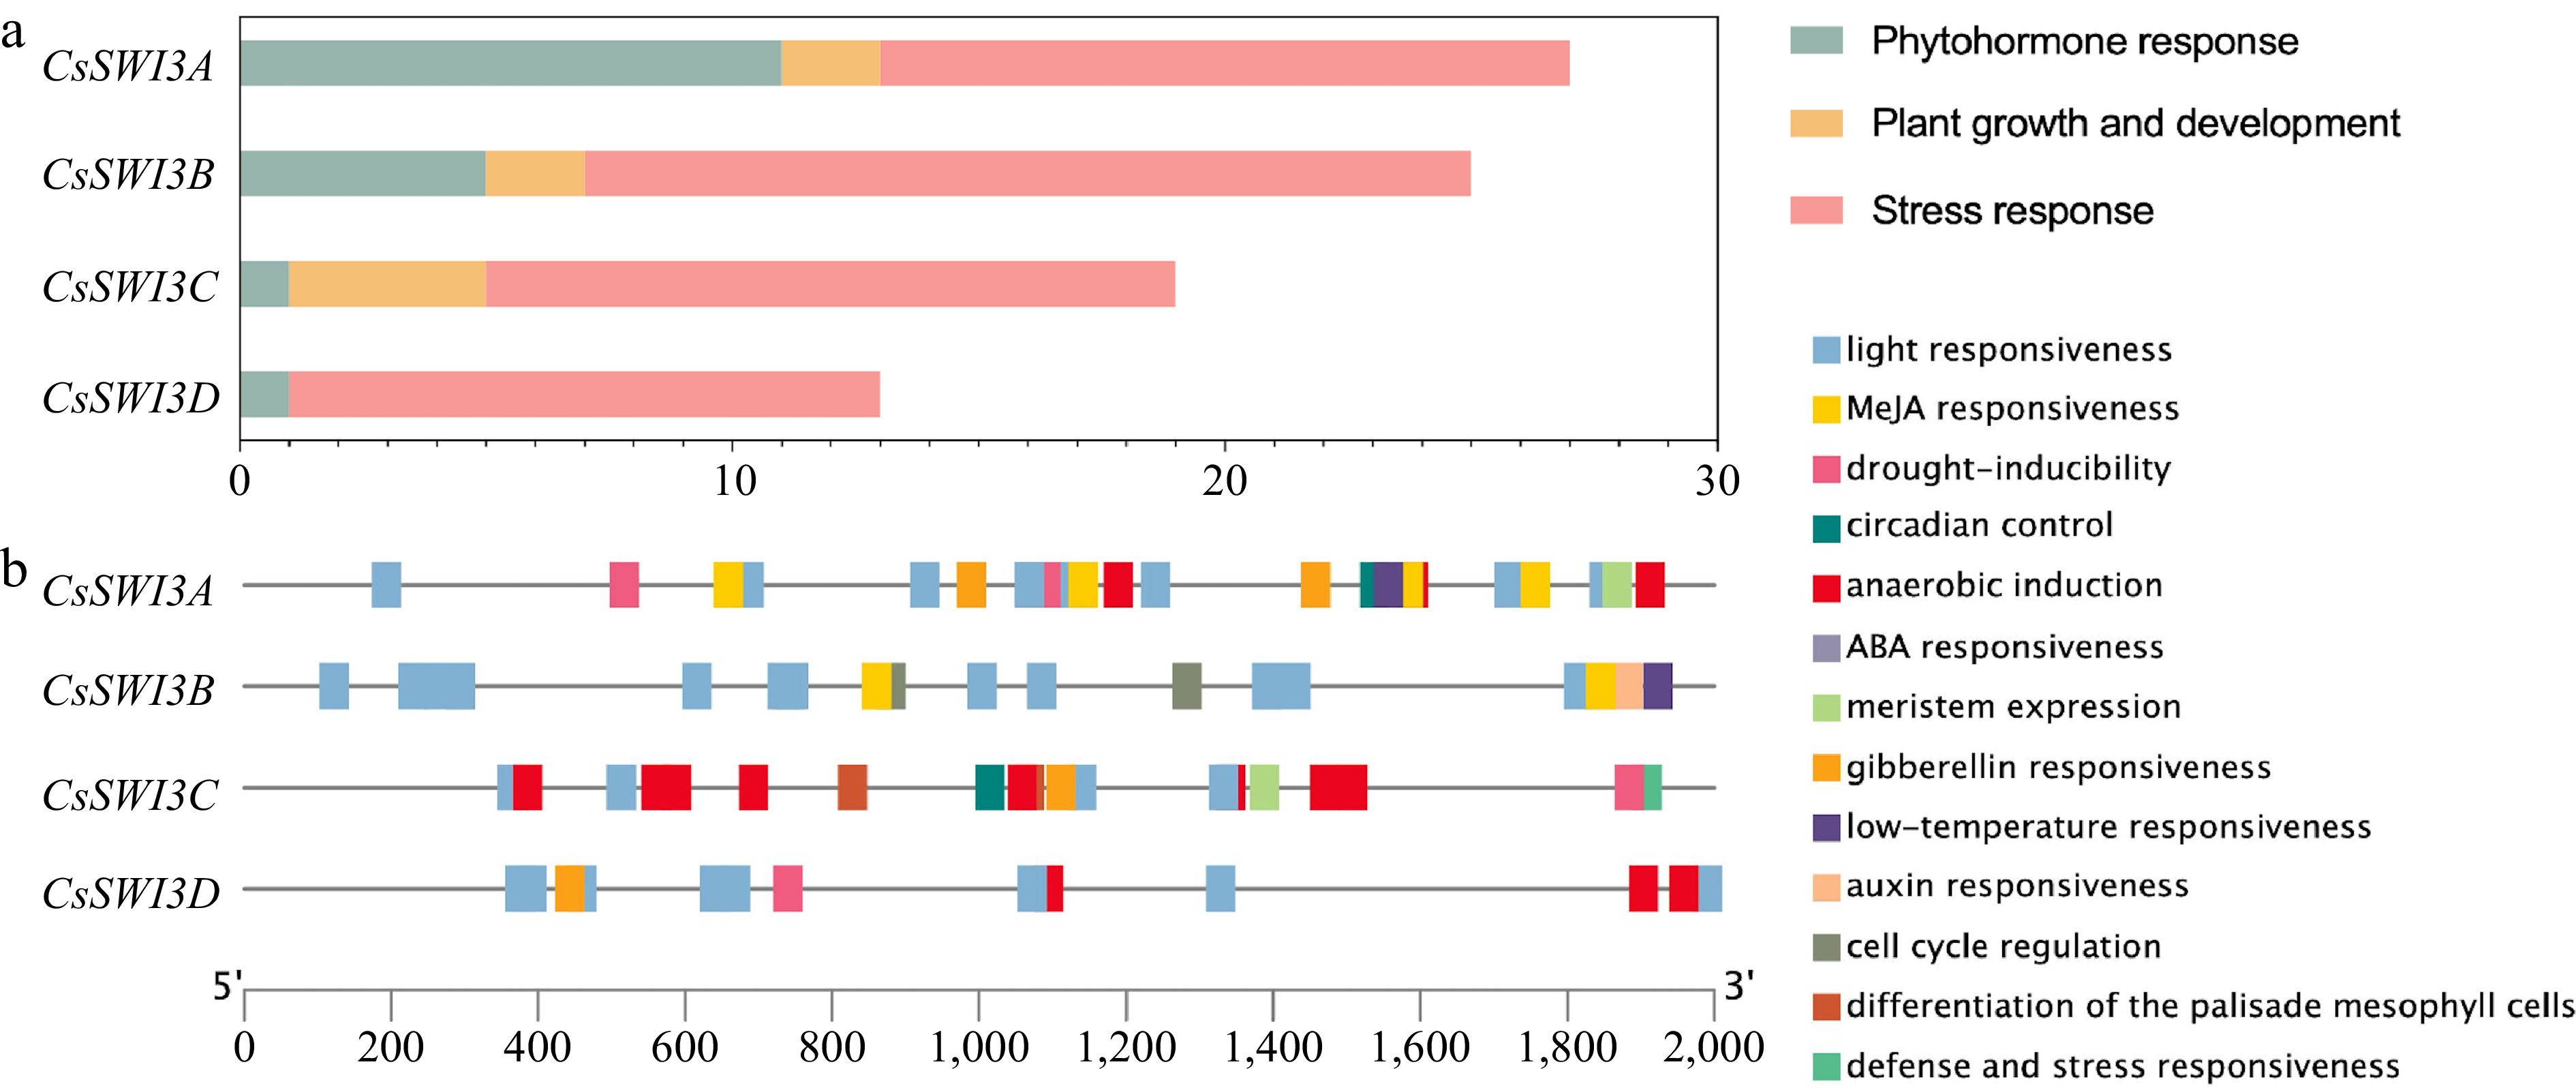
Figure 6.
Promoter cis-regulatory elements analysis of CsSWI3s. (a) The number of three types of cis-regulatory elements on CsSWI3 genes promoter. (b) The cis-regulatory elements within the first 2000 bp fragment upstream of CsSWI3s. Blocks in different colors refer to different elements.
-
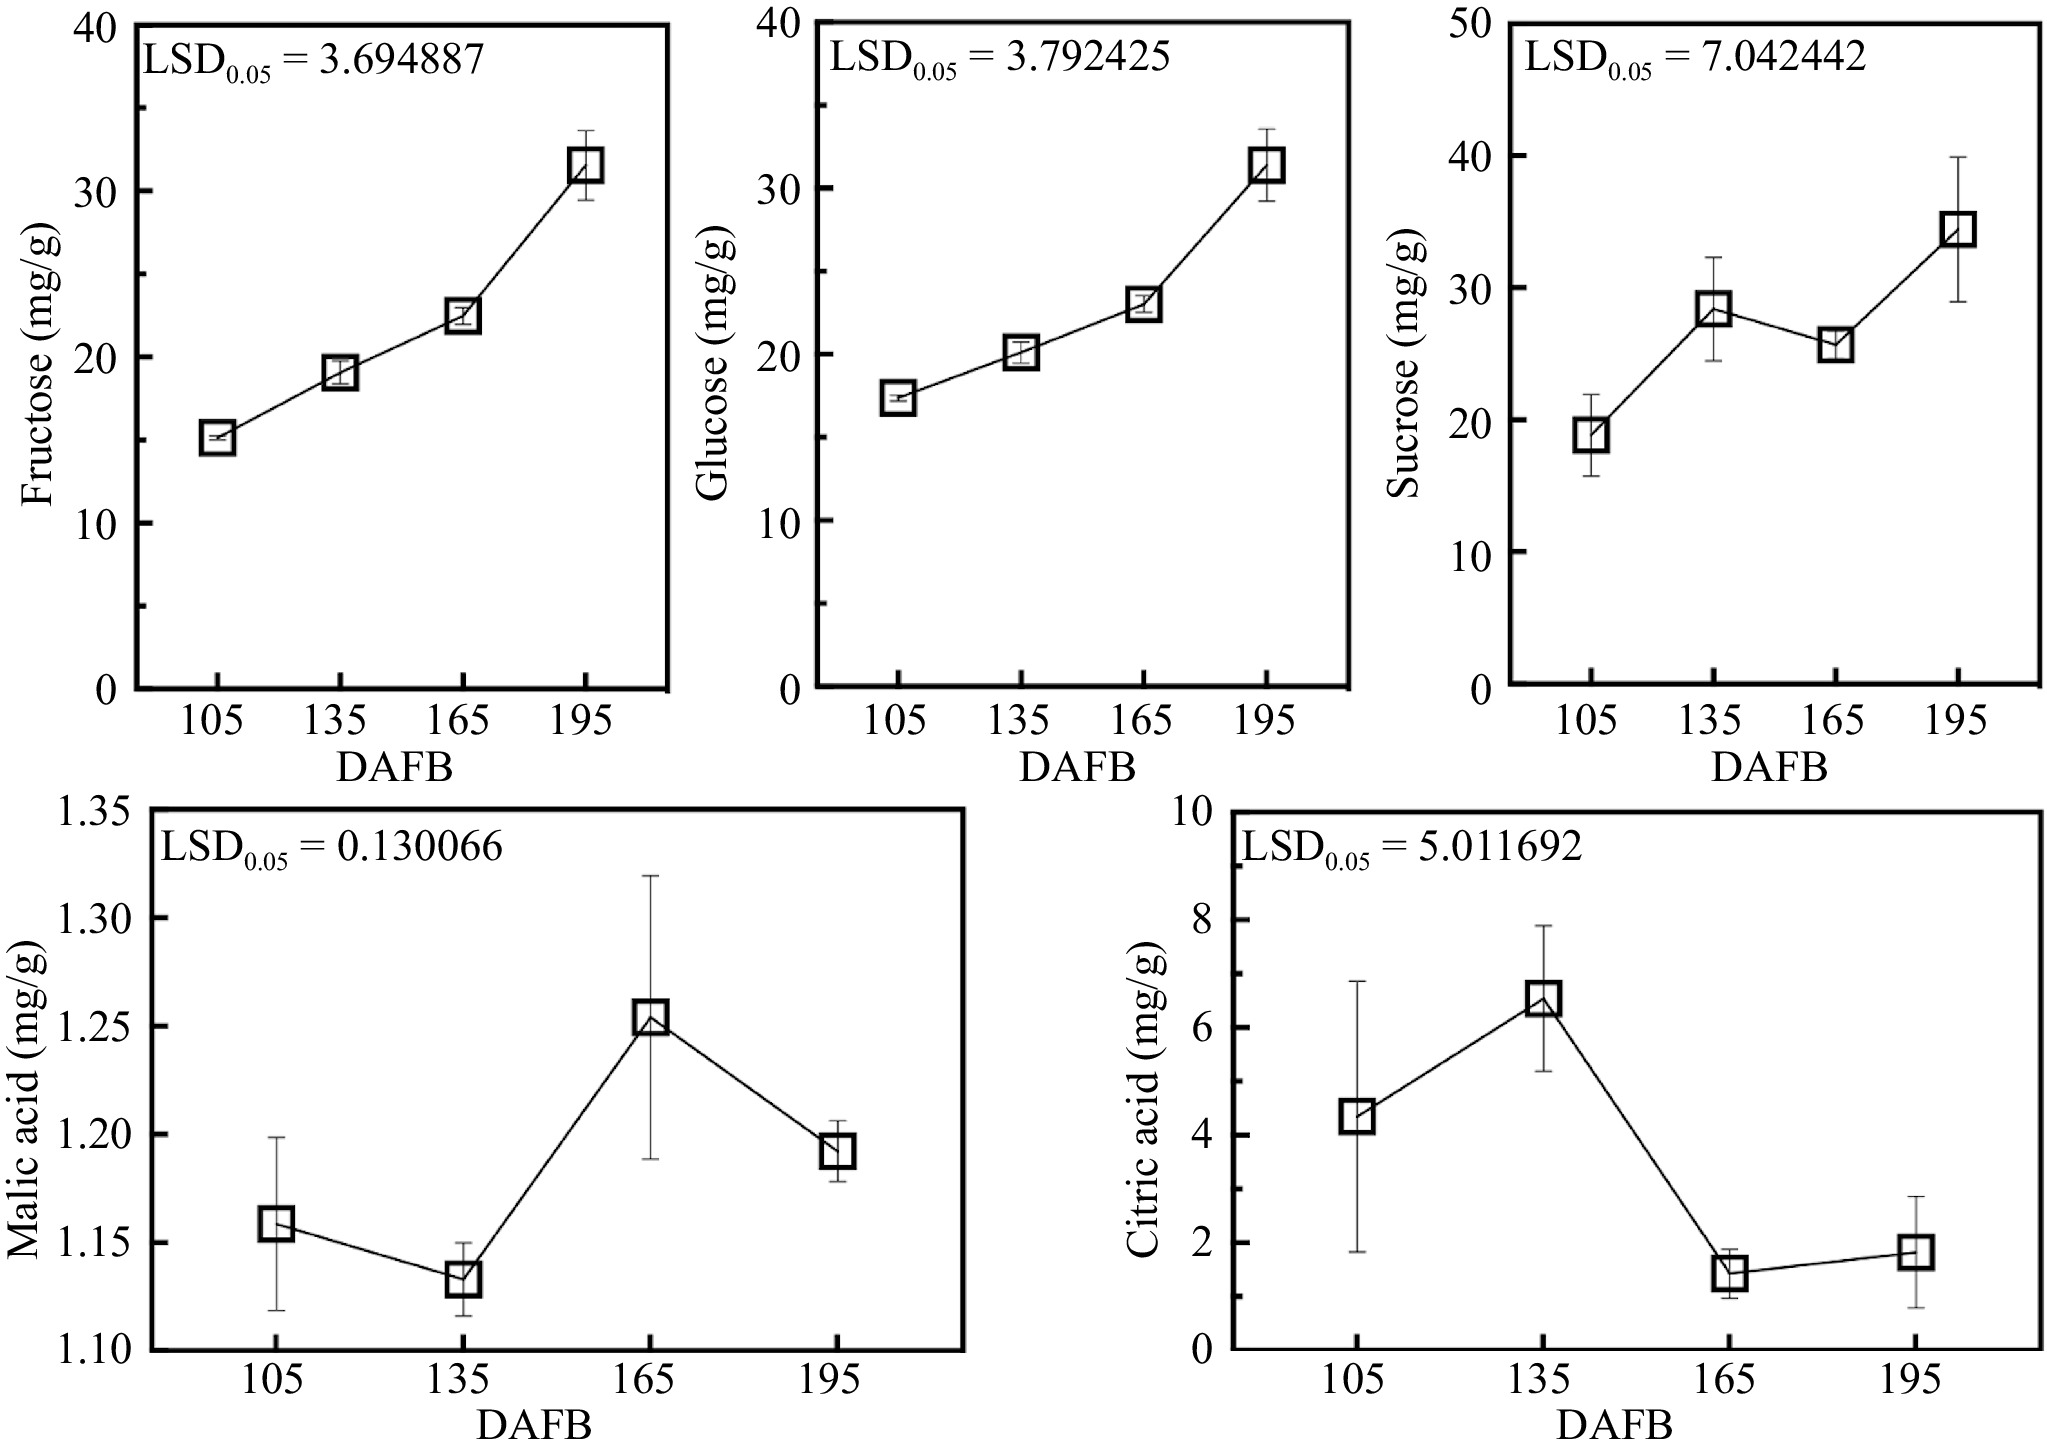
Figure 7.
Sugar (fructose, glucose and sucrose) and organic acid (malic acid and citric acid) content in fruit flesh during different develop periods of 'Bingtang' sweet orange. Error bars represented SE (n = 3), LSD represents the least significant difference between different developmental stages.
-
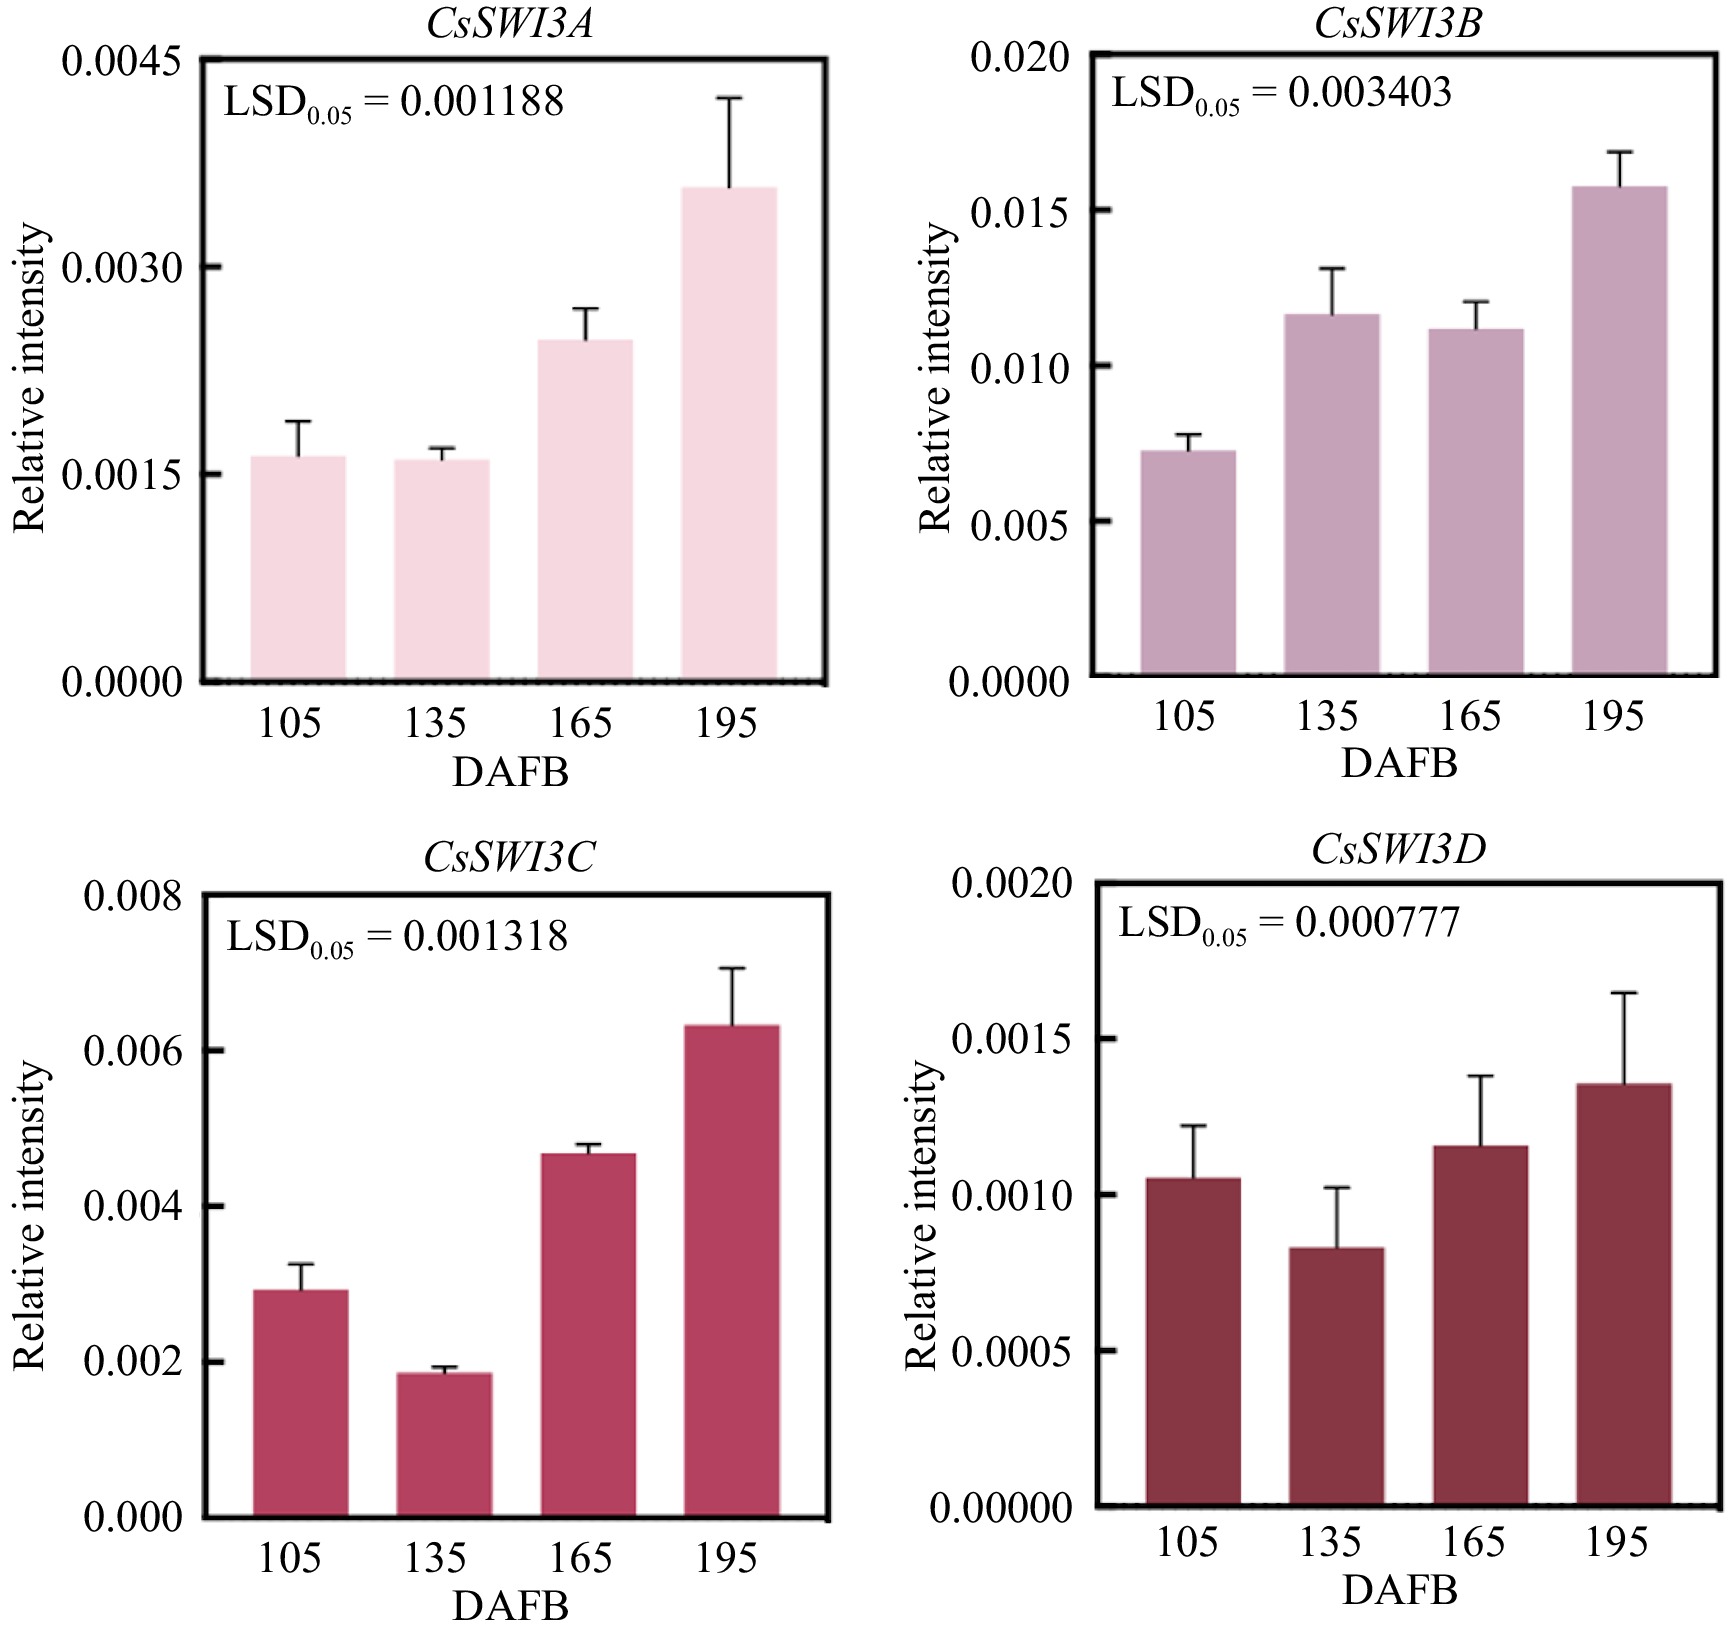
Figure 8.
Gene expression of CsSWI3s at 105, 135, 165 and 195 DAFB in 'Bingtang' sweet orange fruit. Error bars represent SE (n = 3), LSD represents the least significant difference between different developmental stages.
-
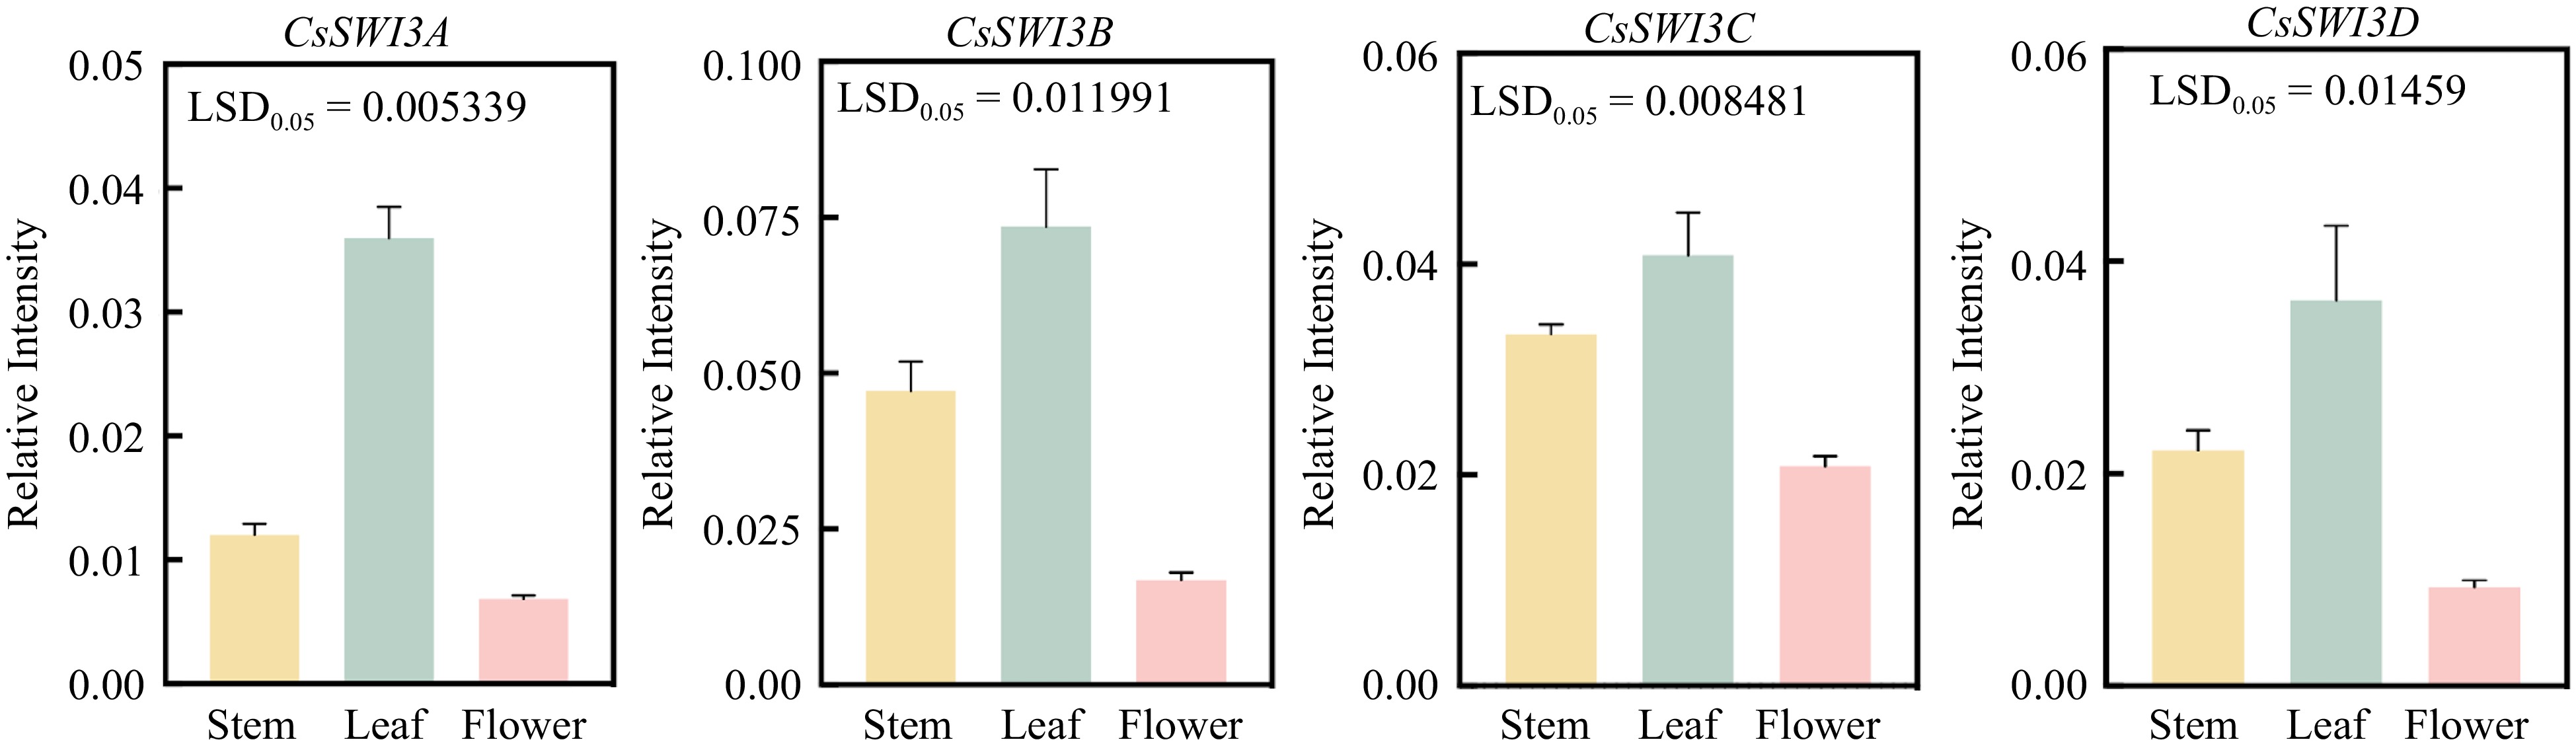
Figure 9.
Gene expression patterns of CsSWI3s in different tissues of 'Bingtang' sweet orange. Error bars represent SE (n = 3), LSD represents the least significant difference between different tissues.
-

Figure 10.
Correlation analysis between CsSWI3s gene expression and content of sugar and organic acids based on the linear regression method.
Figures
(10)
Tables
(0)