-

Figure 1.
The planting mode and different performance of (a) trees and (b) fruits of Cj + LL and Pt + LL, and (c) the fruit quality data of peel color parameters, single fruit weight, total soluble solid and titratable acid of Cj + LL and Pt + LL at five different development stages. Cj + LL: Ziyang xiangcheng + Lane Late navel orange; Pt + LL: Poncirus trifoliate + Lane Late navel orange. DAF: days after flowering. Bars represent the standard error (n = 3). A single asterisk (*) represents statistically significant differences (p < 0.05). Analyzed using t test.
-
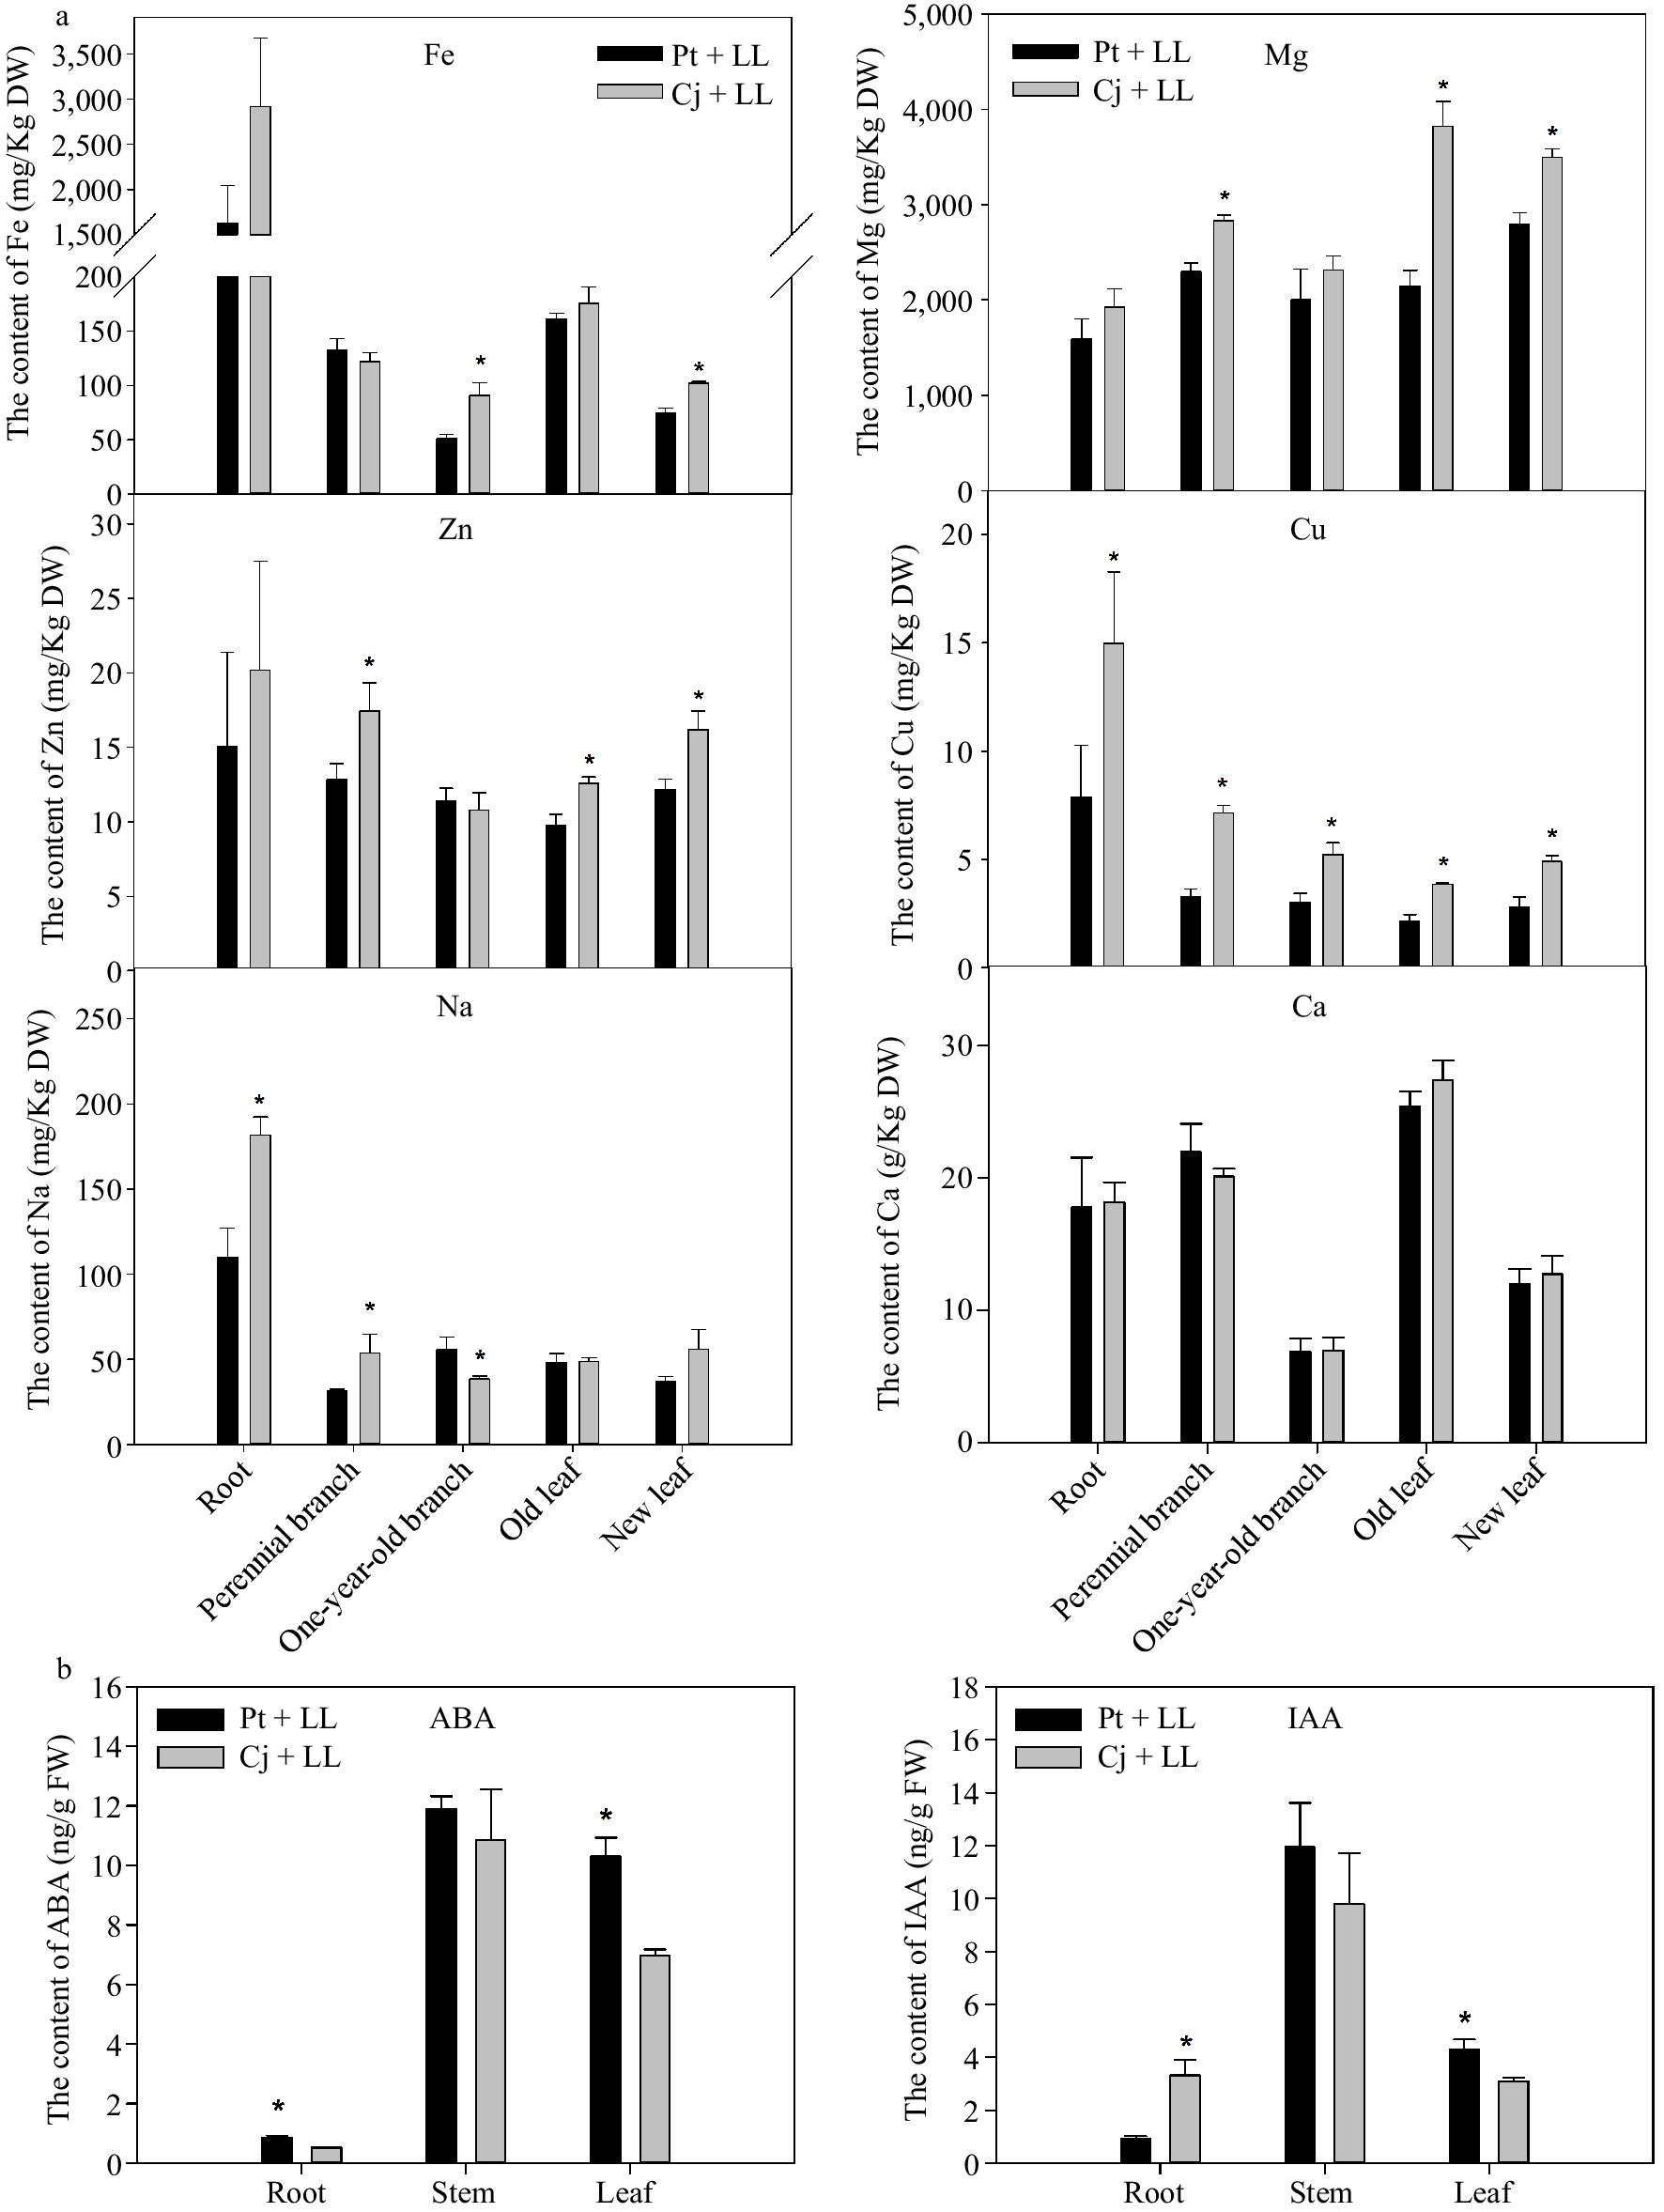
Figure 2.
The content of several mineral elements in different tissues of (a) Cj + LL and Pt + LL and (b) the content of ABA and IAA in the root, stem and leaf tissues of Cj + LL and Pt + LL. Cj + LL: Ziyang xiangcheng + Lane Late navel orange; Pt + LL: Poncirus trifoliate + Lane Late navel orange. Bars represent the standard error (n = 3). A single asterisk (*) represents statistically significant differences (p < 0.05). Analyzed using Student's t test.
-
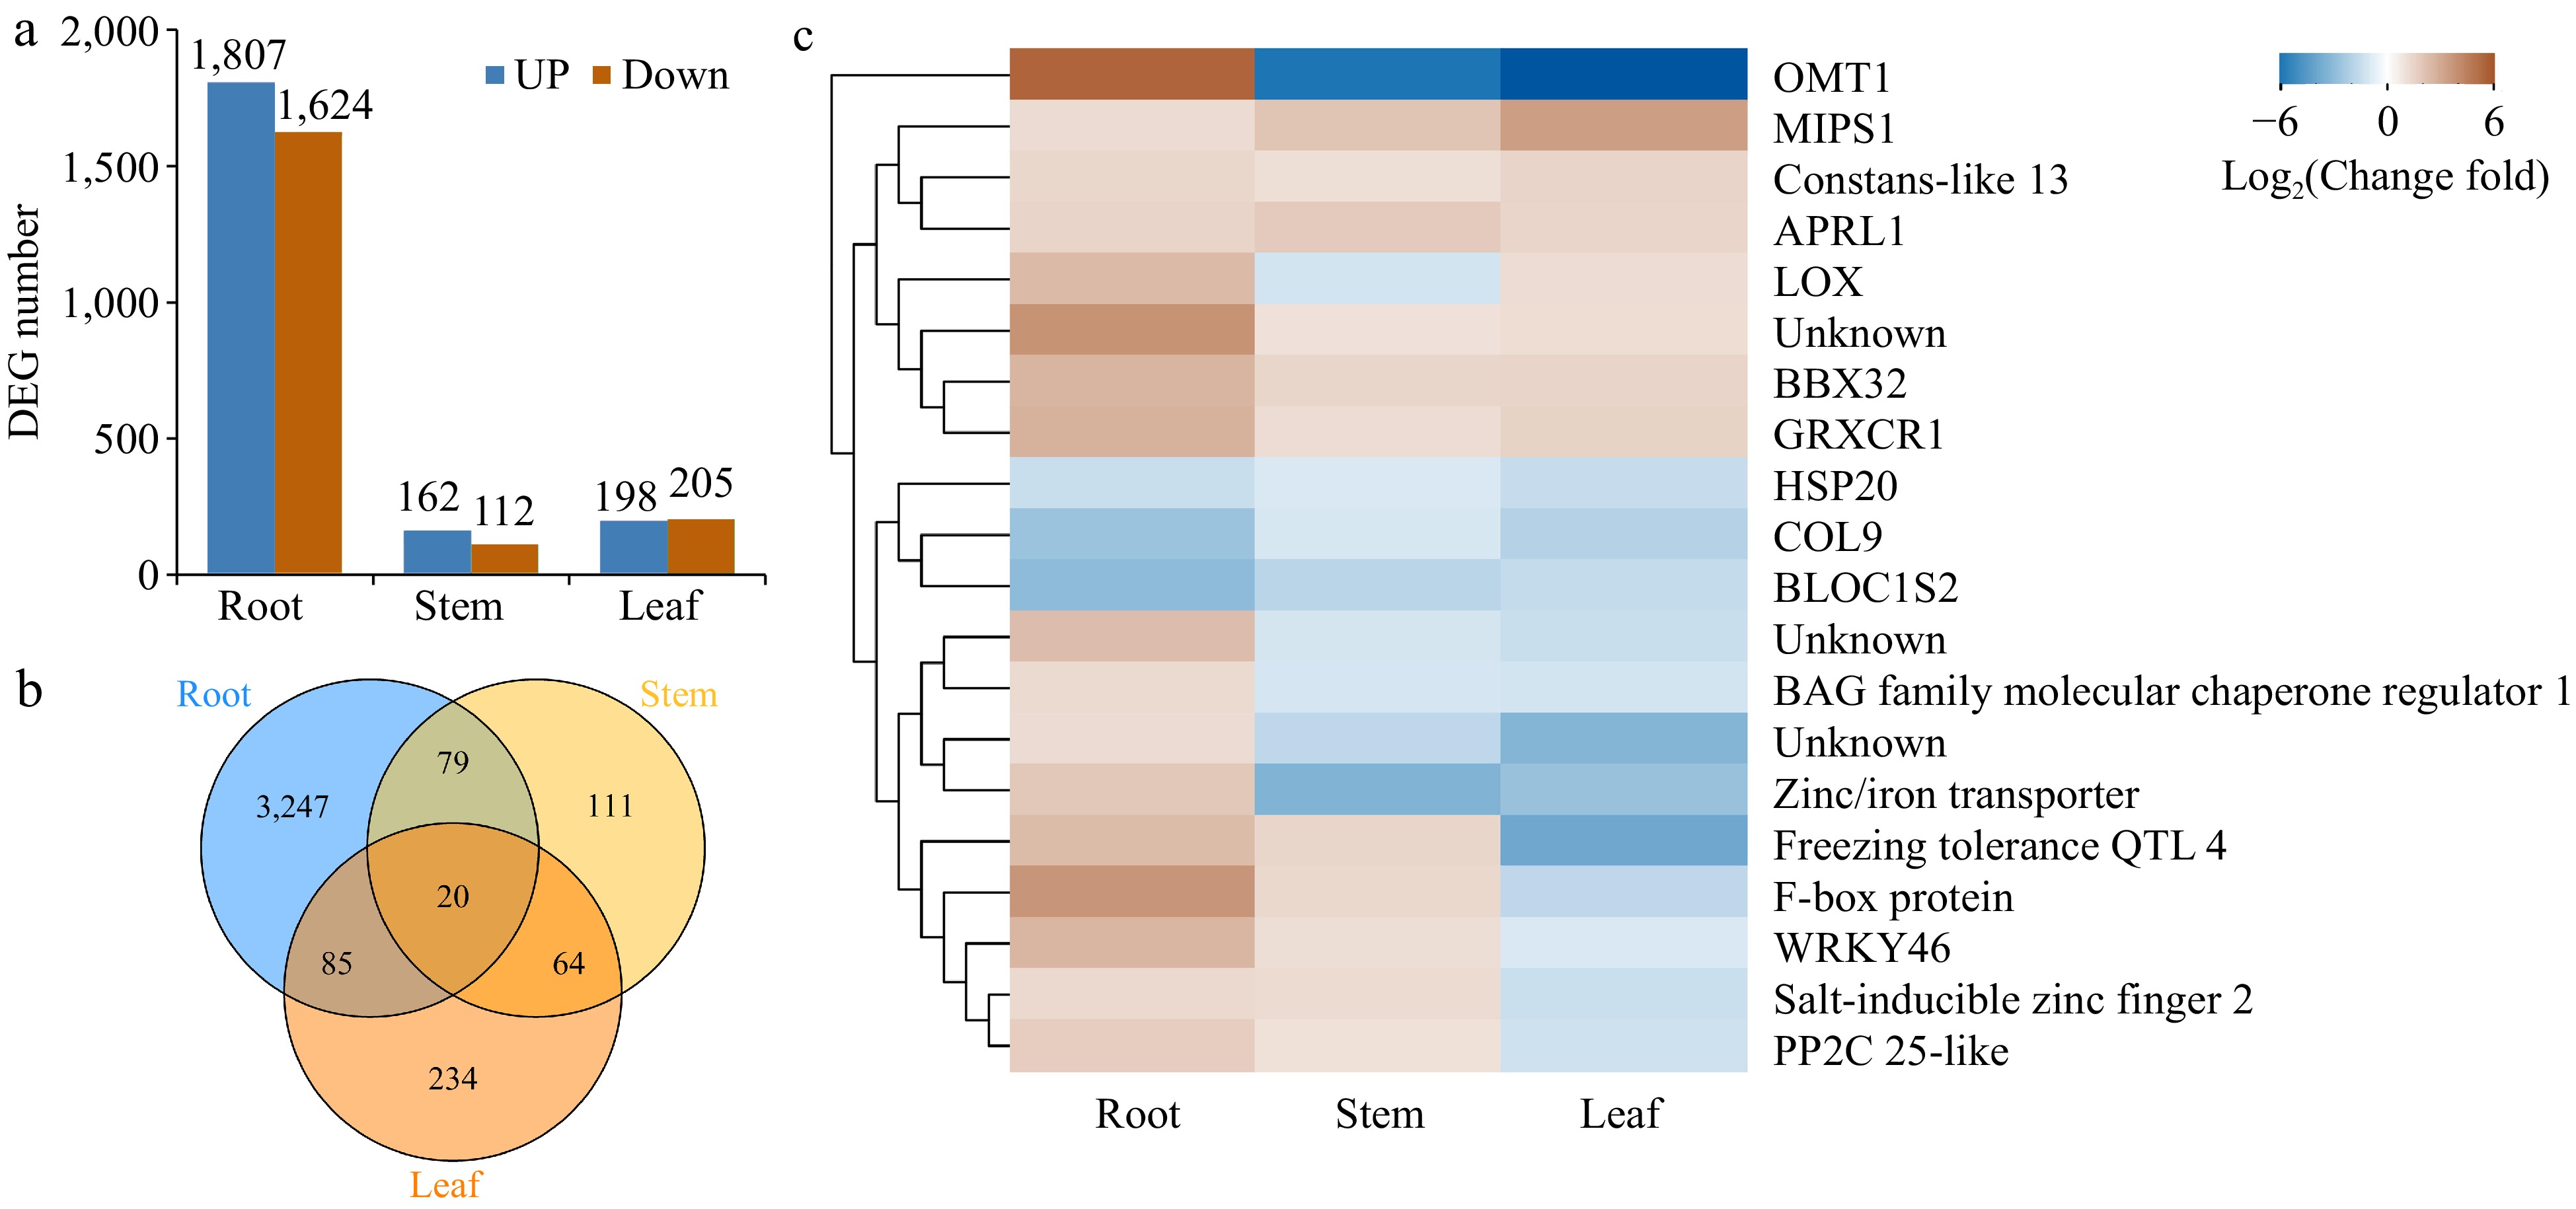
Figure 3.
Global analysis of gene expression in different tissues of Cj + LL and Pt + LL. (a) The number of differentially expressed genes in the root, stem and leaf tissues. (b) Venn diagram showing the number of commonly and uniquely expressed genes in the root, stem and leaf tissues. (c) Heatmap showing the genes differentially expressed in the root, stem and leaf tissues. DEG: differentially expressed gene.
-
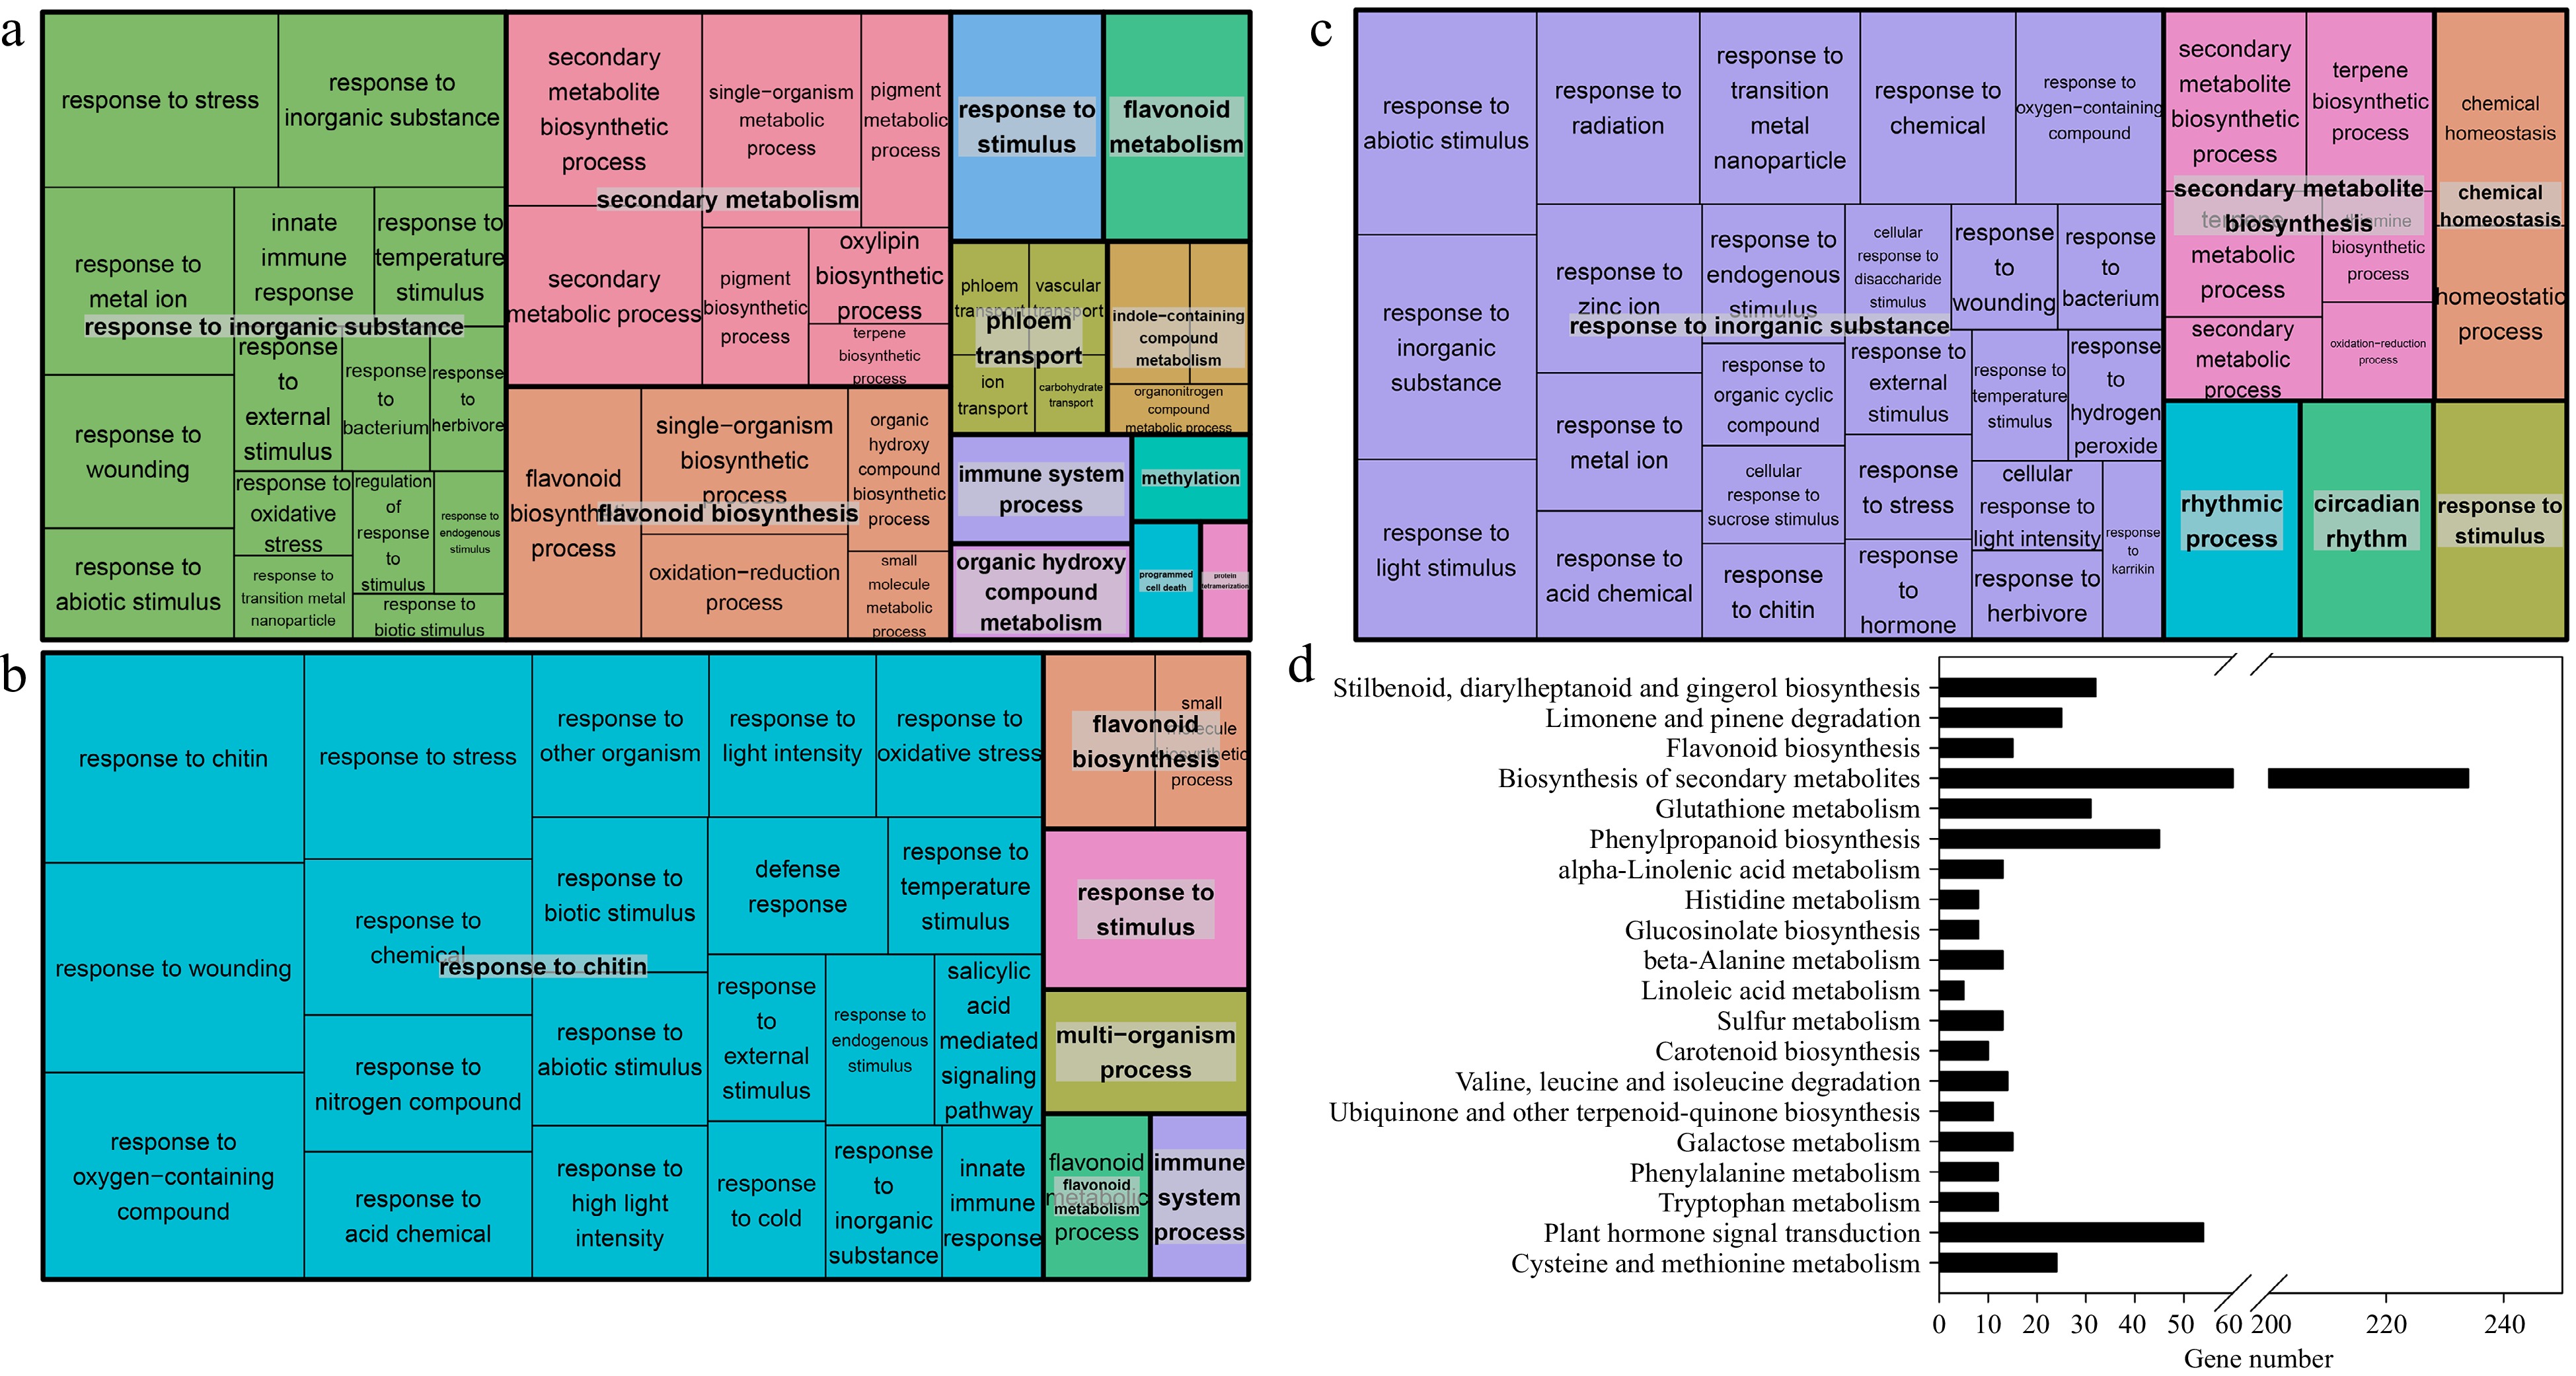
Figure 4.
Treemap showing the Gene Ontology (GO) enrichment analysis and the enriched KEGG pathways of the DEGs in the (a), (d) root tissue, (b) stem tissue and (c) leaf tissue of Cj + LL and Pt + LL. (a)−(c), biological processes; (d) KEGG pathways. Each rectangle is a single cluster representative. The representatives are joined into 'superclusters' of loosely related terms, visualized with different colors. The size of the rectangles may be adjusted to reflect either the p value or the frequency of the GO term in the underlying GO database. KEGG: Kyoto Encyclopedia of Genes and Genomes.
-

Figure 6.
The contents of (a) JA, (b) lignin, (c) GSH, (d) MDA and (e) H2O2 in Cj + LL and Pt + LL. JA: jasmonate; GSH: glutathione; ABA: abscisic acid; IAA: indole-3-acetic acid. A single asterisk (*) represents statistically significant differences (p < 0.05), and double asterisks (**) represent highly statistically significant differences (p < 0.01). Analyzed using Student's t test.
-
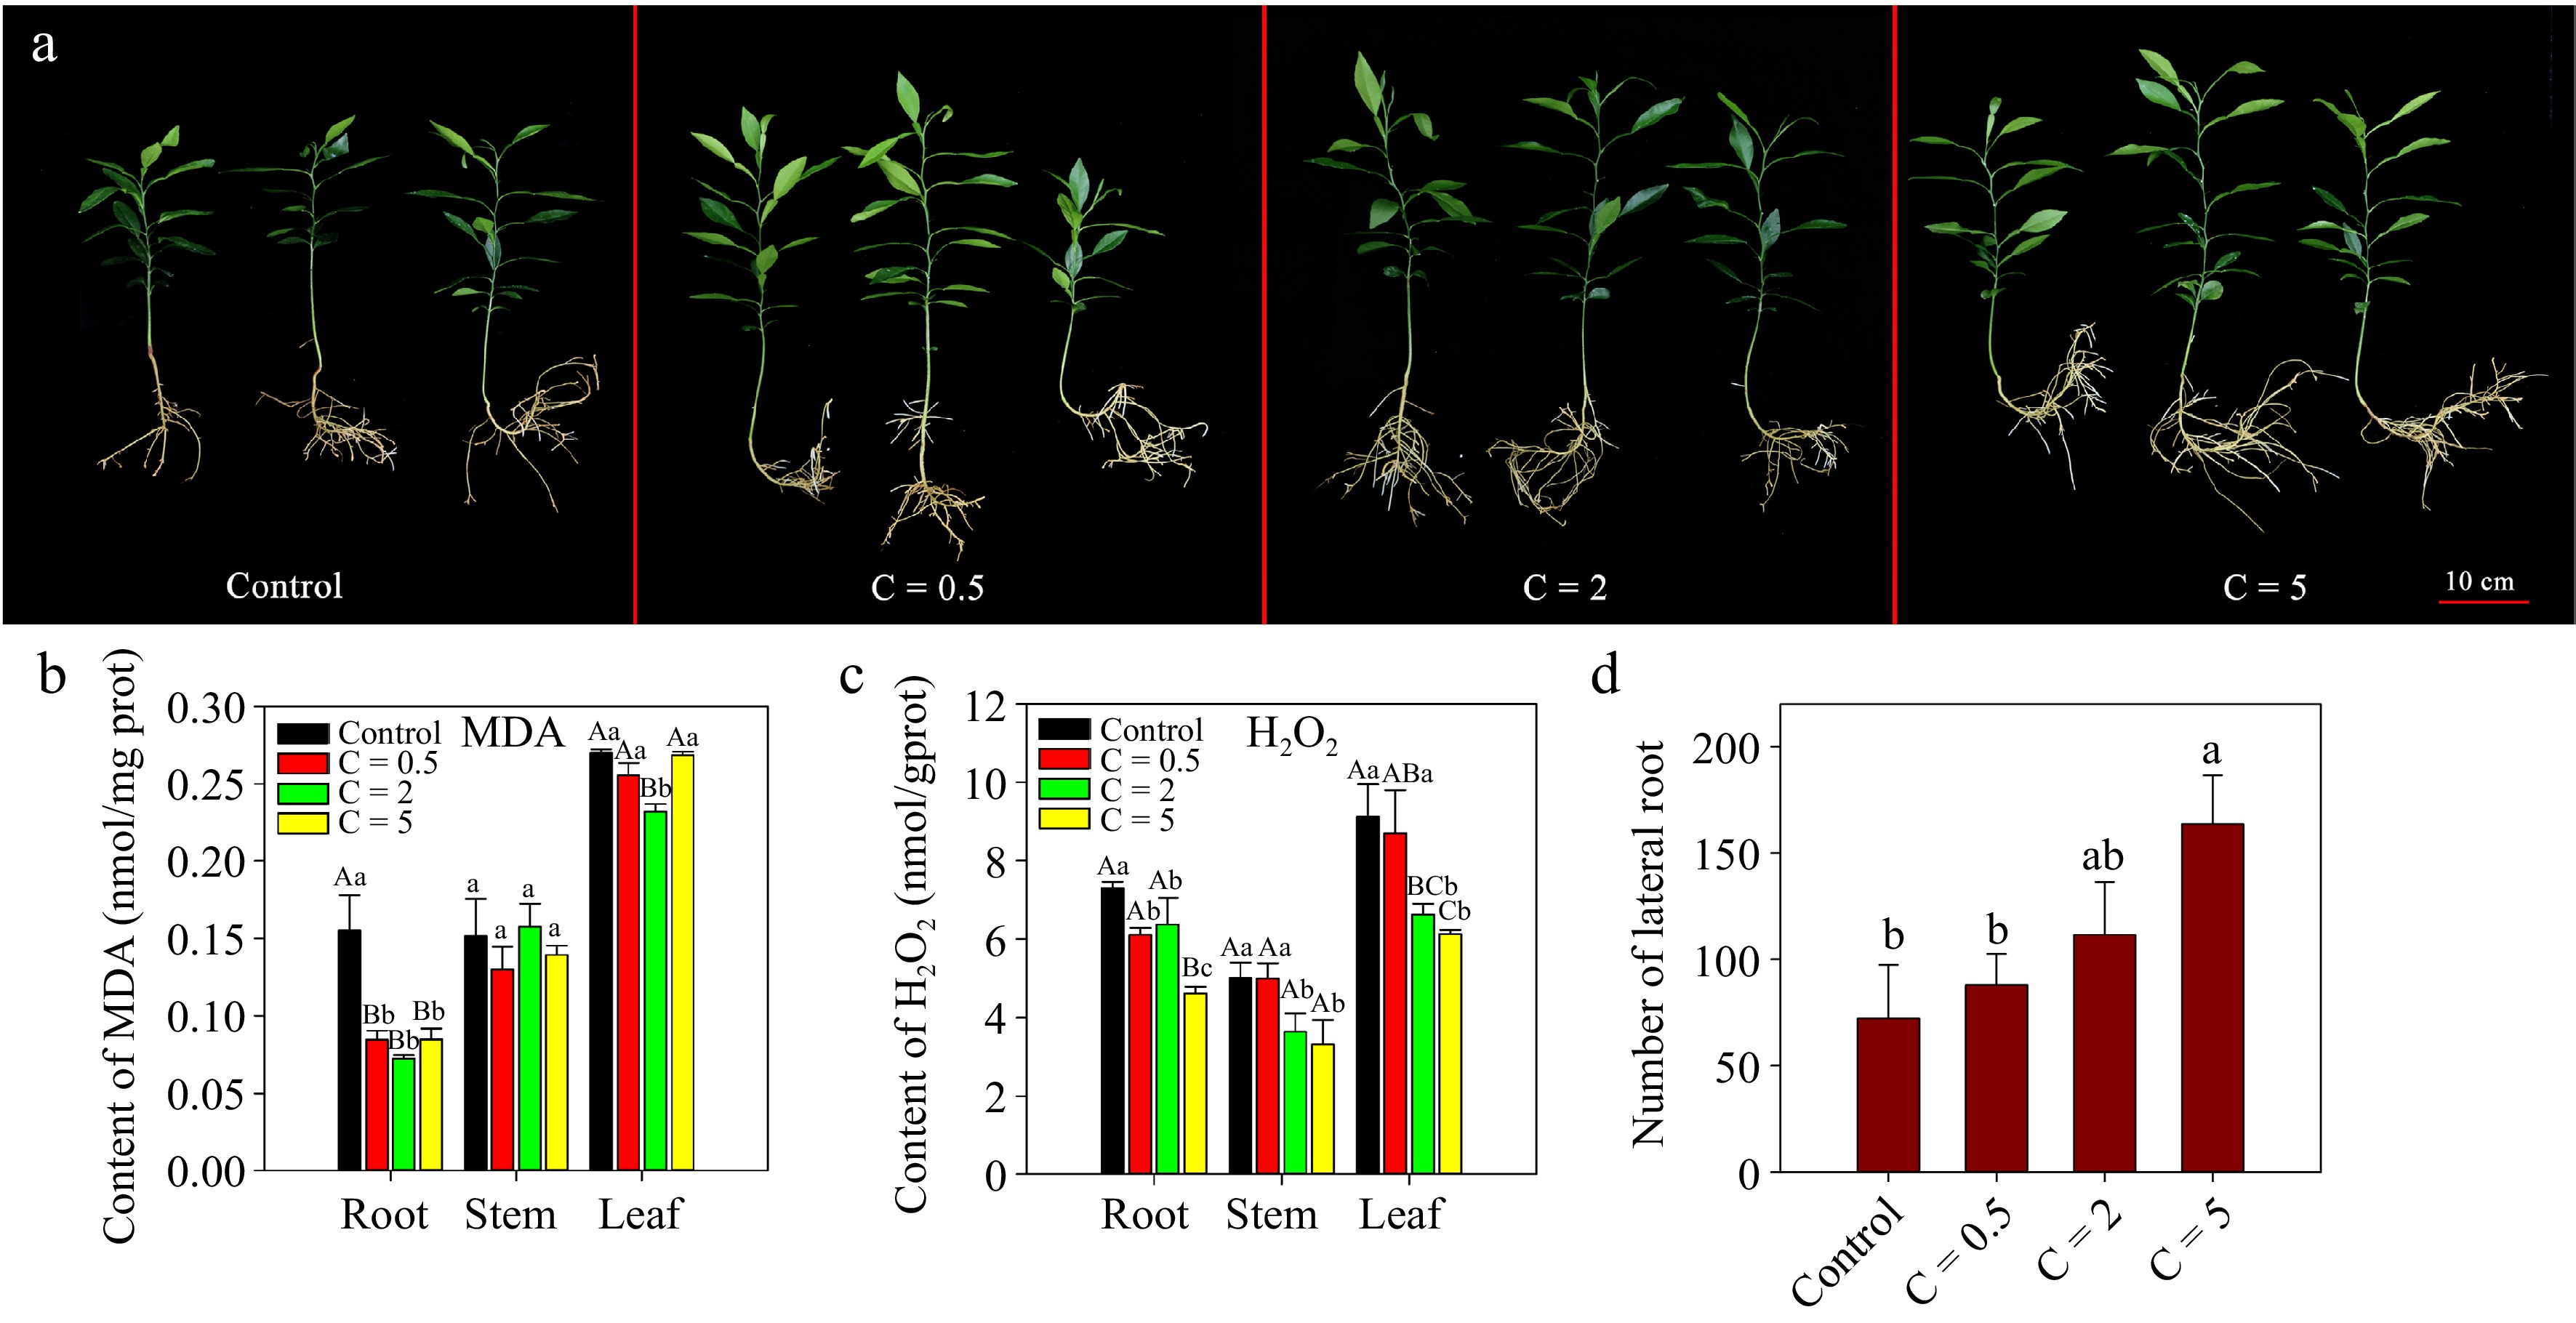
Figure 7.
Exogenous JA treatment of Cj seedlings with different concentrations under alkalinity stress. (a) Phenotypes of Cj seedlings; (b)−(c) contents of MDA and H2O2 in the root, stem and leaf tissues; (d) number of LRs of Cj seedlings. In this figure, the treatment groups are named 'C=concentration'. C = 0.5 indicates that the JA treatment concentration was 0.5 μM. Lowercase and capital letters represent statistically significant differences (p < 0.05) and highly statistically significant differences (p < 0.01), respectively. Data were analyzed using one-way ANOVA.
-
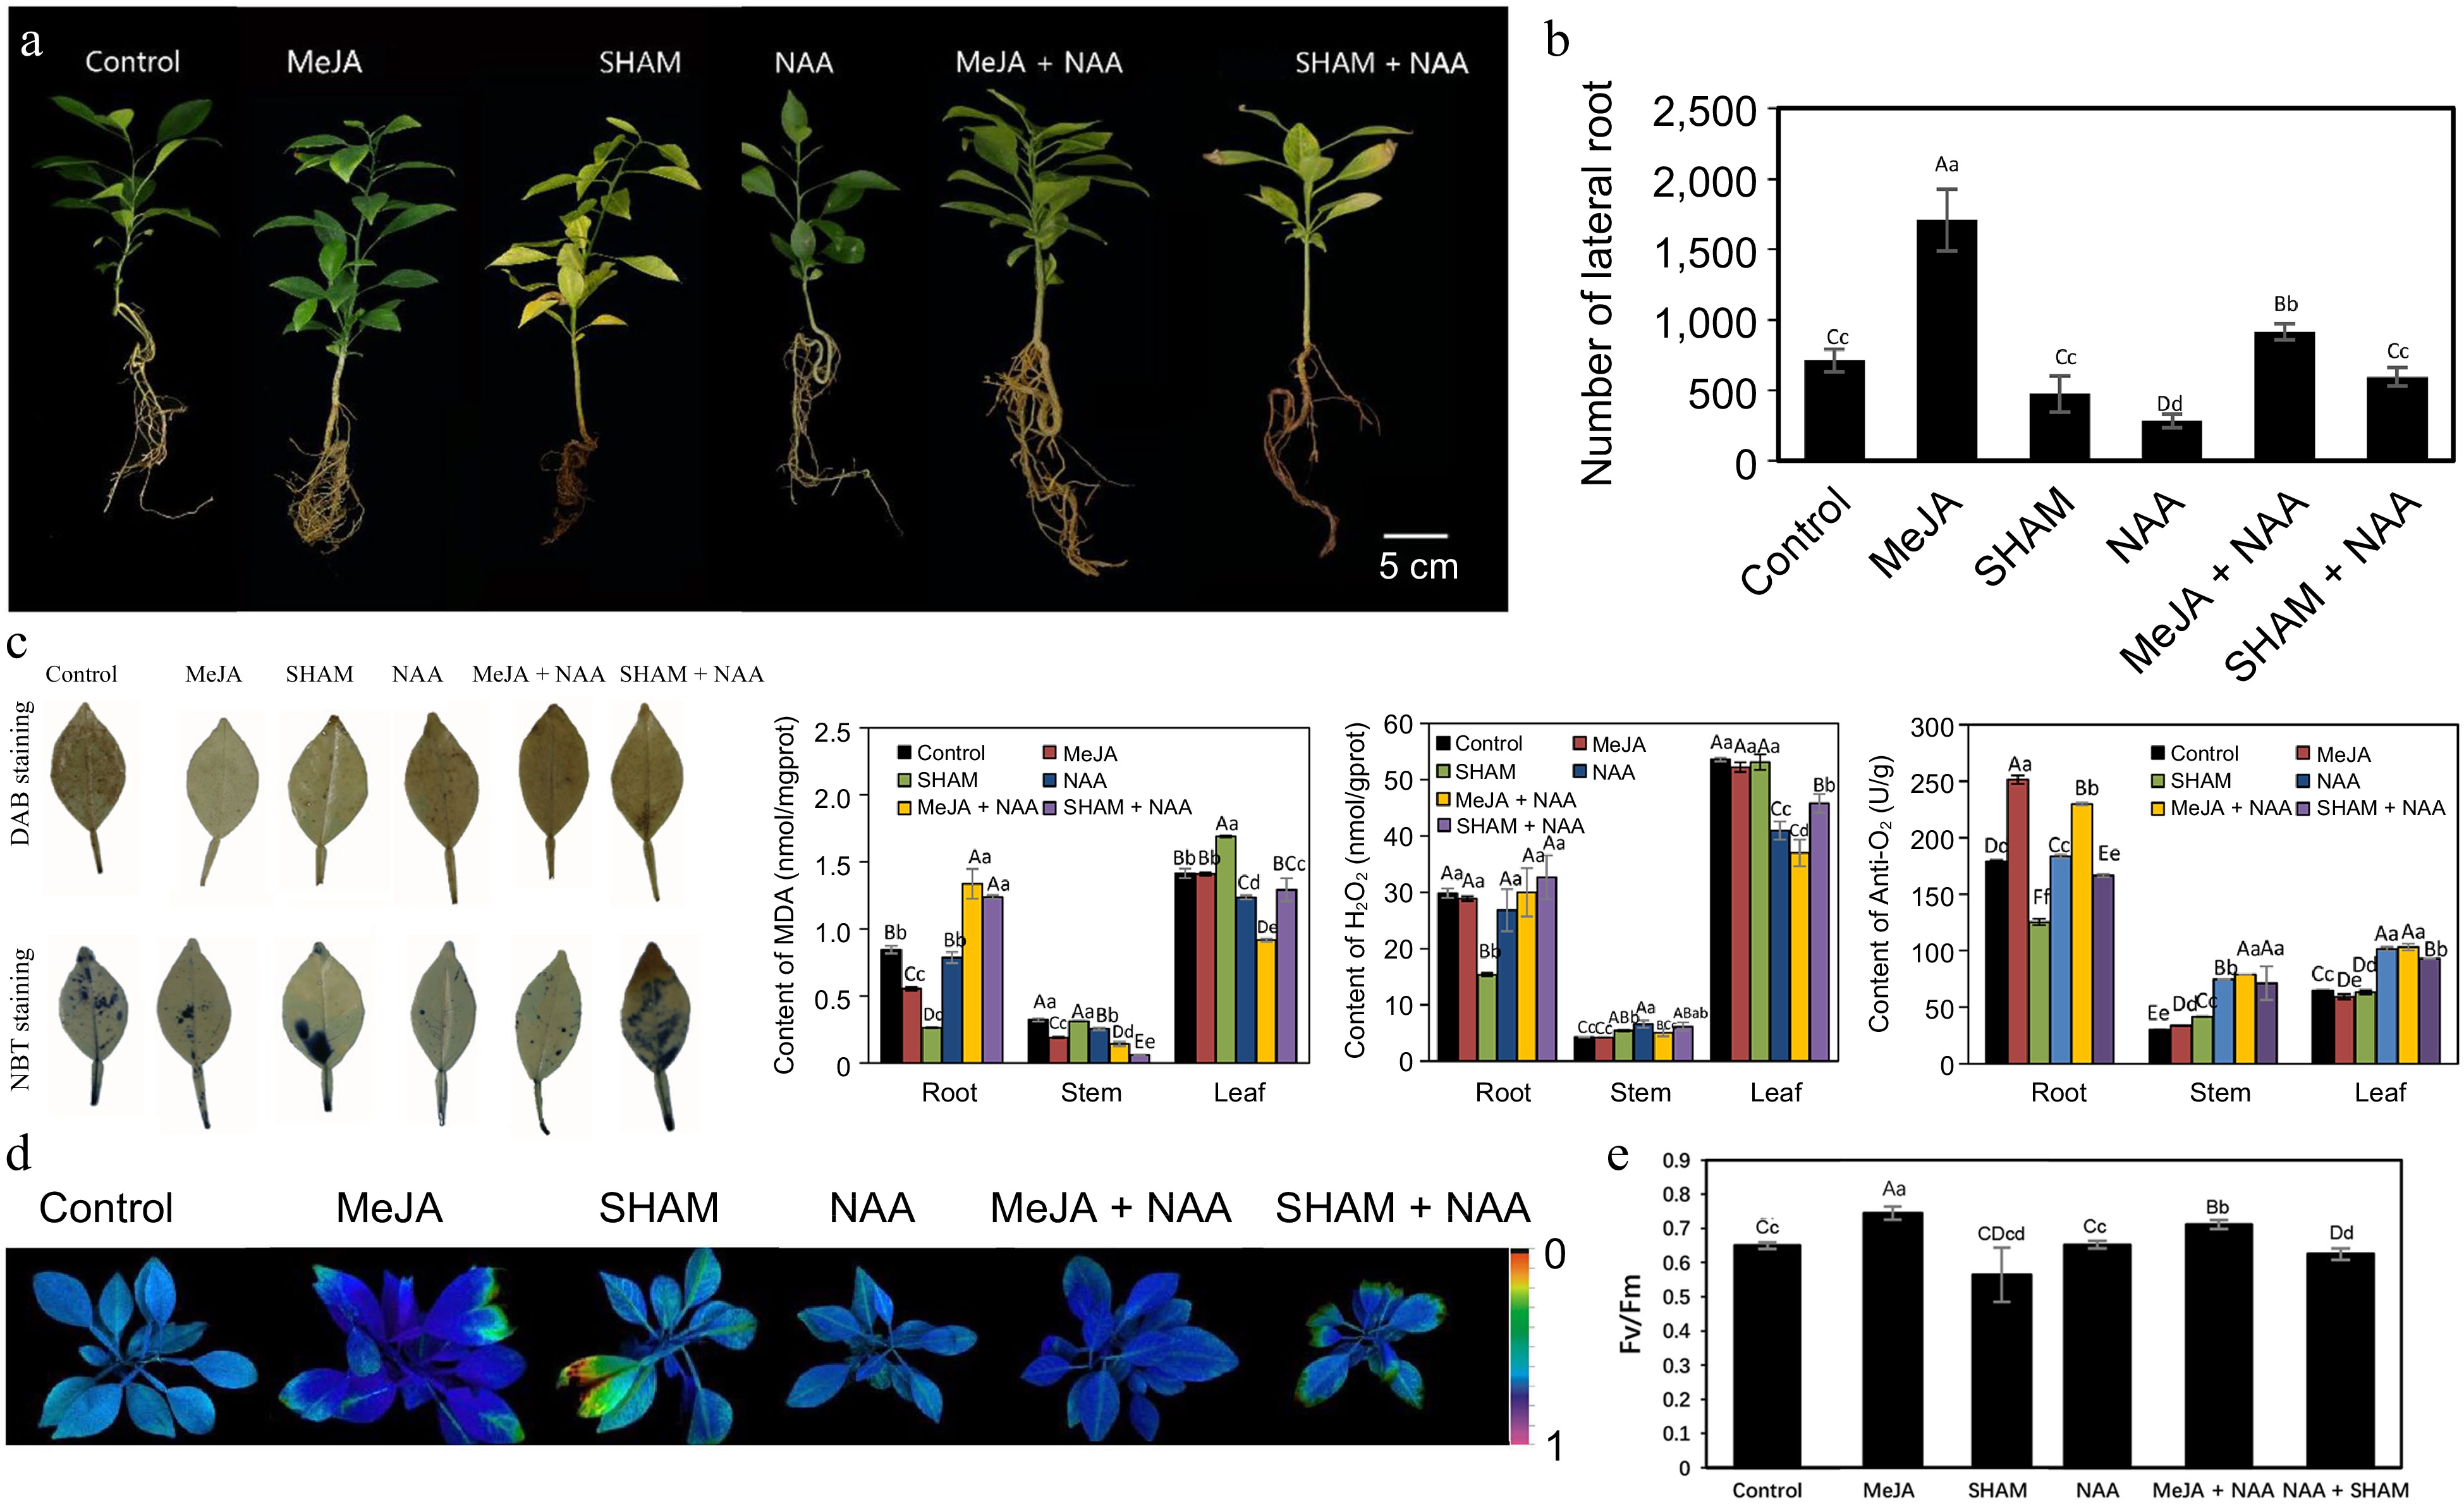
Figure 8.
Exogenous MeJA, SHAM and NAA treatment of Cj seedlings under alkalinity stress. (a) Phenotypes of Cj seedlings; (b) Number of LRs of Cj seedlings; (c) In situ accumulation of H2O2 and anti-O2·– examined by histochemical staining with DAB and NBT in leaf tissue and the contents of MDA, H2O2 and anti-O2·– in the root, stem and leaf tissues; (d) chlorophyll fluorescence imaging; (e) Fv/Fm ratios. Lowercase and capital letters represent statistically significant differences (p < 0.05) and highly statistically significant differences (p < 0.01), respectively. Data were analyzed using one-way ANOVA.
-
Gene ID FPKM log2 Ratio
(Cj + LL_root/Pt + LL_root)Probability Gene name Pt + LL_root Cj + LL_root H+-transporting ATPase Cs6g03490 13.80 6.03 −1.20 0.83 ATPase 4 Cs5g04360 32.35 12.96 −1.32 0.86 ATPase 11 Cs5g08370 0.62 7.44 3.60 0.89 ATPase Cs2g13550 320.97 115.17 −1.48 0.89 F-type H+-transporting ATPase subunit beta Cs7g14520 0.62 4.64 2.90 0.82 V-type H+-transporting ATPase subunit H Cs3g25550 6.75 0.85 −2.99 0.86 V-type H+-transporting ATPase subunit a Cs3g25560 12.03 5.59 −1.11 0.81 V-type H+-transporting ATPase subunit a Aquaporin Cs7g25610 125.66 52.03 −1.27 0.87 Aquaporin PIP 2-1 Cs7g31410 148.77 22.09 −2.75 0.92 Aquaporin PIP 1-1 Cs6g11670 10.04 1.80 −2.48 0.87 Aquaporin PIP 2-2 Cs6g11700 14.95 5.82 −1.36 0.84 Aquaporin PIP2-1 Cs5g08710 15.09 2.82 −2.42 0.89 Aquaporin TIP2-2 Cs7g28650 447.95 51.70 −3.12 0.93 Aquaporin TIP1-1 Cs8g17900 11.52 2.95 −1.97 0.86 Aquaporin TIP1-3 Cs2g04370 4.28 20.43 2.25 0.89 Aquaporin NIP1-2 JA biosynthesis and signal transduction Cs9g05210 15.71 133.92 3.09 0.93 PKT Cs5g17880 24.23 52.72 1.12 0.86 OPR2 Cs5g17920 38.68 125.16 1.69 0.90 OPR2 Cs6g08630 13.04 48.65 1.90 0.90 ACX Cs1g17380 43.12 90.51 1.07 0.86 LOX3 orange1.1t03773 37.65 113.44 1.59 0.89 LOX2 orange1.1t04376 21.70 114.64 2.40 0.92 LOX2 orange1.1t00464 22.53 46.72 1.05 0.85 JAR1 Cs1g17210 153.01 442.86 1.53 0.89 JAZ Cs1g17220 70.18 182.71 1.38 0.88 JAZ Cs7g02820 232.46 521.60 1.17 0.87 JAZ10 Cs7g31600 31.27 17.16 −0.87 0.81 COI1 ABA biosynthesis and signal transduction Cs1g22620 6.40 32.66 2.35 0.91 ABA1 Cs6g14030 7.37 20.57 1.48 0.86 ABA2 Cs6g19380 55.00 495.16 3.17 0.94 ABA 8'-hydroxylase Cs8g19140 13.73 5.495 −1.32 0.84 HAI2 Cs9g18020 5.29 12.54 1.25 0.824 PP2C orange1.1t00478 136.22 36.88 −1.89 0.904 PYL9 orange1.1t01026 62.78 21.28 −1.56 0.894 PYR1 Cs1g19380 37.87 14.395 −1.40 0.87 SnRK2.5 Cs4g05990 0.01 2.12 7.73 0.807 SnRK2 Cs1g19910 11.745 32.3 1.46 0.87 SnRK2 Auxin signal transduction Cs4g04520 12.71 29.77 1.23 0.86 ARF7 Cs4g07020 33.15 14.08 −1.24 0.86 ARF19 Cs3g25860 27.15 11.37 −1.26 0.86 ARF5 Cs2g05440 5.55 1.43 −1.964 0.80 ARF3 Cs1g13960 18.25 67.95 1.90 0.90 IAA15 Cs9g08100 18.66 58.73 1.65 0.89 IAA22B Cs4g18240 8.77 51.10 2.54 0.91 IAA29 Cs6g07990 47.99 19.56 −1.29 0.87 AUX1 Cs1g22140 1.24 6.17 2.32 0.84 GH3.1 Cs5g32030 9.90 27.82 1.49 0.87 GH3.6 Cs4g12720 43.54 17.55 −1.31 0.87 SAUR72 Cs7g03030 29.78 13.75 −1.11 0.85 SAUR orange1.1t02550 20.21 52.50 1.38 0.87 SAUR Cs5g32500 14.39 6.51 −1.14 0.82 TIR1 Cytokinin signal transduction Cs5g32140 39.75 16.12 −1.30 0.87 AHP orange1.1t01850 60.92 15.39 −1.98 0.90 ARR-A Cs7g07940 56.70 13.82 −2.04 0.91 ARR-A Cs9g02760 16.87 6.64 −1.35 0.85 ARR-B Cs7g06180 20.05 9.22 −1.12 0.84 ARR-B Cs2g19760 10.39 3.45 −1.59 0.84 CRE1 Phenylpropanoid biosynthesis (lignin biosynthesis) orange1.1t02755 199.89 75.86 −1.40 0.88 CCR1 Cs7g24940 32.08 81.54 1.35 0.88 PAL4 Cs6g11940 263.56 143.15 −0.88 0.83 PAL1 Cs8g15880 16.64 5.42 −1.62 0.87 4CL orange1.1t02041 308.63 637.33 1.05 0.86 Peroxidase 15 Cs2g28110 42.09 14.10 −1.58 0.89 Peroxidase 4 orange1.1t02947 4.355 74.87 4.10 0.96 OMT1 orange1.1t03686 70.36 7.03 −3.32 0.94 OMT1 Cs1g12660 19.94 94.94 2.25 0.91 CCOAMT Cs1g22450 74.54 34.48 −1.11 0.86 CCOAMT Vitamin E biosynthesis Cs7g17560 7.80 16.06 1.04 0.82 PDS1 Cs7g15250 36.25 9.42 −1.94 0.89 G-TMT Cs9g17840 1.89 9.44 2.32 0.87 HPT1 Cs3g03920 10.38 2.98 −1.80 0.85 HPT1 Cs9g19520 1.67 18.18 3.45 0.92 HPT1 orange1.1t05352 0.71 12.25 4.11 0.93 HPT1 Glutathione metabolism Cs5g32800 416.34 1032.87 1.31 0.88 GST Cs1g02370 22.36 7.25 −1.62 0.88 GGT Cs5g03830 169.05 659.59 1.96 0.90 GPX Cs6g19310 94.55 217.63 1.20 0.87 G6PD orange1.1t02665 34.83 13.39 −1.38 0.87 GR Table 1.
A list of some of the important differentially expressed genes in the root tissue between Cj + LL and Pt + LL.
-
Gene ID Stem (FPKM) Leaf (FPKM) Gene
namePt + LL
_stemCj + LL
_stemlog2 Ratio
(Cj + LL_stem /
Pt + LL_stem)Probability Pt + LL
_leafCj + LL
_ leaflog2 Ratio
(Cj + LL_leaf /
Pt + LL_leaf)Probability Phenylpropanoid biosynthesis Cs1g11780 24.56 56.53 1.20 0.87 22.36 74.58 1.74 0.90 HCT Cs4g01930 − − − − 7.52 16.54 1.14 0.80 HCT Cs1g12660 − − − − 20.34 62.34 1.62 0.89 CCoAOMT Cs6g11940 − − − − 72.42 157.96 1.13 0.87 PAL Cs6g20950 8.00 0.12 −6.06 0.90 14.82 0.08 −7.53 0.96 OMT1 orange1.1t05218 6.39 24.56 1.94 0.88 − − − − OMT1 orange1.1t05354 28.11 8.83 −1.67 0.88 − − − − OMT1 Cs8g04970 27.45 9.07 −1.60 0.87 − − − − CAD orange1.1t02036 2.87 10.97 1.94 0.83 − − − − Peroxidase15 orange1.1t02041 − − − − 2.61 14.31 2.45 0.87 Peroxidase15 orange1.1t02044 − − − − 16.26 43.46 1.42 0.87 Peroxidase15 alpha-Linolenic acid metabolism Cs1g17380 15.07 45.38 1.59 0.89 − − − − LOX3 Cs2g21000 − − − − 29.49 95.15 1.69 0.90 HPL1 orange1.1t04376 26.92 11.80 −1.19 0.84 15.35 35.87 1.22 0.85 LOX2 ABA biosynthesis Cs5g14370 13.58 35.27 1.38 0.87 − − − − NCED1 Cs8g18780 − − − − 18.07 47.40 1.39 0.87 ABA 8'-hydroxylase Cs8g05940 − − − − 1.80 9.71 2.43 0.84 ABA 8'-hydroxylase Cs6g19380 − − − − 43.57 4.88 −3.16 0.93 ABA 8'-hydroxylase Plant hormone signal transduction Cs1g15830 − − − − 32.49 14.61 −1.15 0.84 IAA26 Cs1g13960 − − − − 37.59 97.30 1.37 0.88 IAA15 Cs2g17860 − − − − 6.21 16.41 1.40 0.83 CRE1 Cs3g23120 − − − − 16.03 34.30 1.10 0.84 Cyclin D3 orange1.1t01850 − − − − 13.81 46.12 1.74 0.89 ARR-A Cs5g04810 − − − − 8.04 32.93 2.03 0.89 ARR5 Cs4g15360 − − − − 6.98 17.24 1.31 0.82 PP2C Table 2.
List of some of the important differentially expressed genes in the stem and leaf tissues between Cj + LL and Pt + LL.
Figures
(7)
Tables
(2)