-
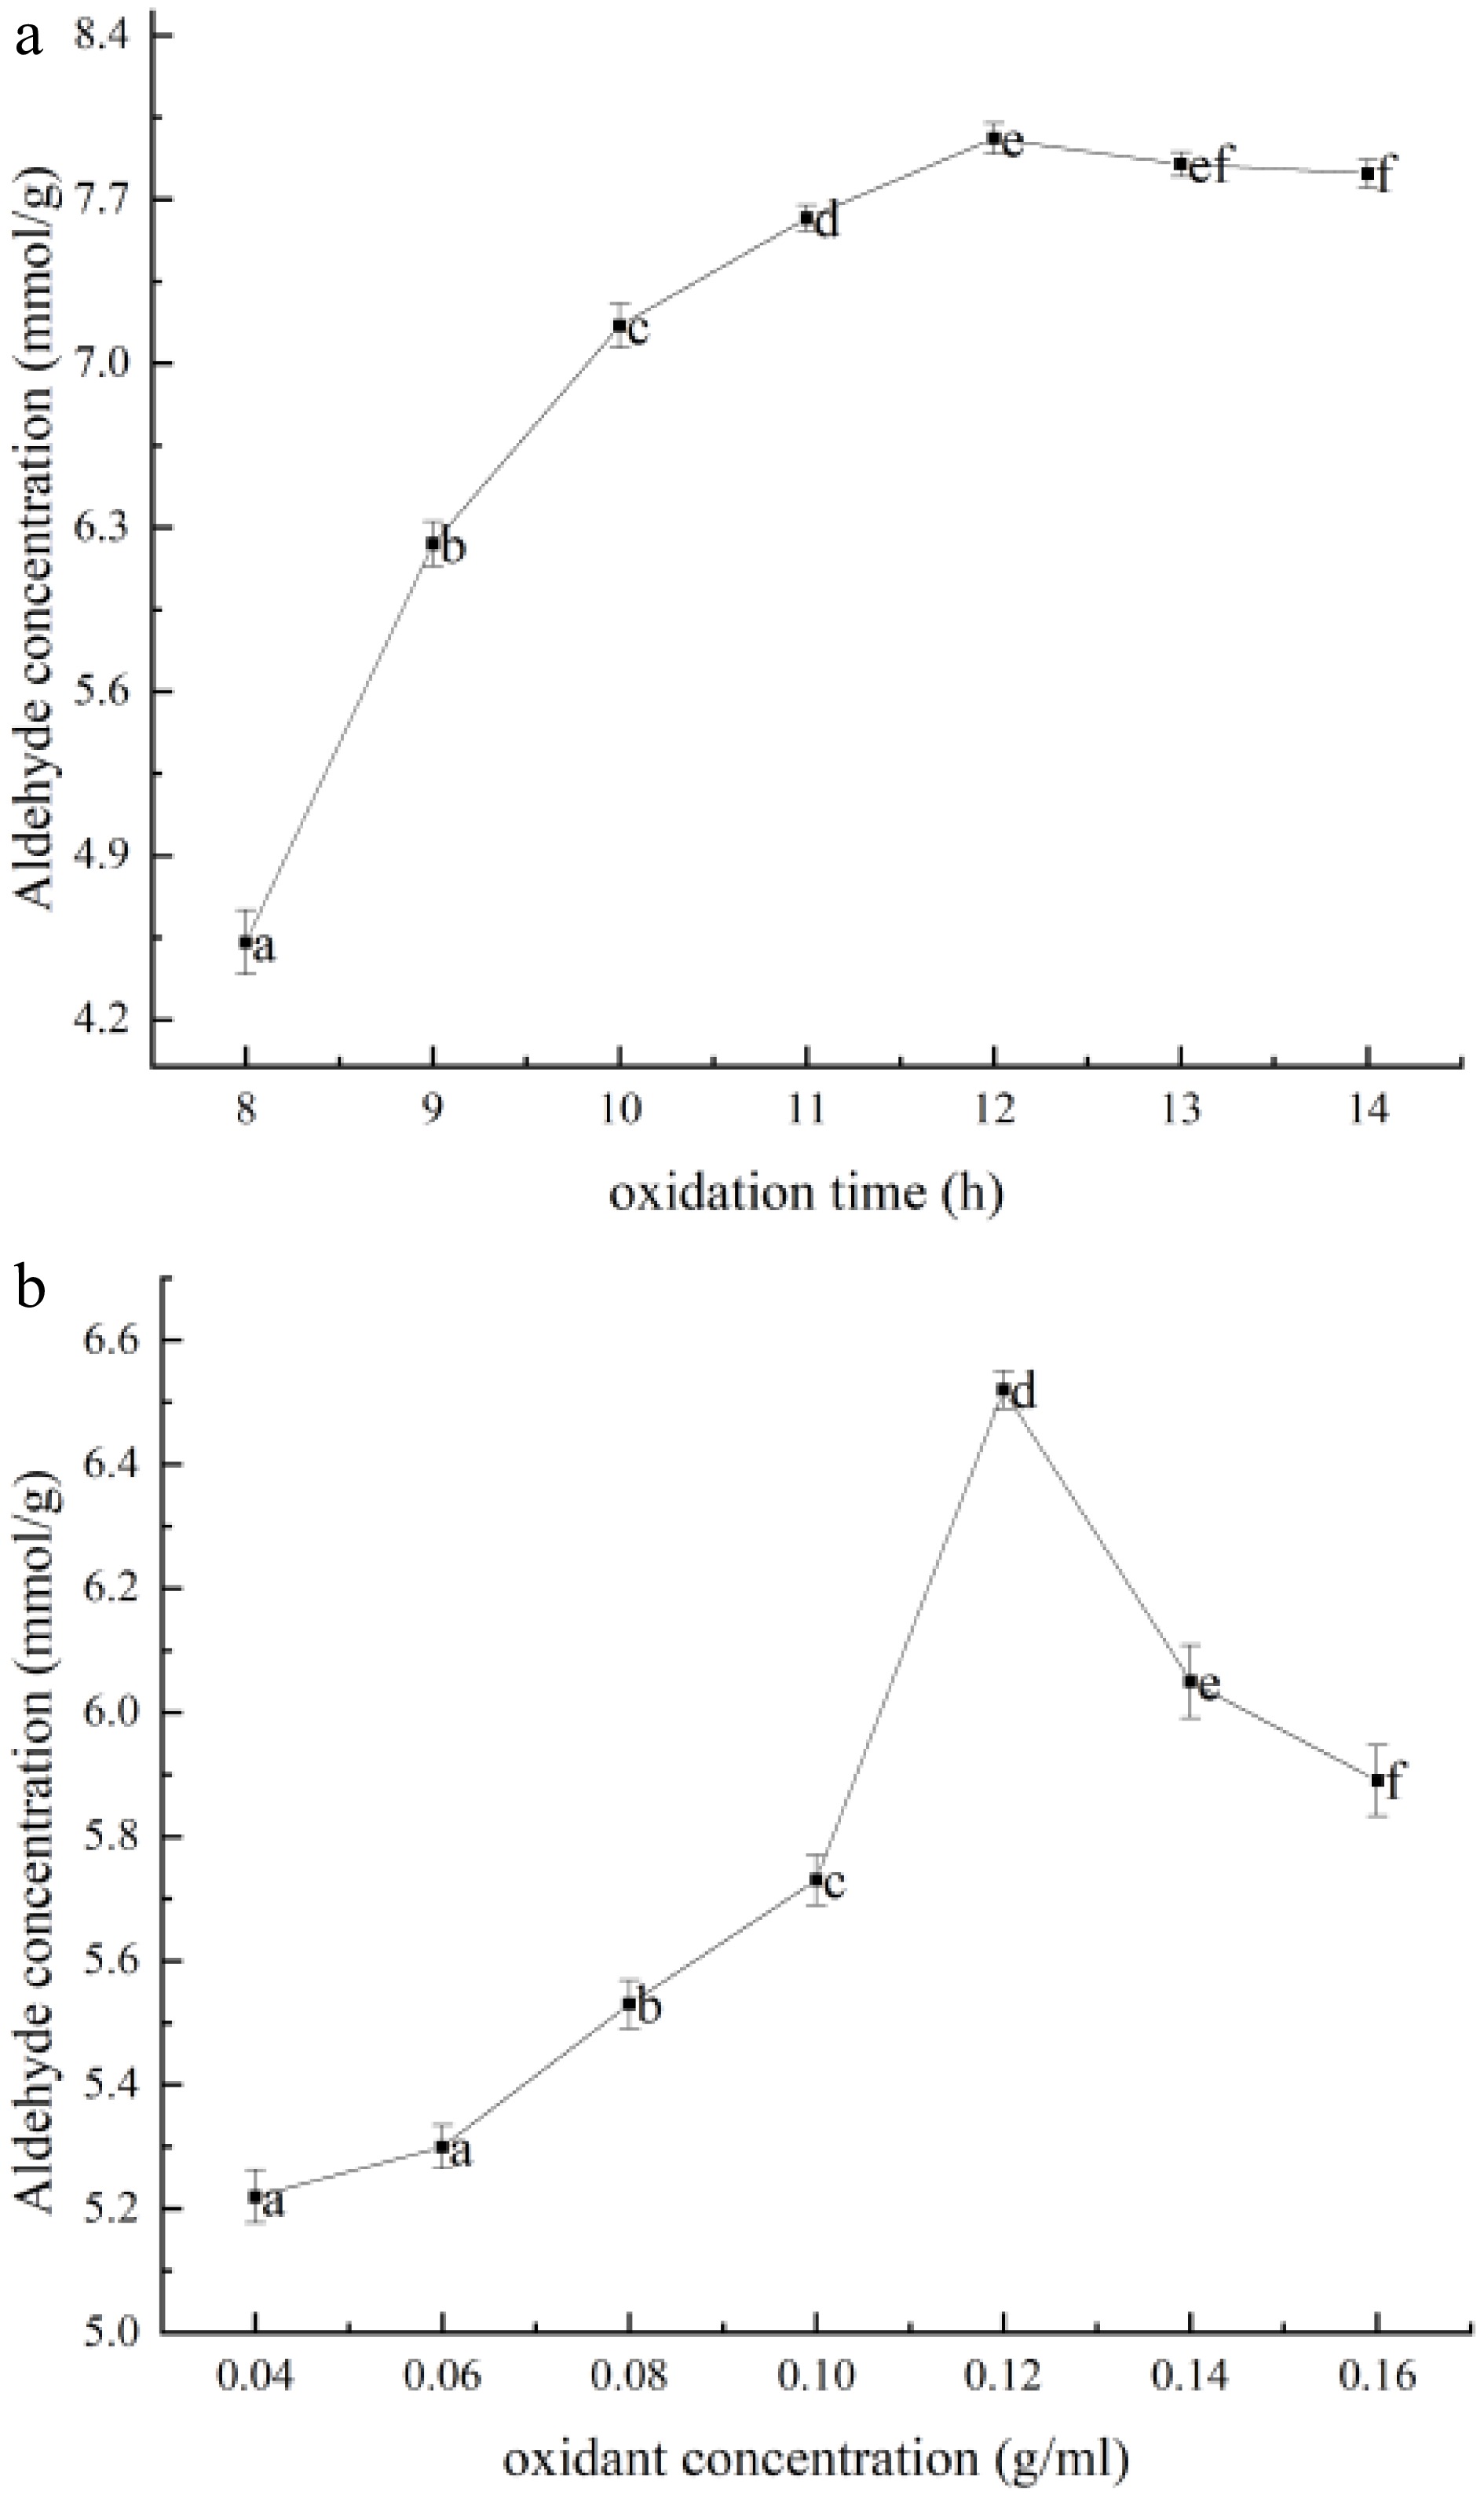
Figure 1.
Aldehyde content of OKGM prepared under different (a) oxidation times and (b) oxidant concentrations. The data in this figure is expressed as mean ± SD, different letters in this curve indicate significant differences (p < 0.05).
-
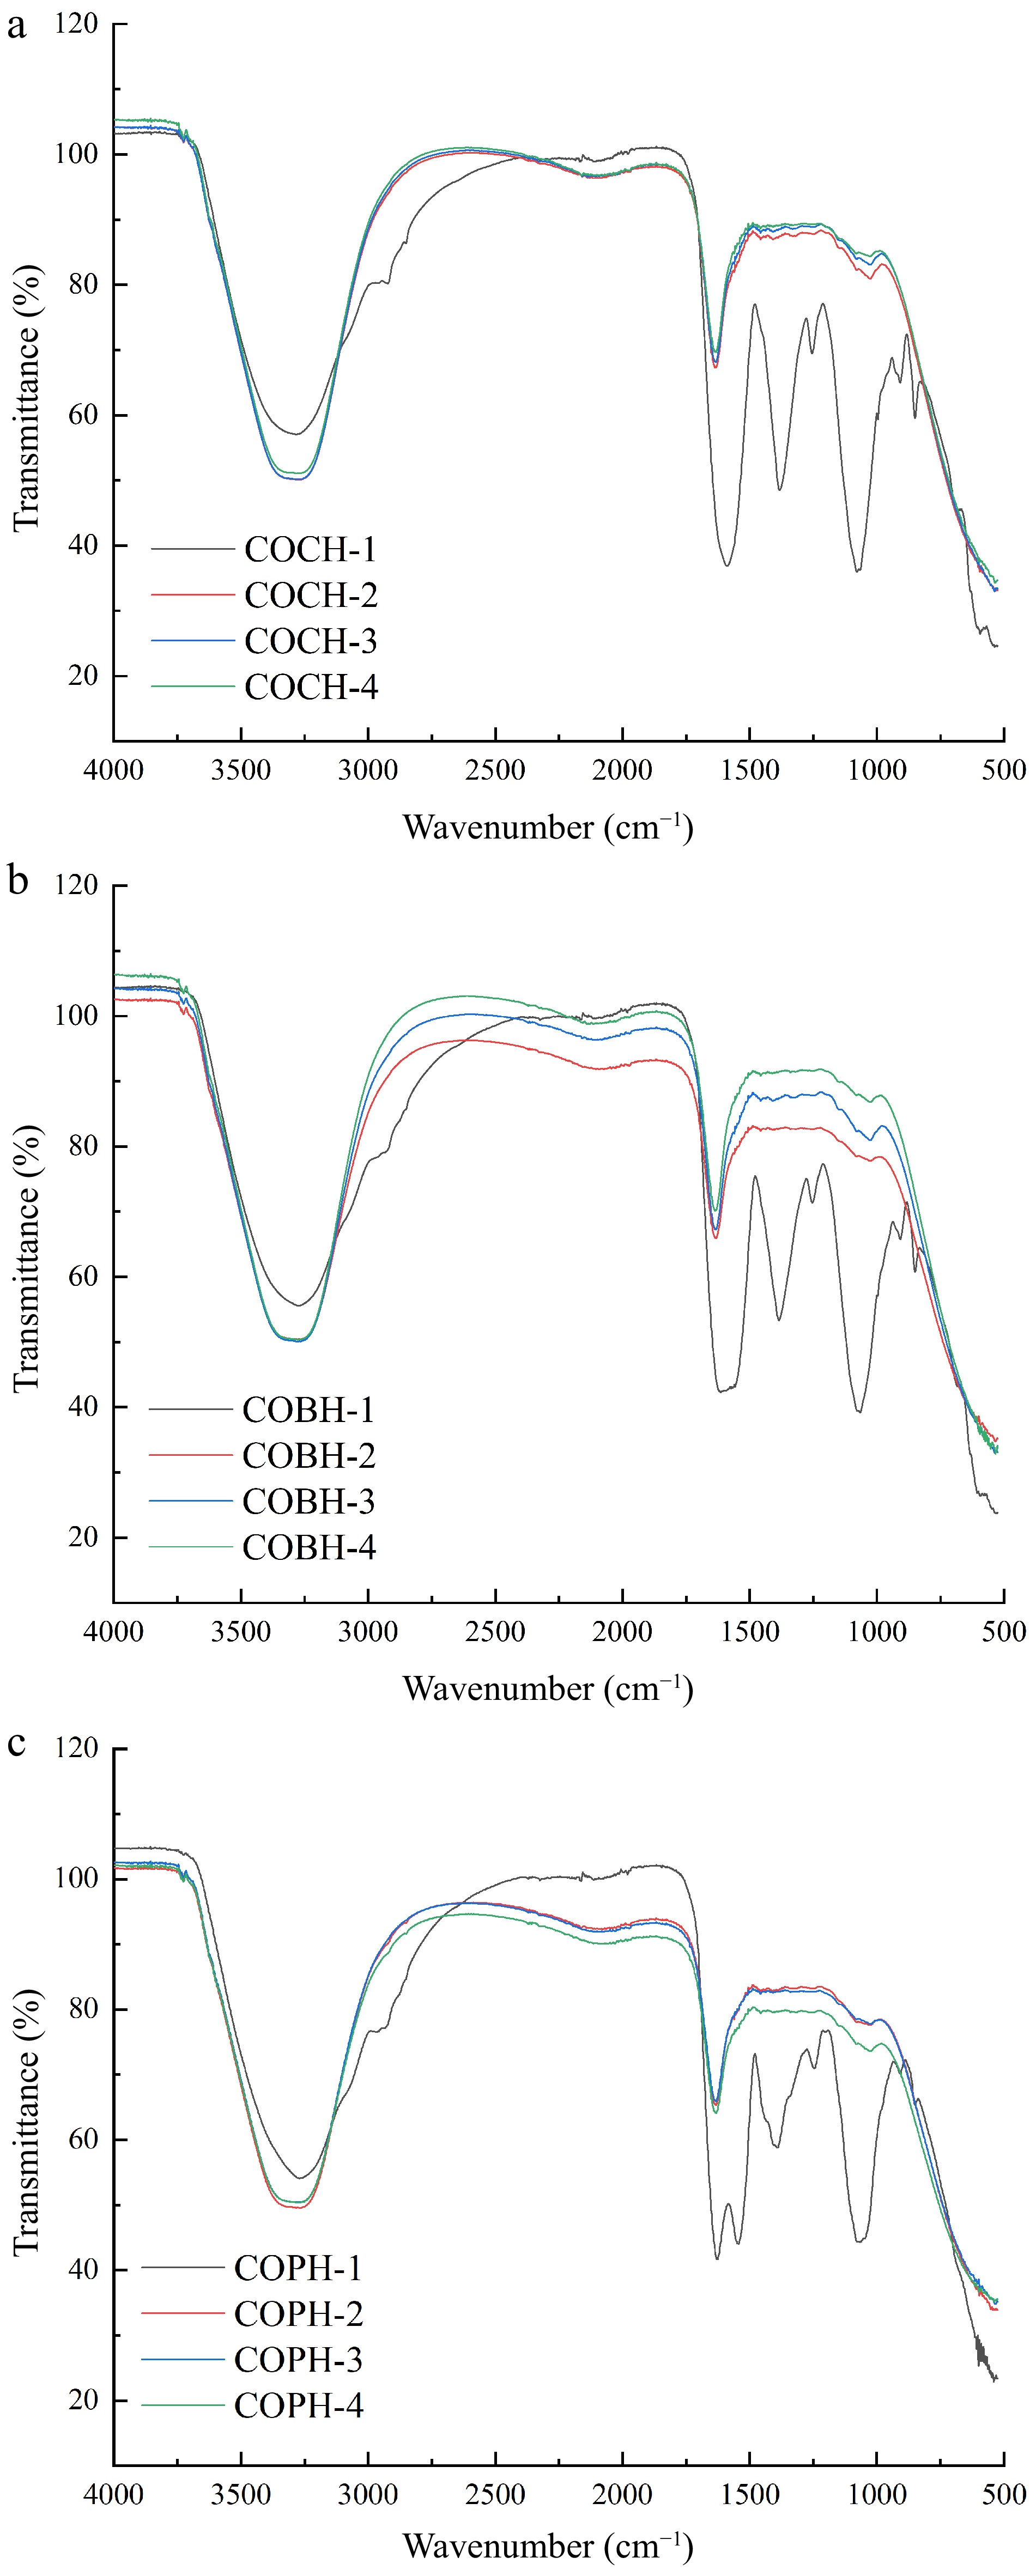
Figure 2.
Infrared spectra of (a) COCH, (b) COBH and (c) COPH with different mixing ratios.
-
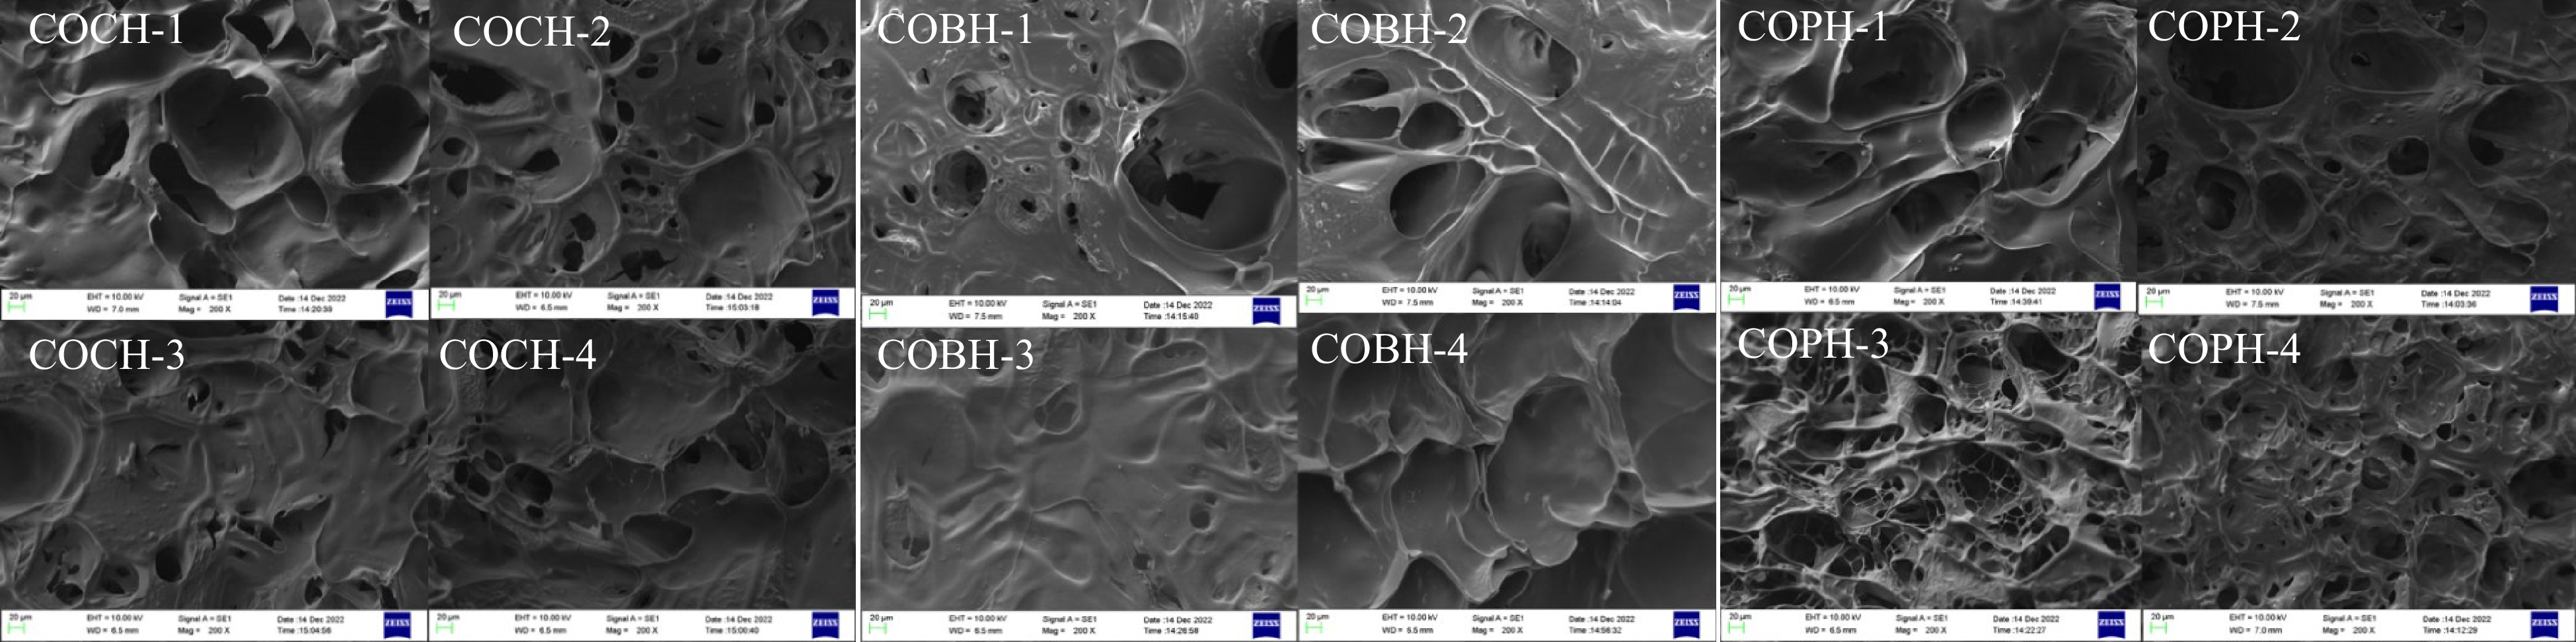
Figure 3.
Microstructure of COCH, COBH and COPH with different mixing ratios.
-
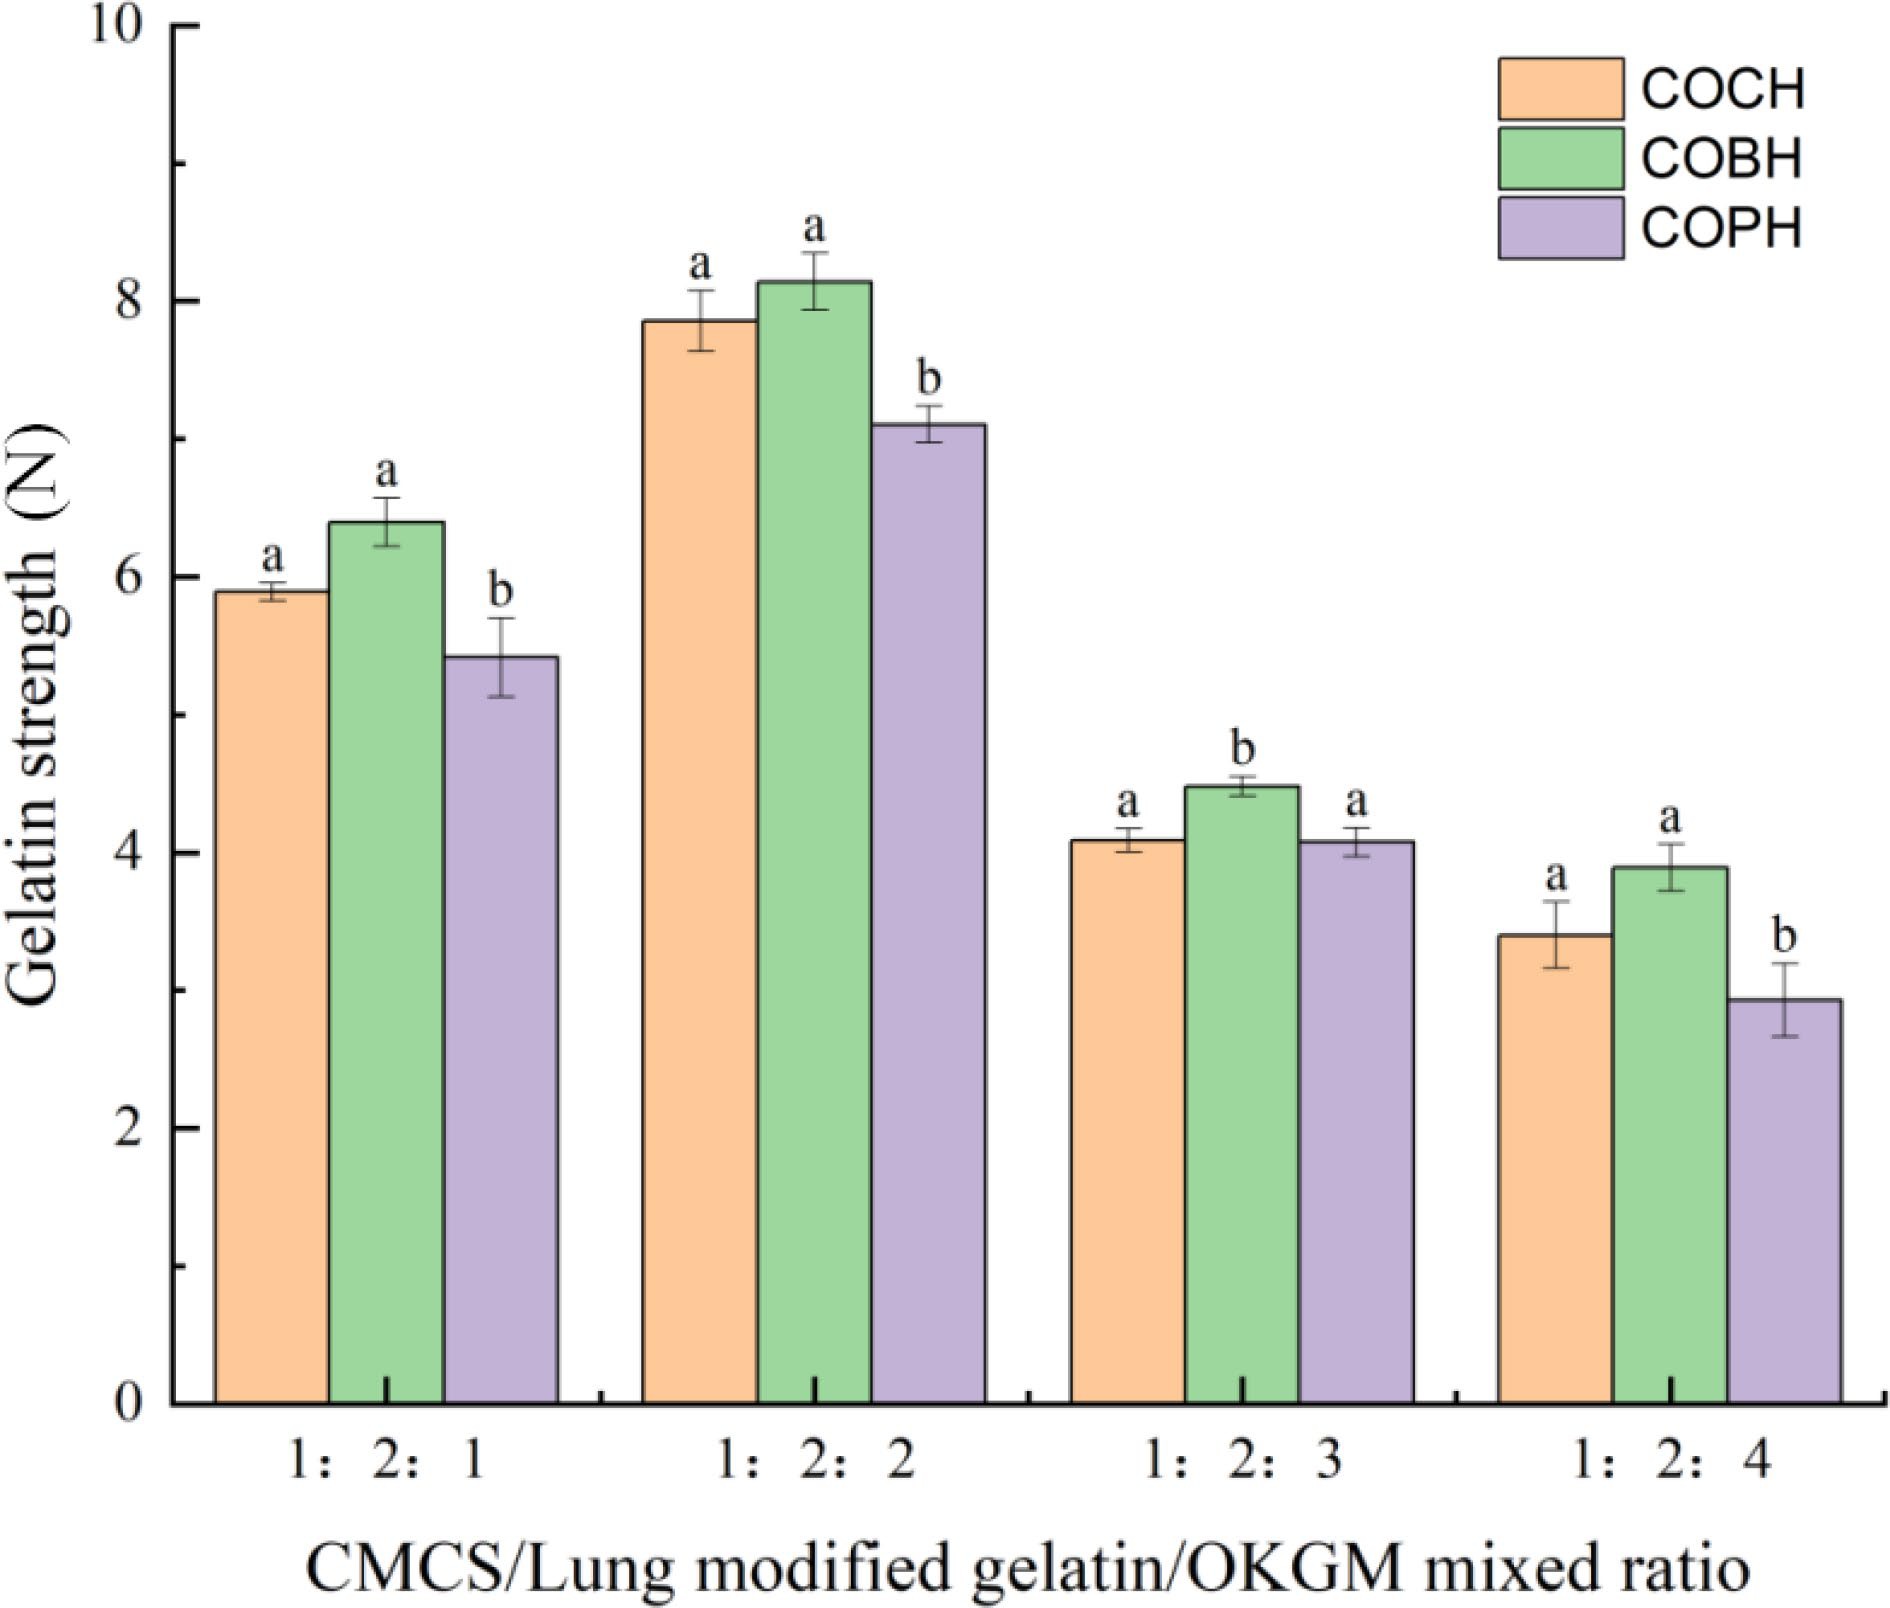
Figure 4.
Gelatin strength of COCH, COBH and COPH with different mixing ratios. The data in this figure is expressed as mean ± SD, different letters in the same material indicates significant differences (p < 0.05).
-
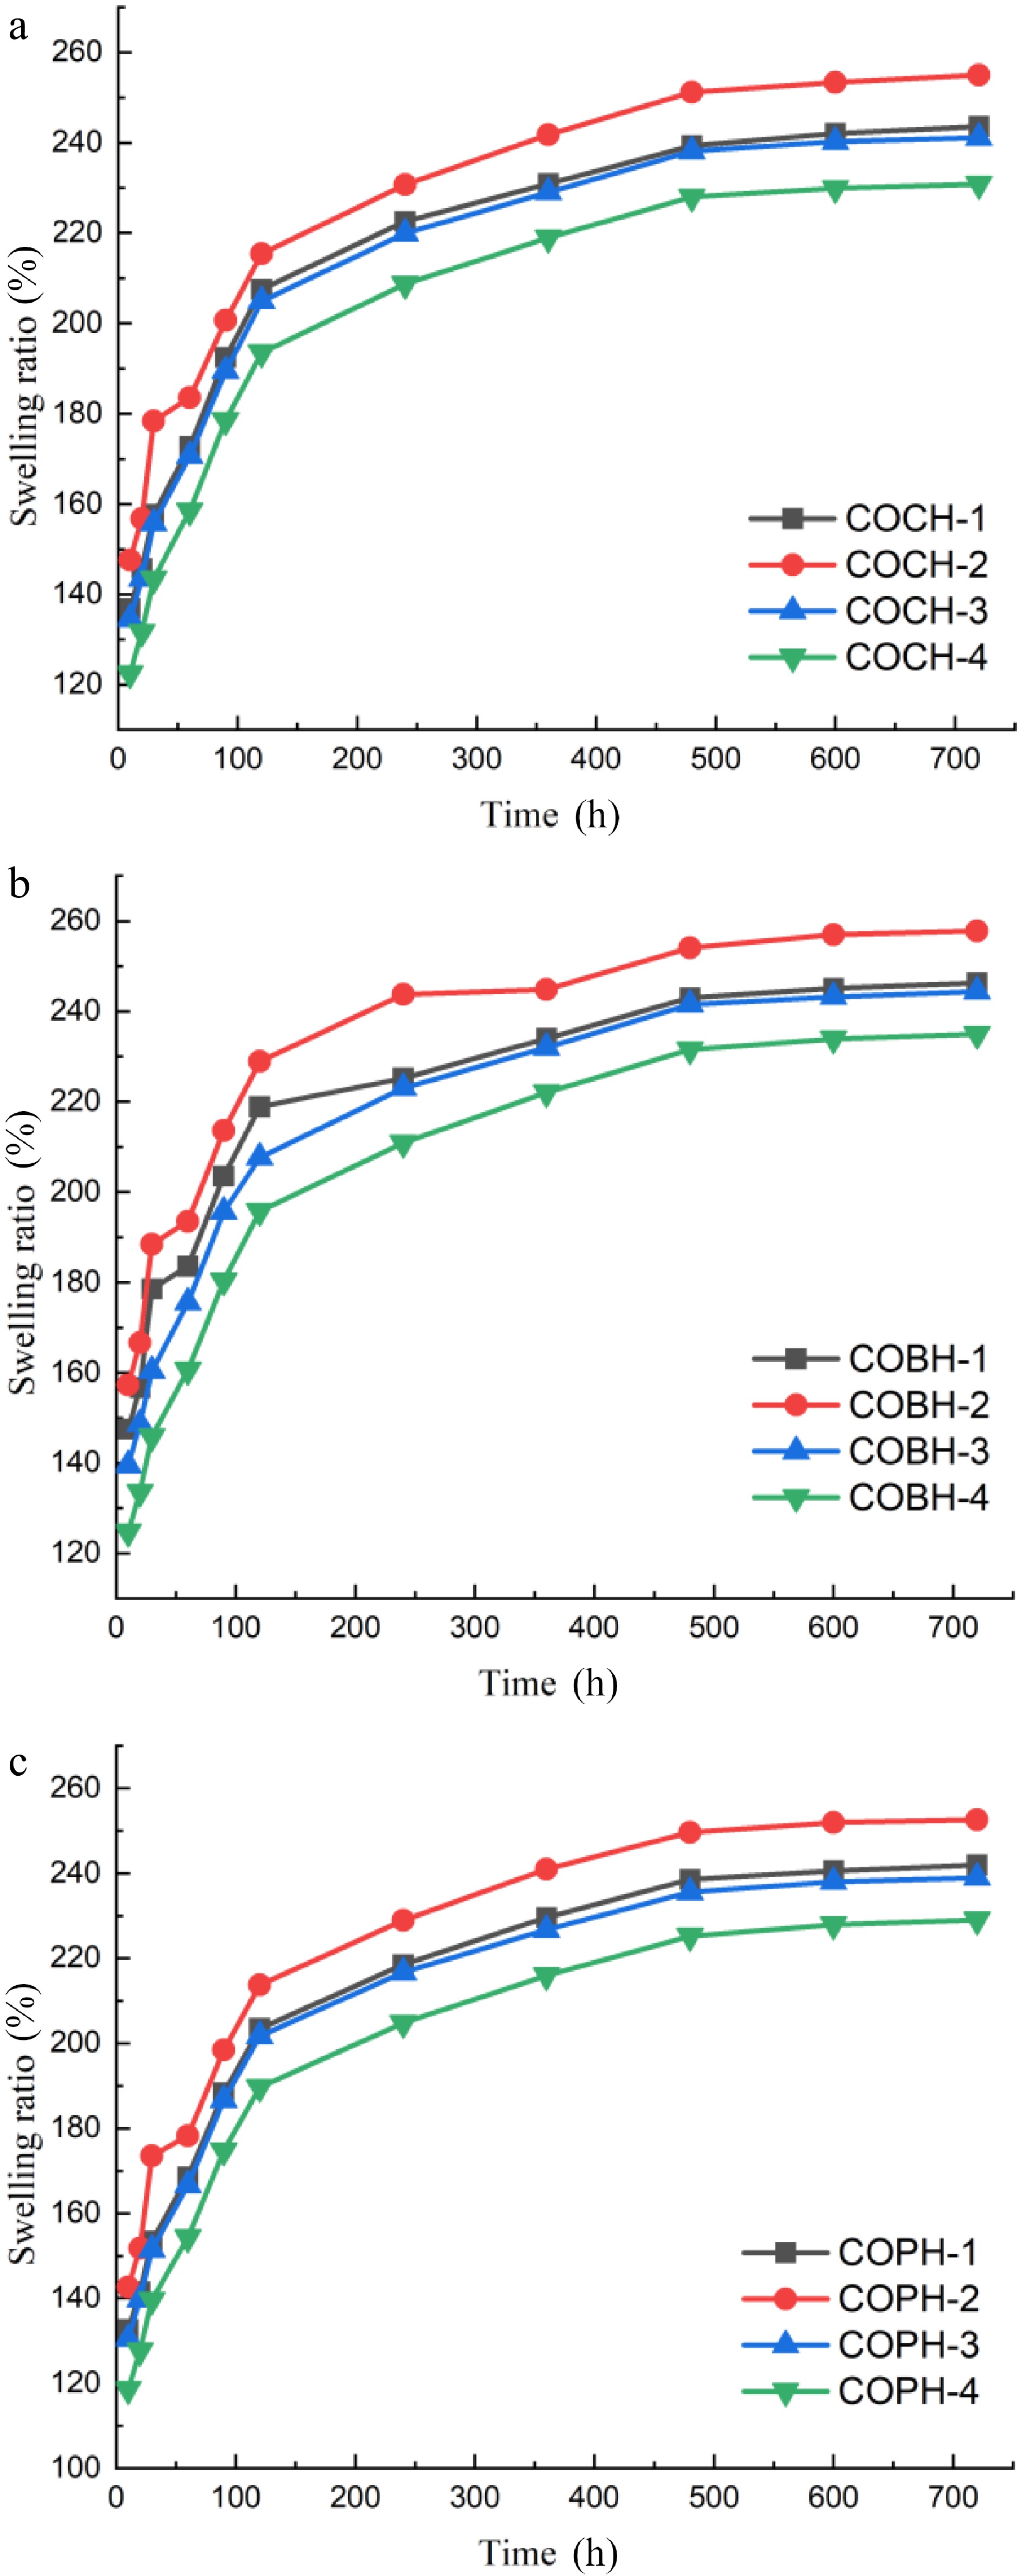
Figure 5.
Swelling rate of (a) COCH, (b) COBH, and (c) COPH with different mixing ratios.
-
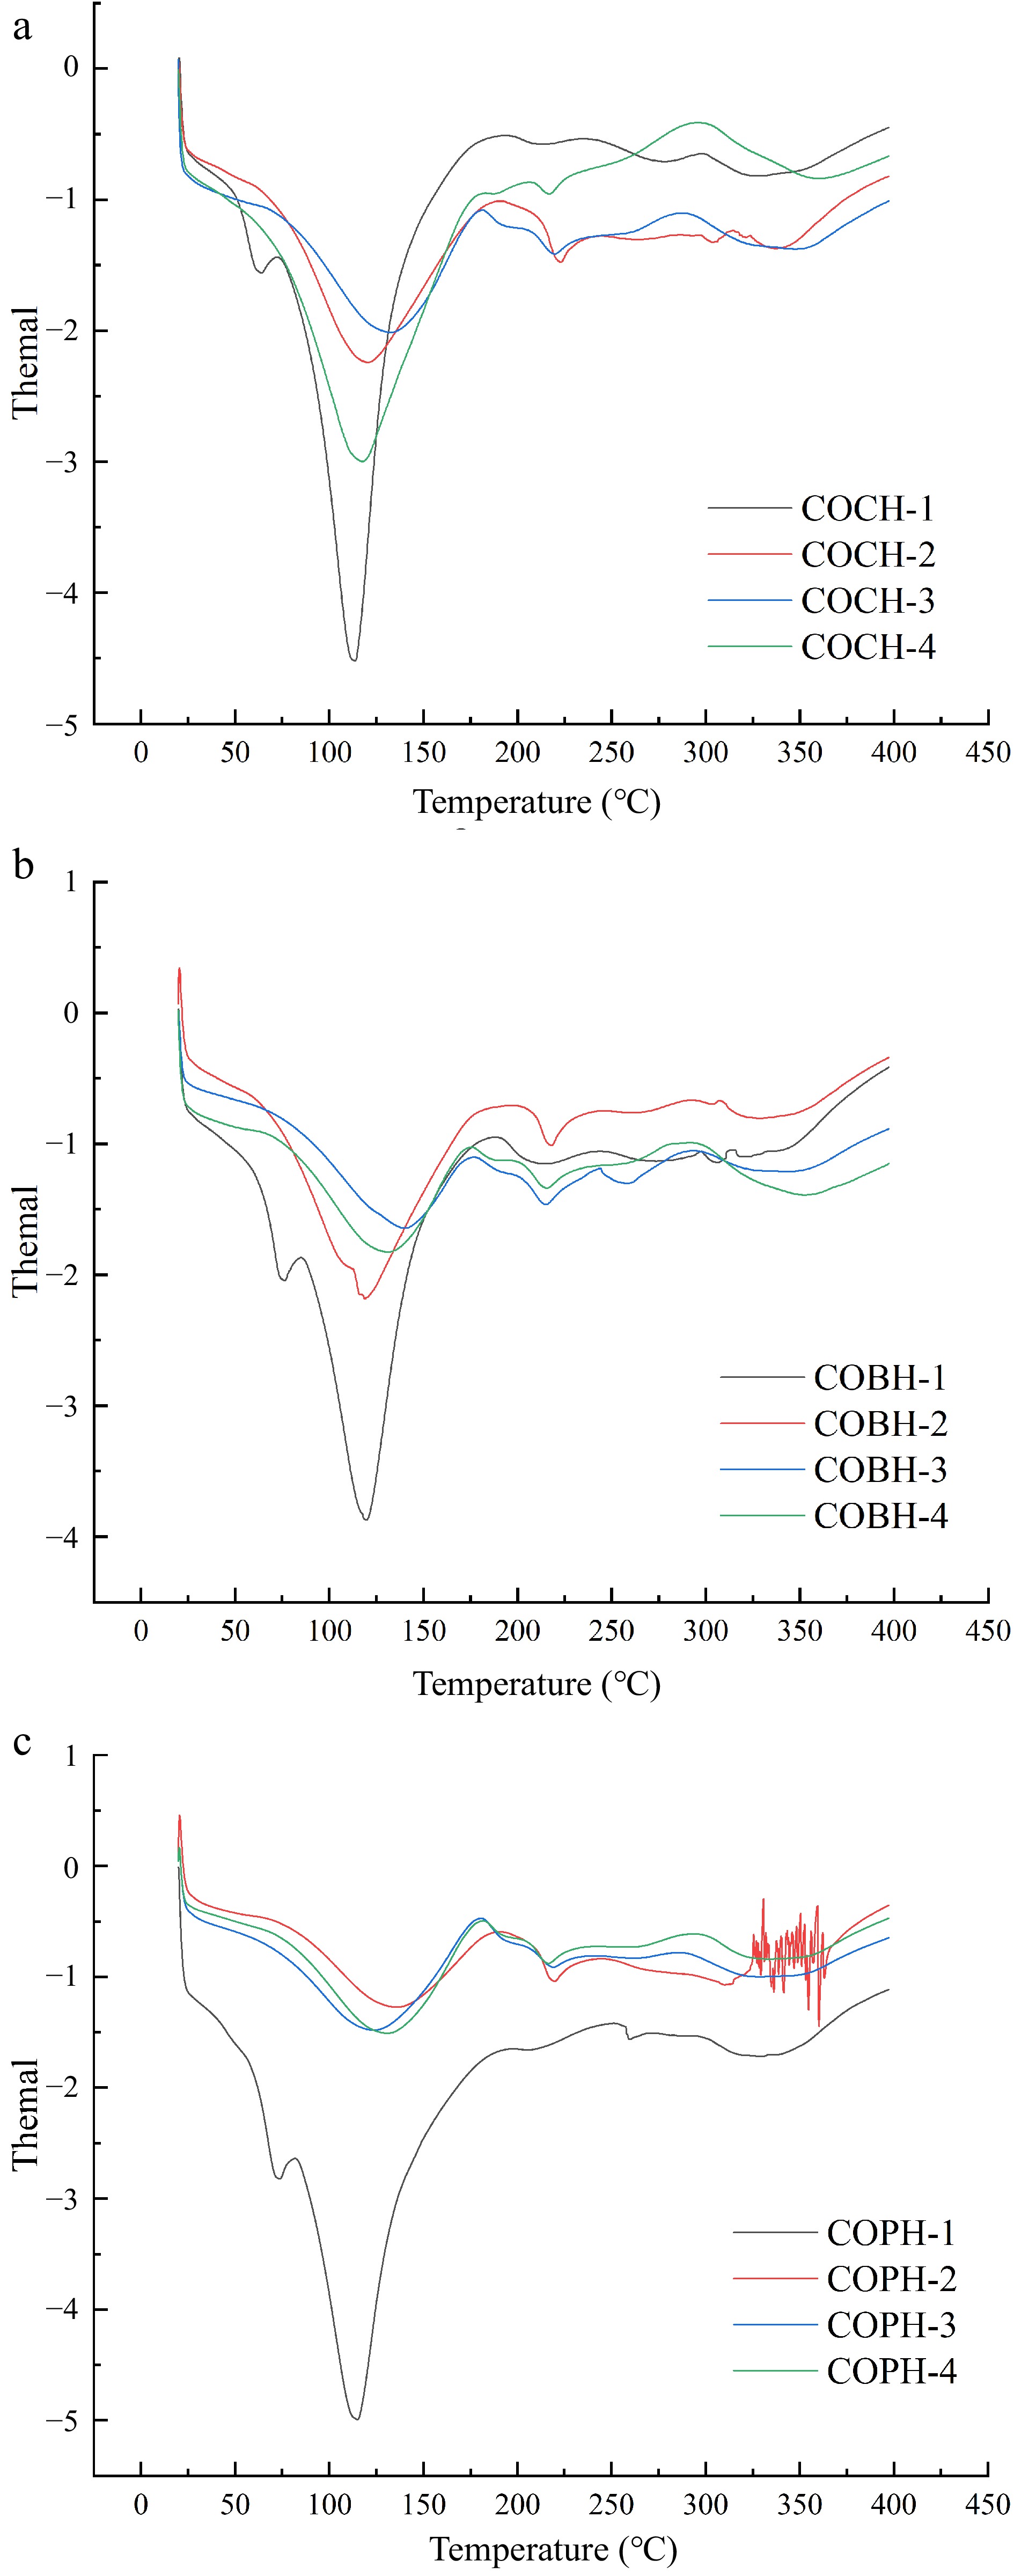
Figure 6.
Thermogravimetric analysis of (a) COCH, (b) COBH, and (c) COPH with different mixing ratios.
-
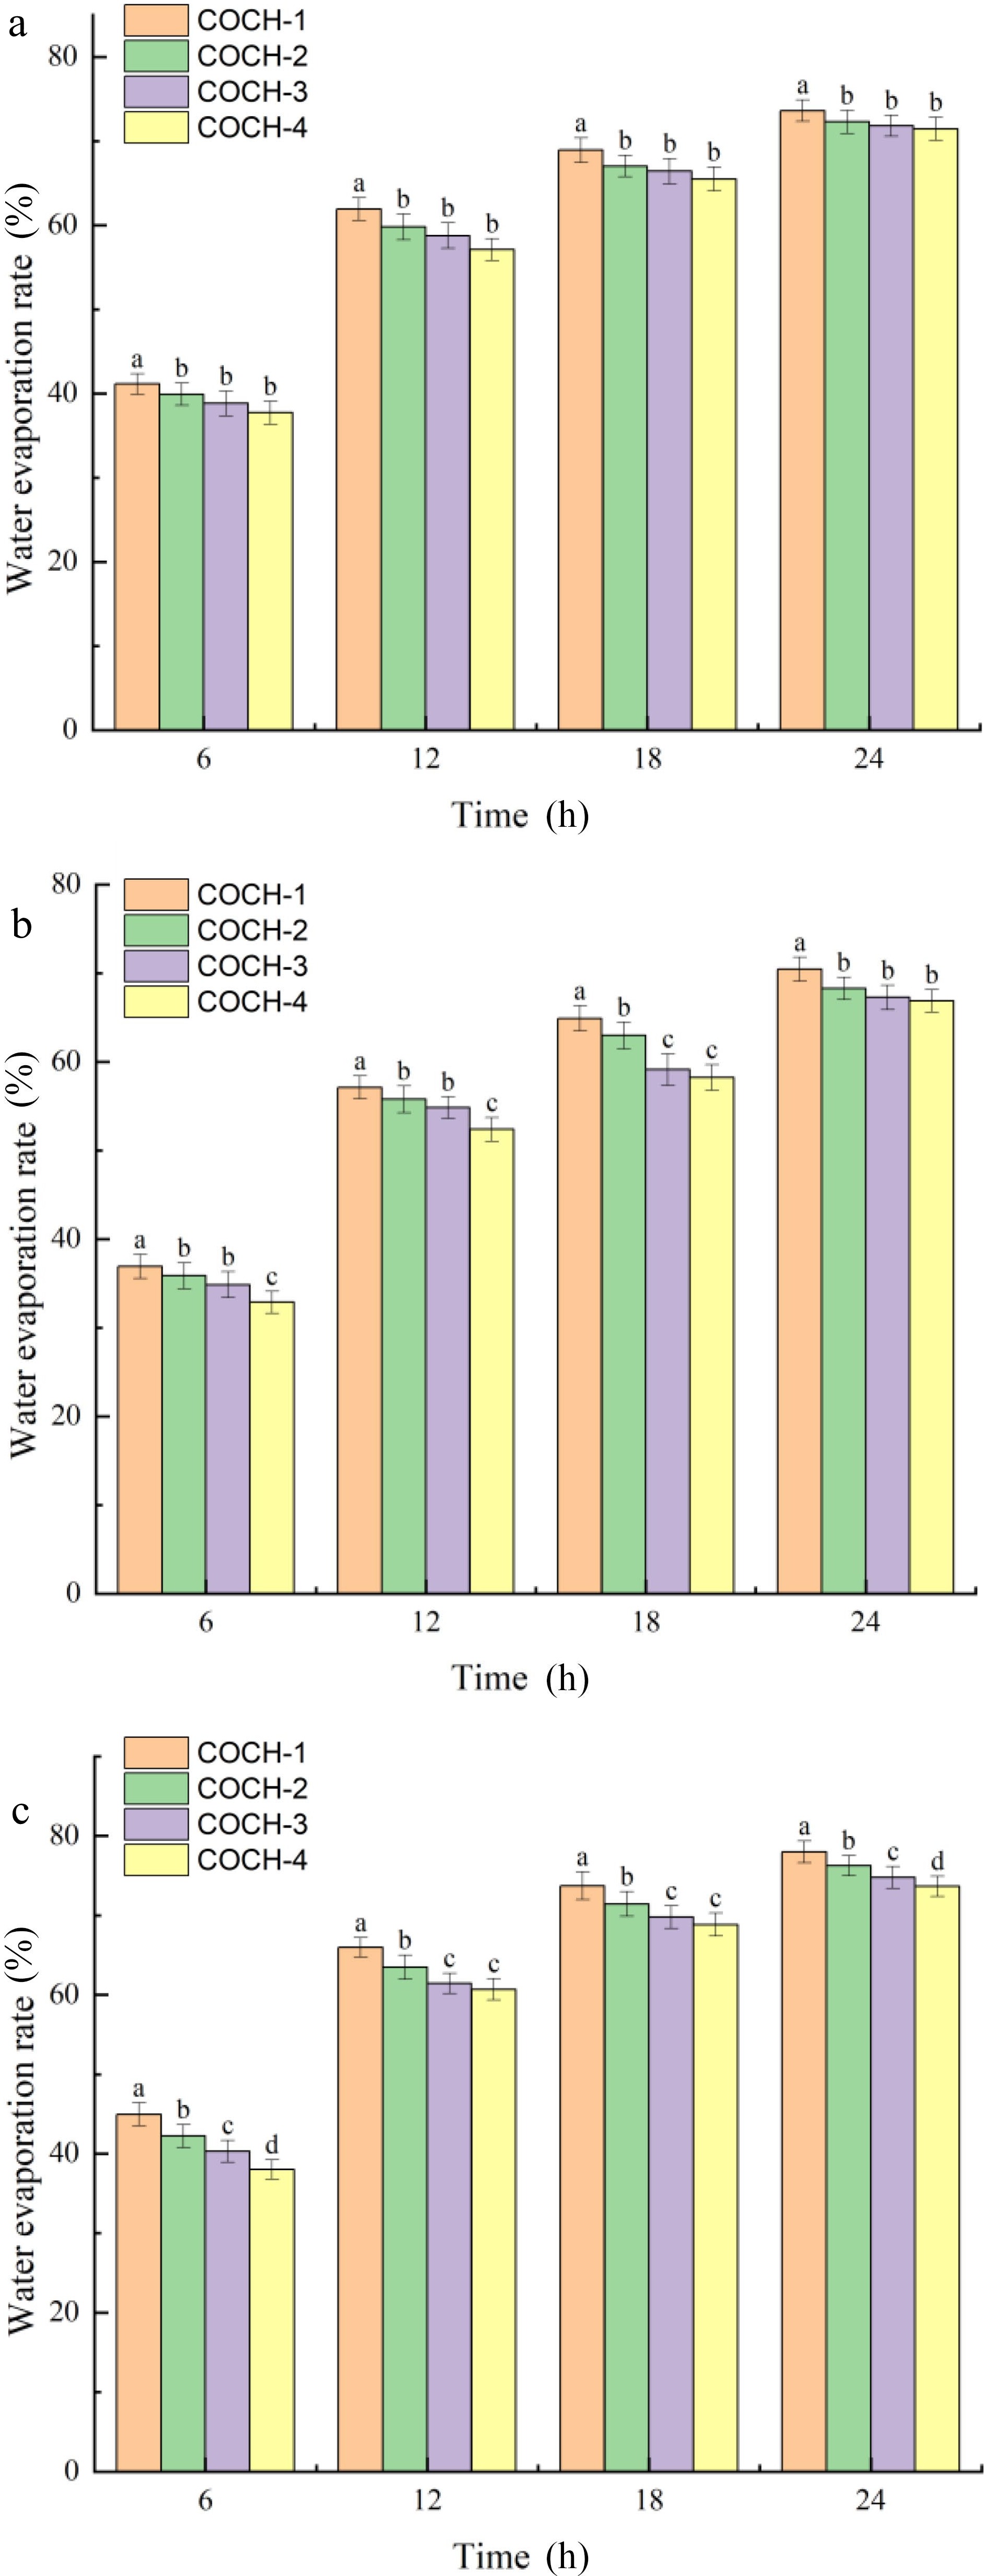
Figure 7.
Moisture evaporation rate of (a) COCH, (b) COBH, and (c) COPH with different mixing ratios.
-
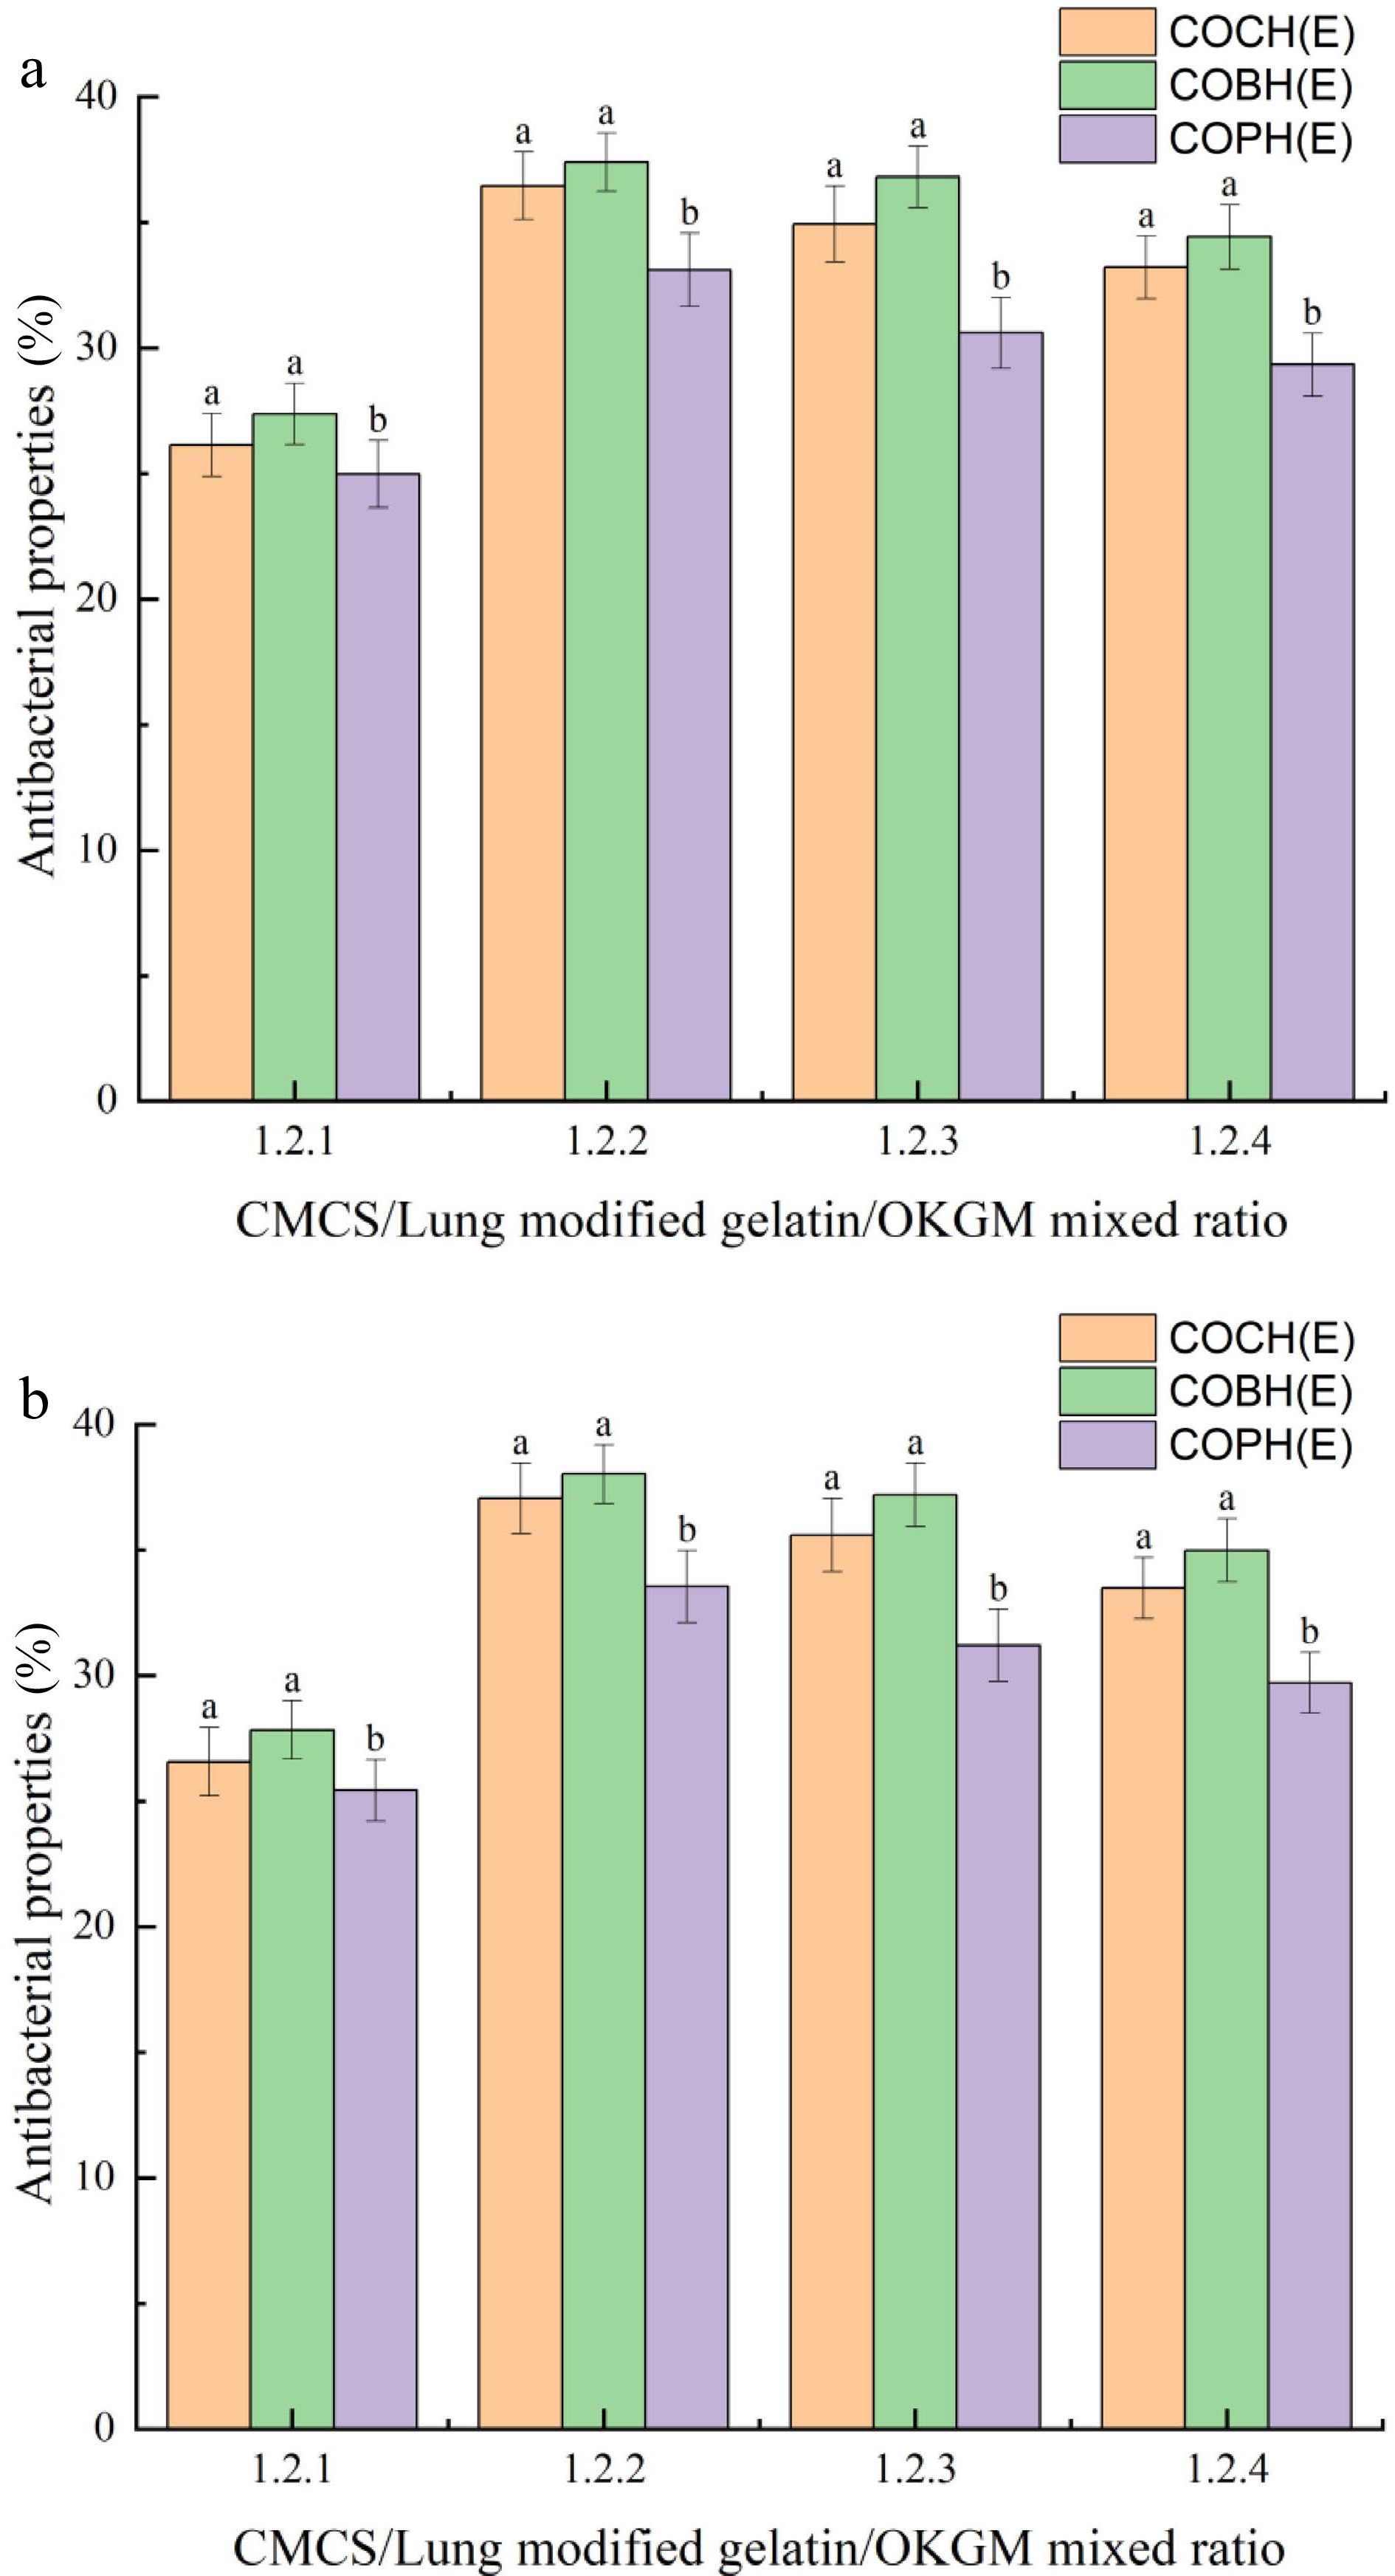
Figure 8.
(a) Anti-S. aureus and (b) E. coli activity of COCH, COBH and COPH with different mixing ratios.
-
T21 (ms) T22 (ms) T23 (ms) P21 P22 P23 COCH-1 3.152 ± 0.437a 27.466 ± 0.953a 530.627 ± 0.100e 24.990 ± 0.394d 7649.545 ± 0.963m 173.803 ± 3.172d COCH-2 2.676 ± 0.487a 19.902 ± 0.468c 526.32 ± 0.798e 27.593 ± 0.585c,d 7914.01 ± 1.024h 166.833 ± 2.574e COCH-3 1.978 ± 0.633a,b 17.544 ± 0.200c,d 581.293 ± 1.175d 30.025 ± 0.370c 7972.7 ± 1.590e 167.659 ± 0.626e COCH-4 0.675 ± 0.088c 14.759 ± 0.058d 332.846 ± 0.881h 32.866 ± 0.355a,b 8506.39 ± 3.585b 153.705 ± 1.037g COCH-1 2.7845 ± 0.731a 23.558 ± 1.133b 581.118 ± 1.000d 35.838 ± 1.079a 7775.183 ± 2.558l 178.562 ± 1.297d COCH-2 2.401 ± 1.091a 17.012 ± 1.604c,d 483.093 ± 1.696g 30.917 ± 0.319c 7944.58 ± 3.422g 161.966 ± 0.922f COCH-3 1.5705 ± 0.484a,b 17.6185 ± 1.017c,d 504.607 ± 0.050f 33.752 ± 1.111a 8295.7 ± 0.714d 153.496 ± 2.485g COCH-4 0.557 ± 0.086c 13.601 ± 0.200d 303.613 ± 0.945i 33.392 ± 0.177a 8912.46 ± 2.481a 124.857 ± 0.607h COPH-1 3.382 ± 0.260a 26.308 ± 0.714a 719.183 ± 1.966b 26.274 ± 3.302c,d 7403.543 ± 0.526n 256.824 ± 0.806a COPH-2 2.675 ± 1.422a 19.635 ± 0.999c 627.106 ± 0.112c 28.1985 ± 0.773c,d 7857.69 ± 1.734i 216.393 ± 0.314b COPH-3 2.072 ± 1.050a 17.586 ± 0.048c,d 765.049 ± 1.832a 31.524 ± 0.061b 7952.09 ± 1.003f 193.956 ± 1.258c COPH-4 1.548 ± 0.108b 16.209 ± 1.508c,d 506.198 ± 1.641f 31.542 ± 0.182b 8331.59 ± 0.7845c 176.078 ± 2.867d The data in this table is expressed as mean ± SD, different letters in the same column indicates significant differences (p < 0.05). Table 1.
Low-field nuclear magnetic characterization of COCH, COBH and COPH with different mixing ratios.
Figures
(8)
Tables
(1)