-
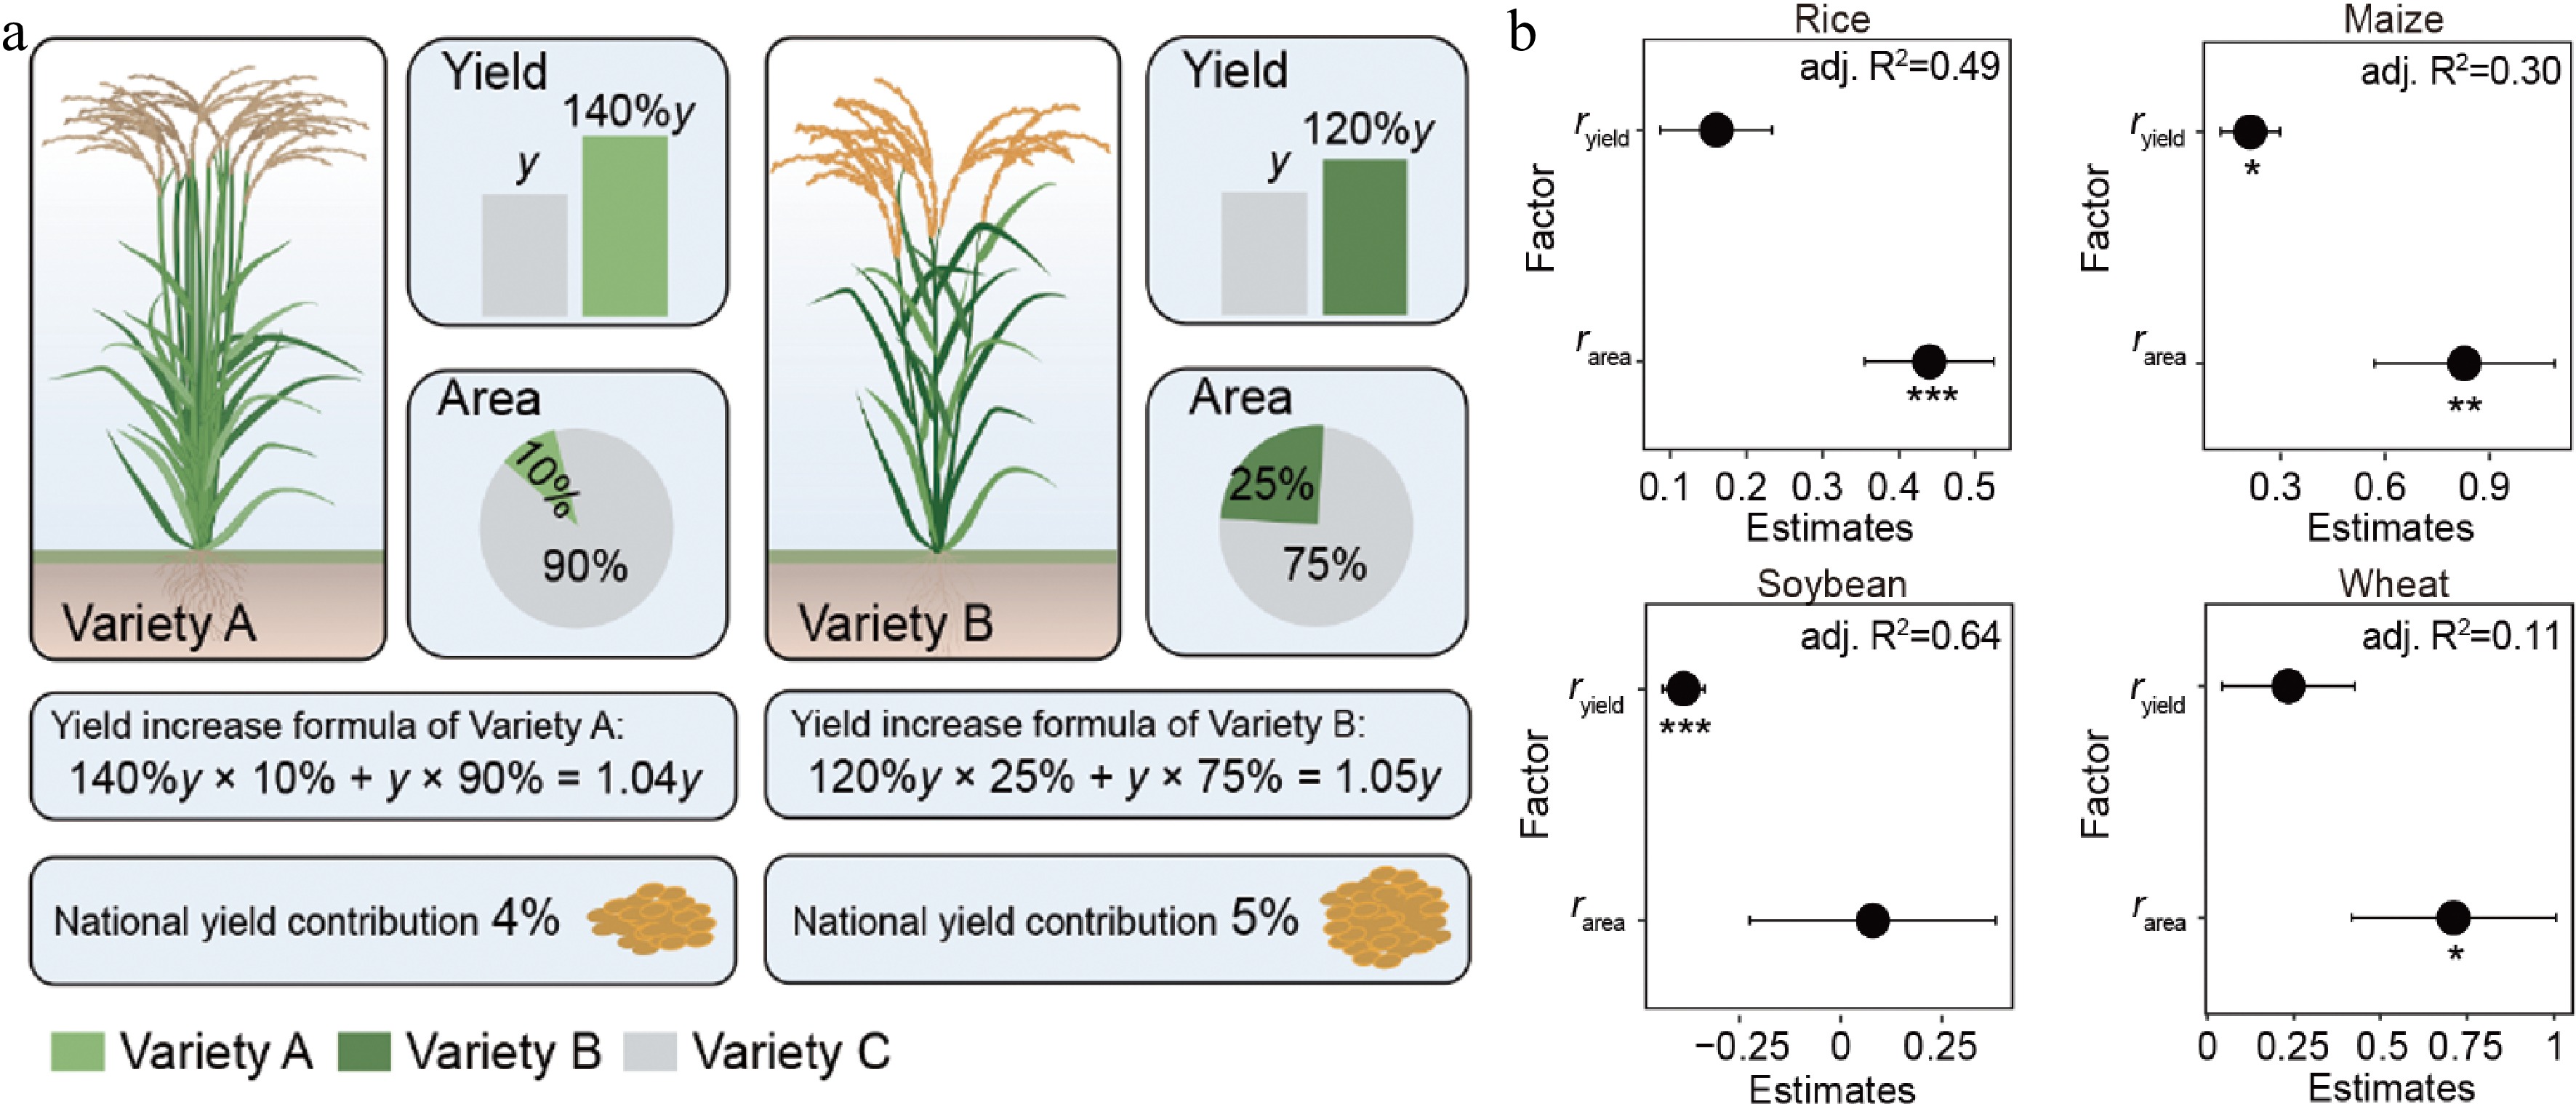
Figure 1.
Planting area–enhanced production theory. (a) Diagram illustrating the theory. y is the average yield of control Variety C. The rice plant as 'Created with BioRender.com'. (b) Multilevel linear regression for yield rate by ryield to rarea in global regions. The 95% confidence intervals (CIs) of the partial regression coefficient are shown. The asterisk is used to represent the significance of the regression coefficient. (*** p < 0.001; 0.001 < ** p < 0.01; 0.01 < * p < 0.05)
-
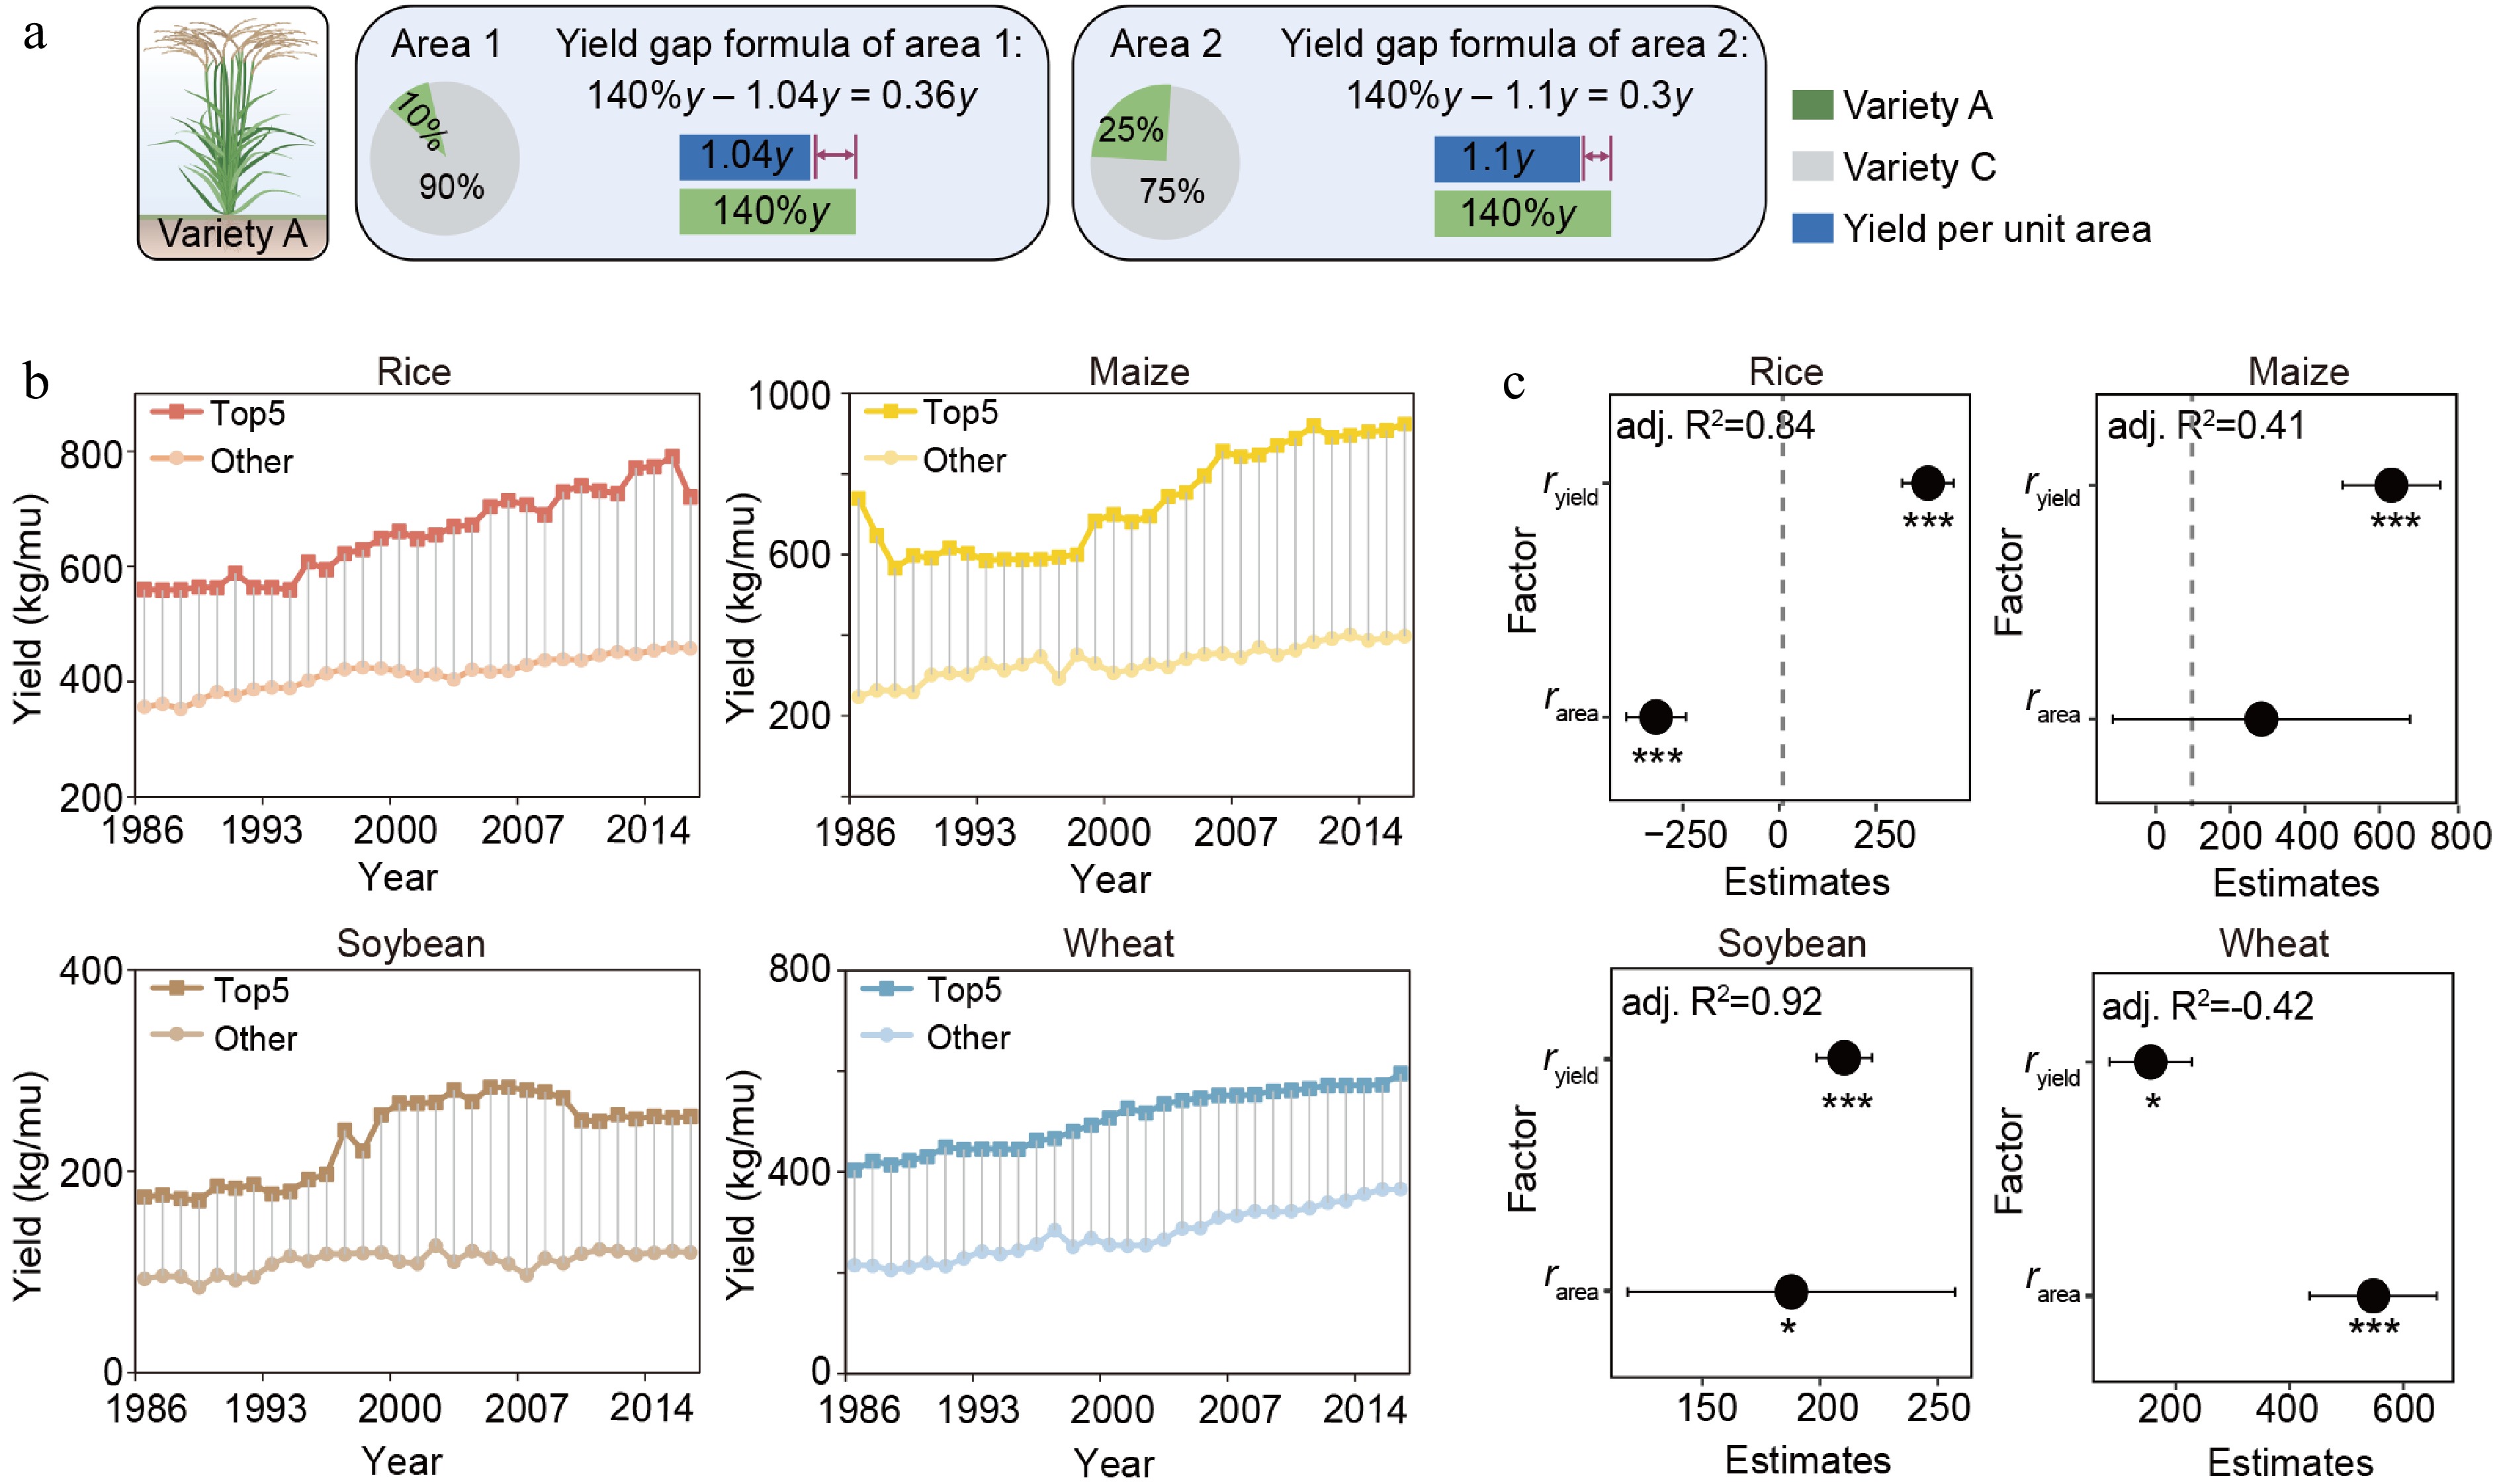
Figure 2.
Expanding the planting area helps reduce the yield gap in rice. (a) Modeling results showing the effect of large-scale planting of high-yielding varieties on the yield gap. y is the average yield of control Variety C. The rice plant as 'Created with BioRender.com'. (b) Yield gaps in different crops. (c) Multilevel linear regression for yield gap by ryield to rarea of rice, maize, soybean, and wheat in global regions. The 95% confidence intervals (CIs) of the partial regression coefficient are shown. The asterisk is used to represent the significance of the regression coefficient. (*** p < 0.001; 0.001 < ** p < 0.01; 0.01 < * p < 0.05).
-
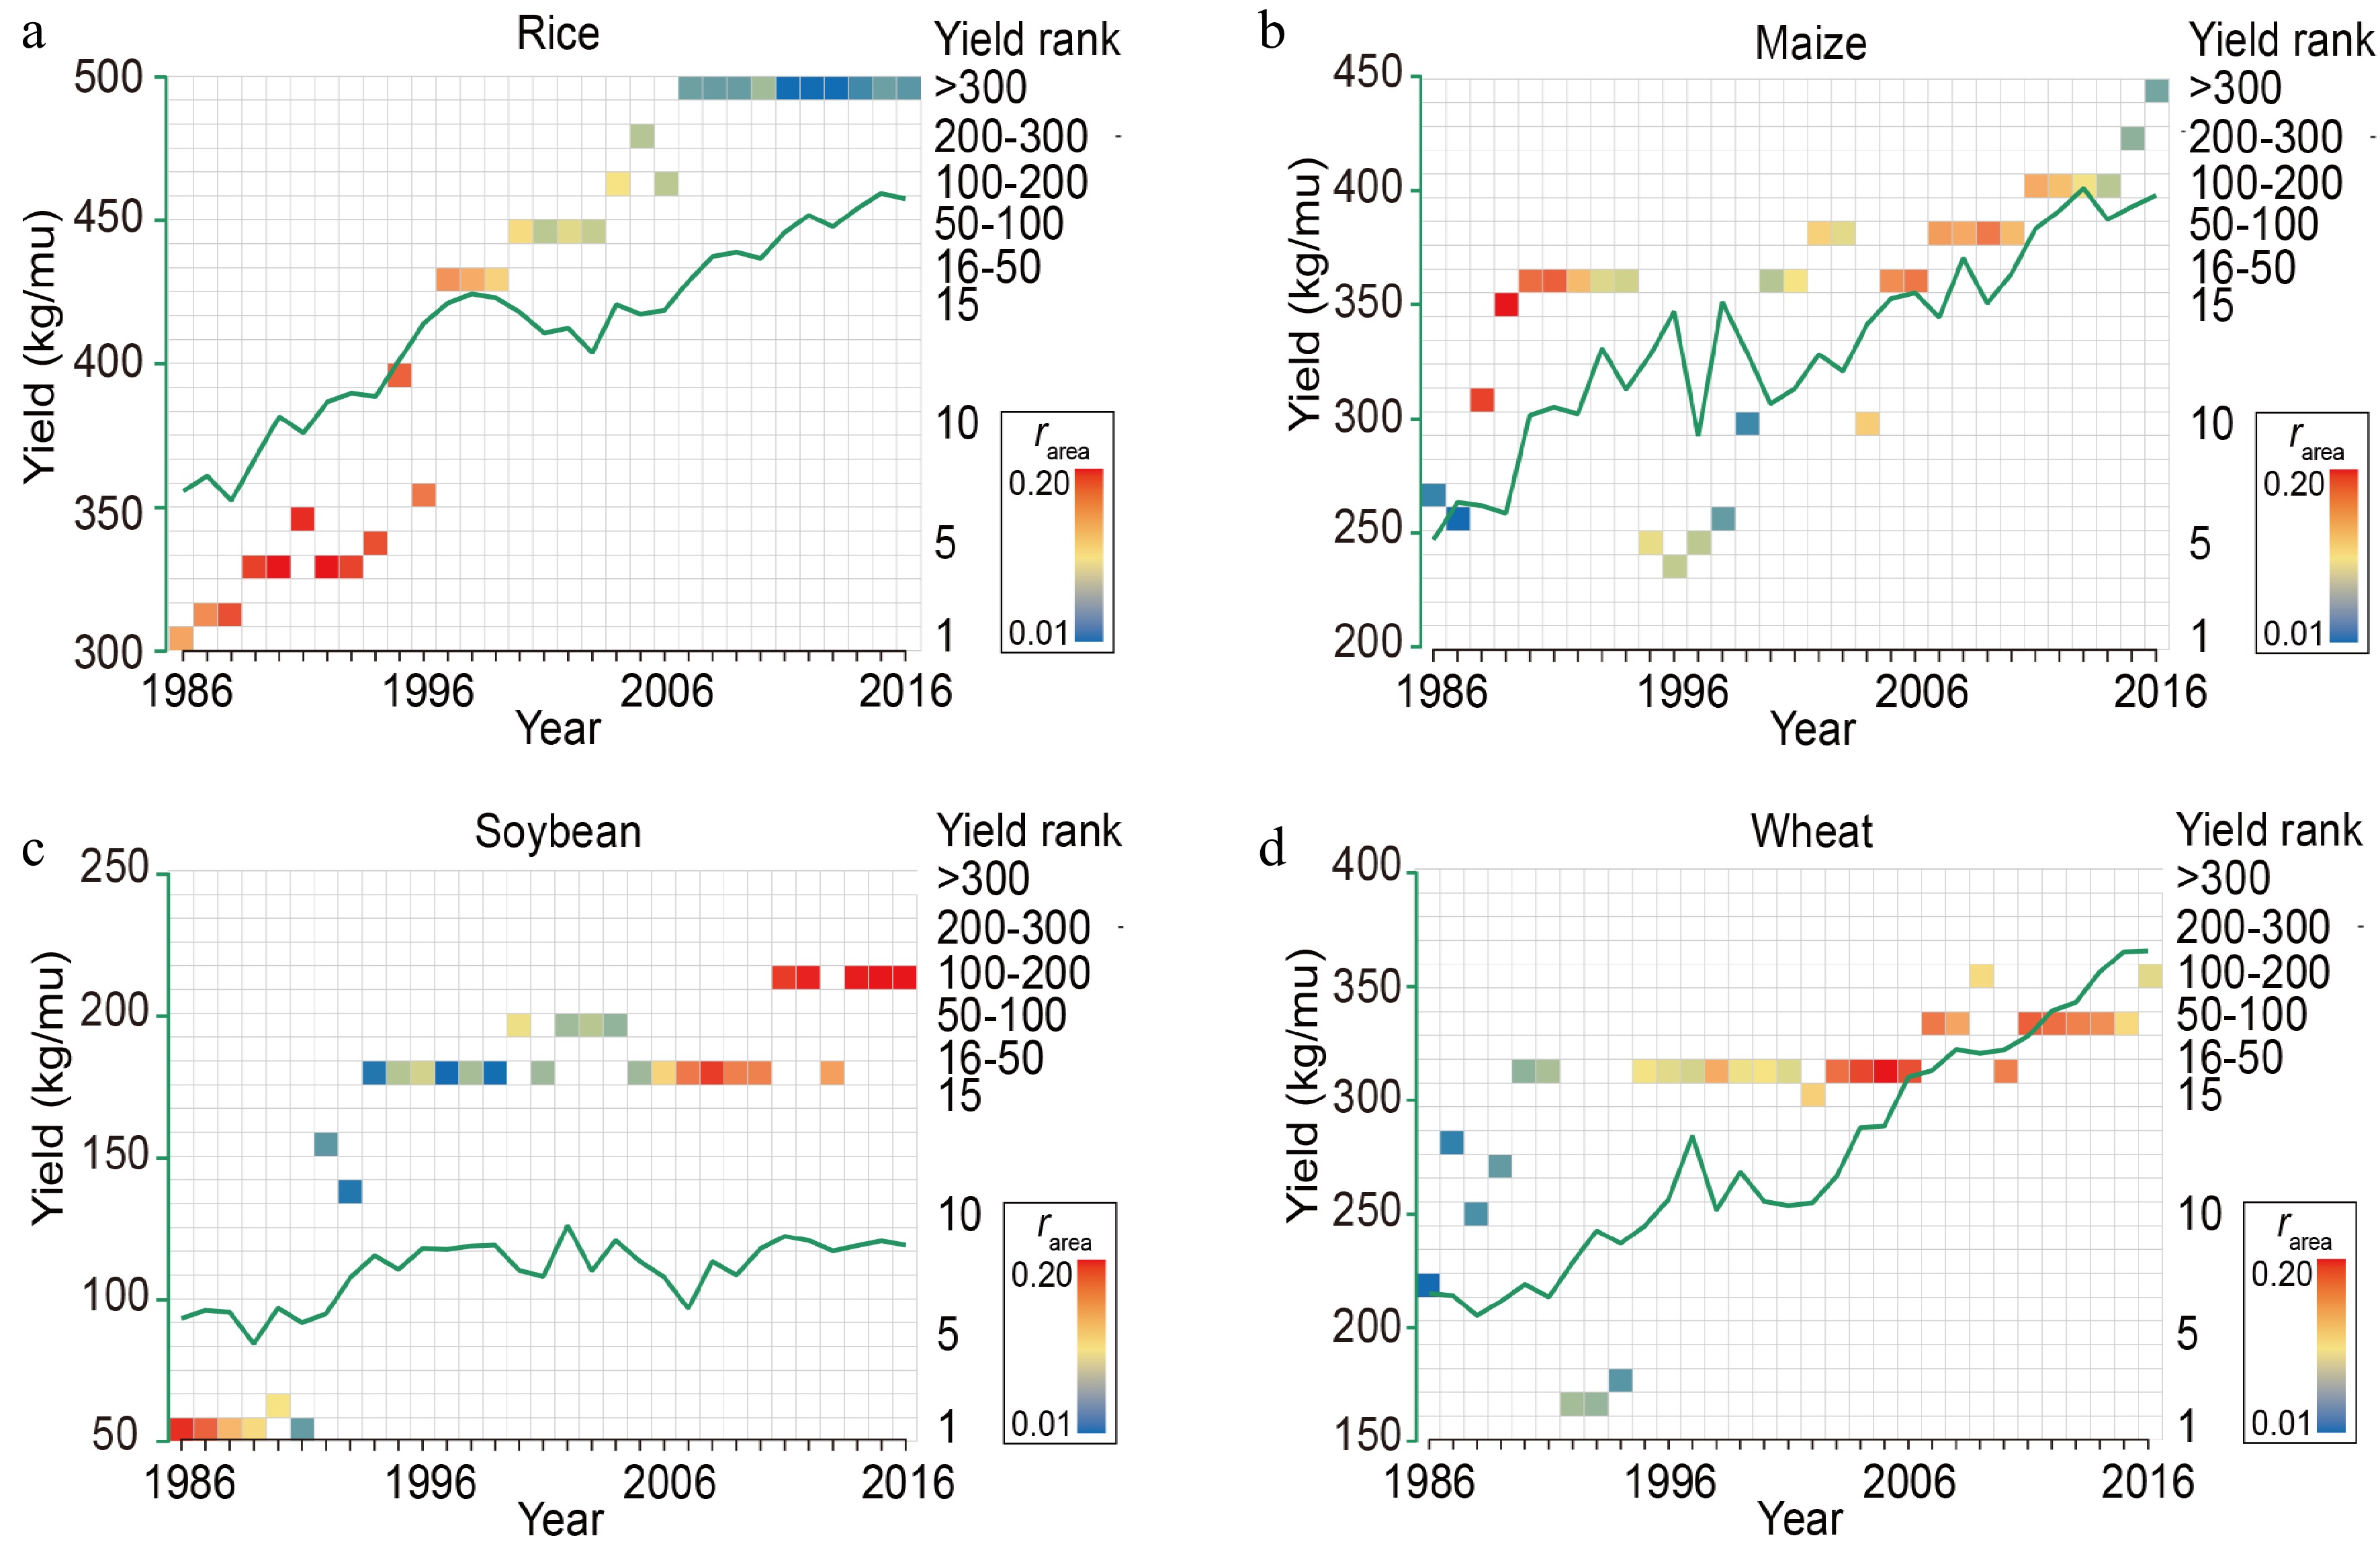
Figure 3.
rarea and yield ranking of the varieties with the largest planting area and yield per unit area for (a) rice, (b) maize, (c) soybean, and (d) wheat in different global regions. Each square represents a region, with colors representing the rarea and positions representing the yield ranking; the green lines represent the mean country yield per unit area planted.
-

Figure 4.
$r'_{\rm{area}} $ $r'_{\rm{yield}} $ $r'_{\rm{area}} $ $r'_{\rm{yield}} $ -
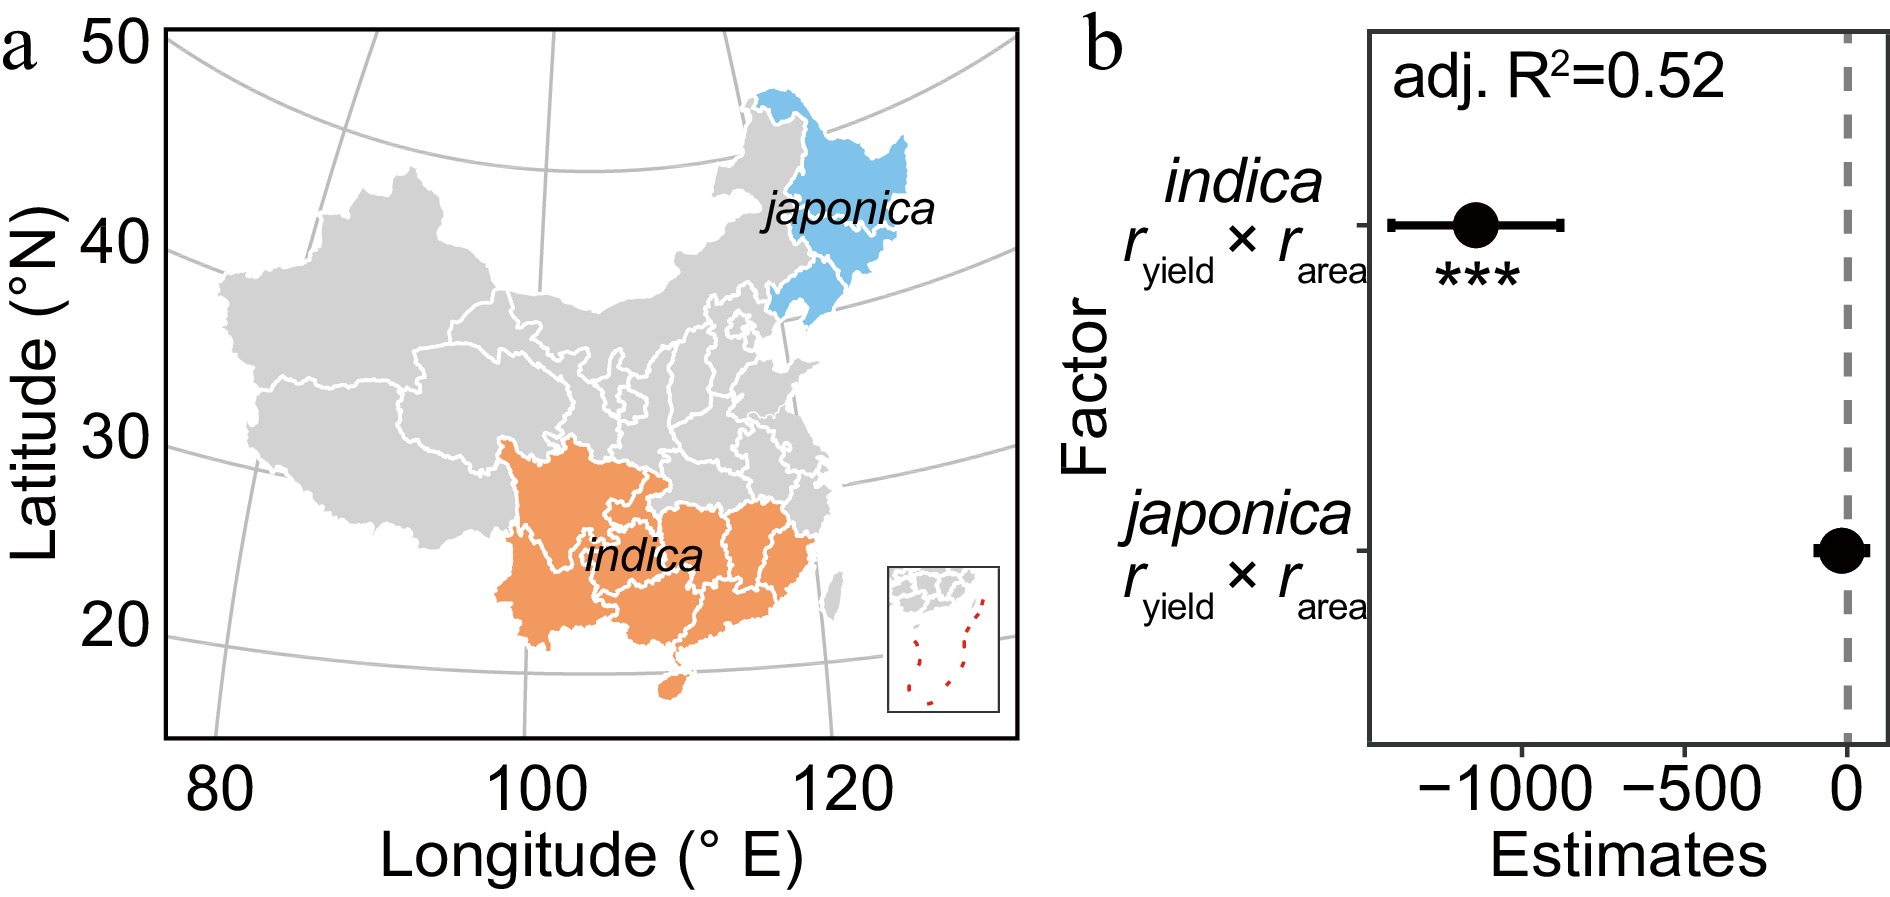
Figure 5.
The planting of indica rice helps reduce the yield gap. (a) Distribution of indica and japonica rice cultivars; provinces where both indica and japonica varieties were grown are omitted. (b) Multilevel linear regression for yield gap by interactions of rarea and ryield in different rice ecotypes. jap. and ind. represent areas where japonica and indica cultivars are grown, respectively. The 95% confidence intervals (CIs) of the partial regression coefficient are shown. The asterisk is used to represent the significance of the regression coefficient. (*** p < 0.001; 0.001 < ** p < 0.01; 0.01< * p < 0.05).
Figures
(5)
Tables
(0)