-
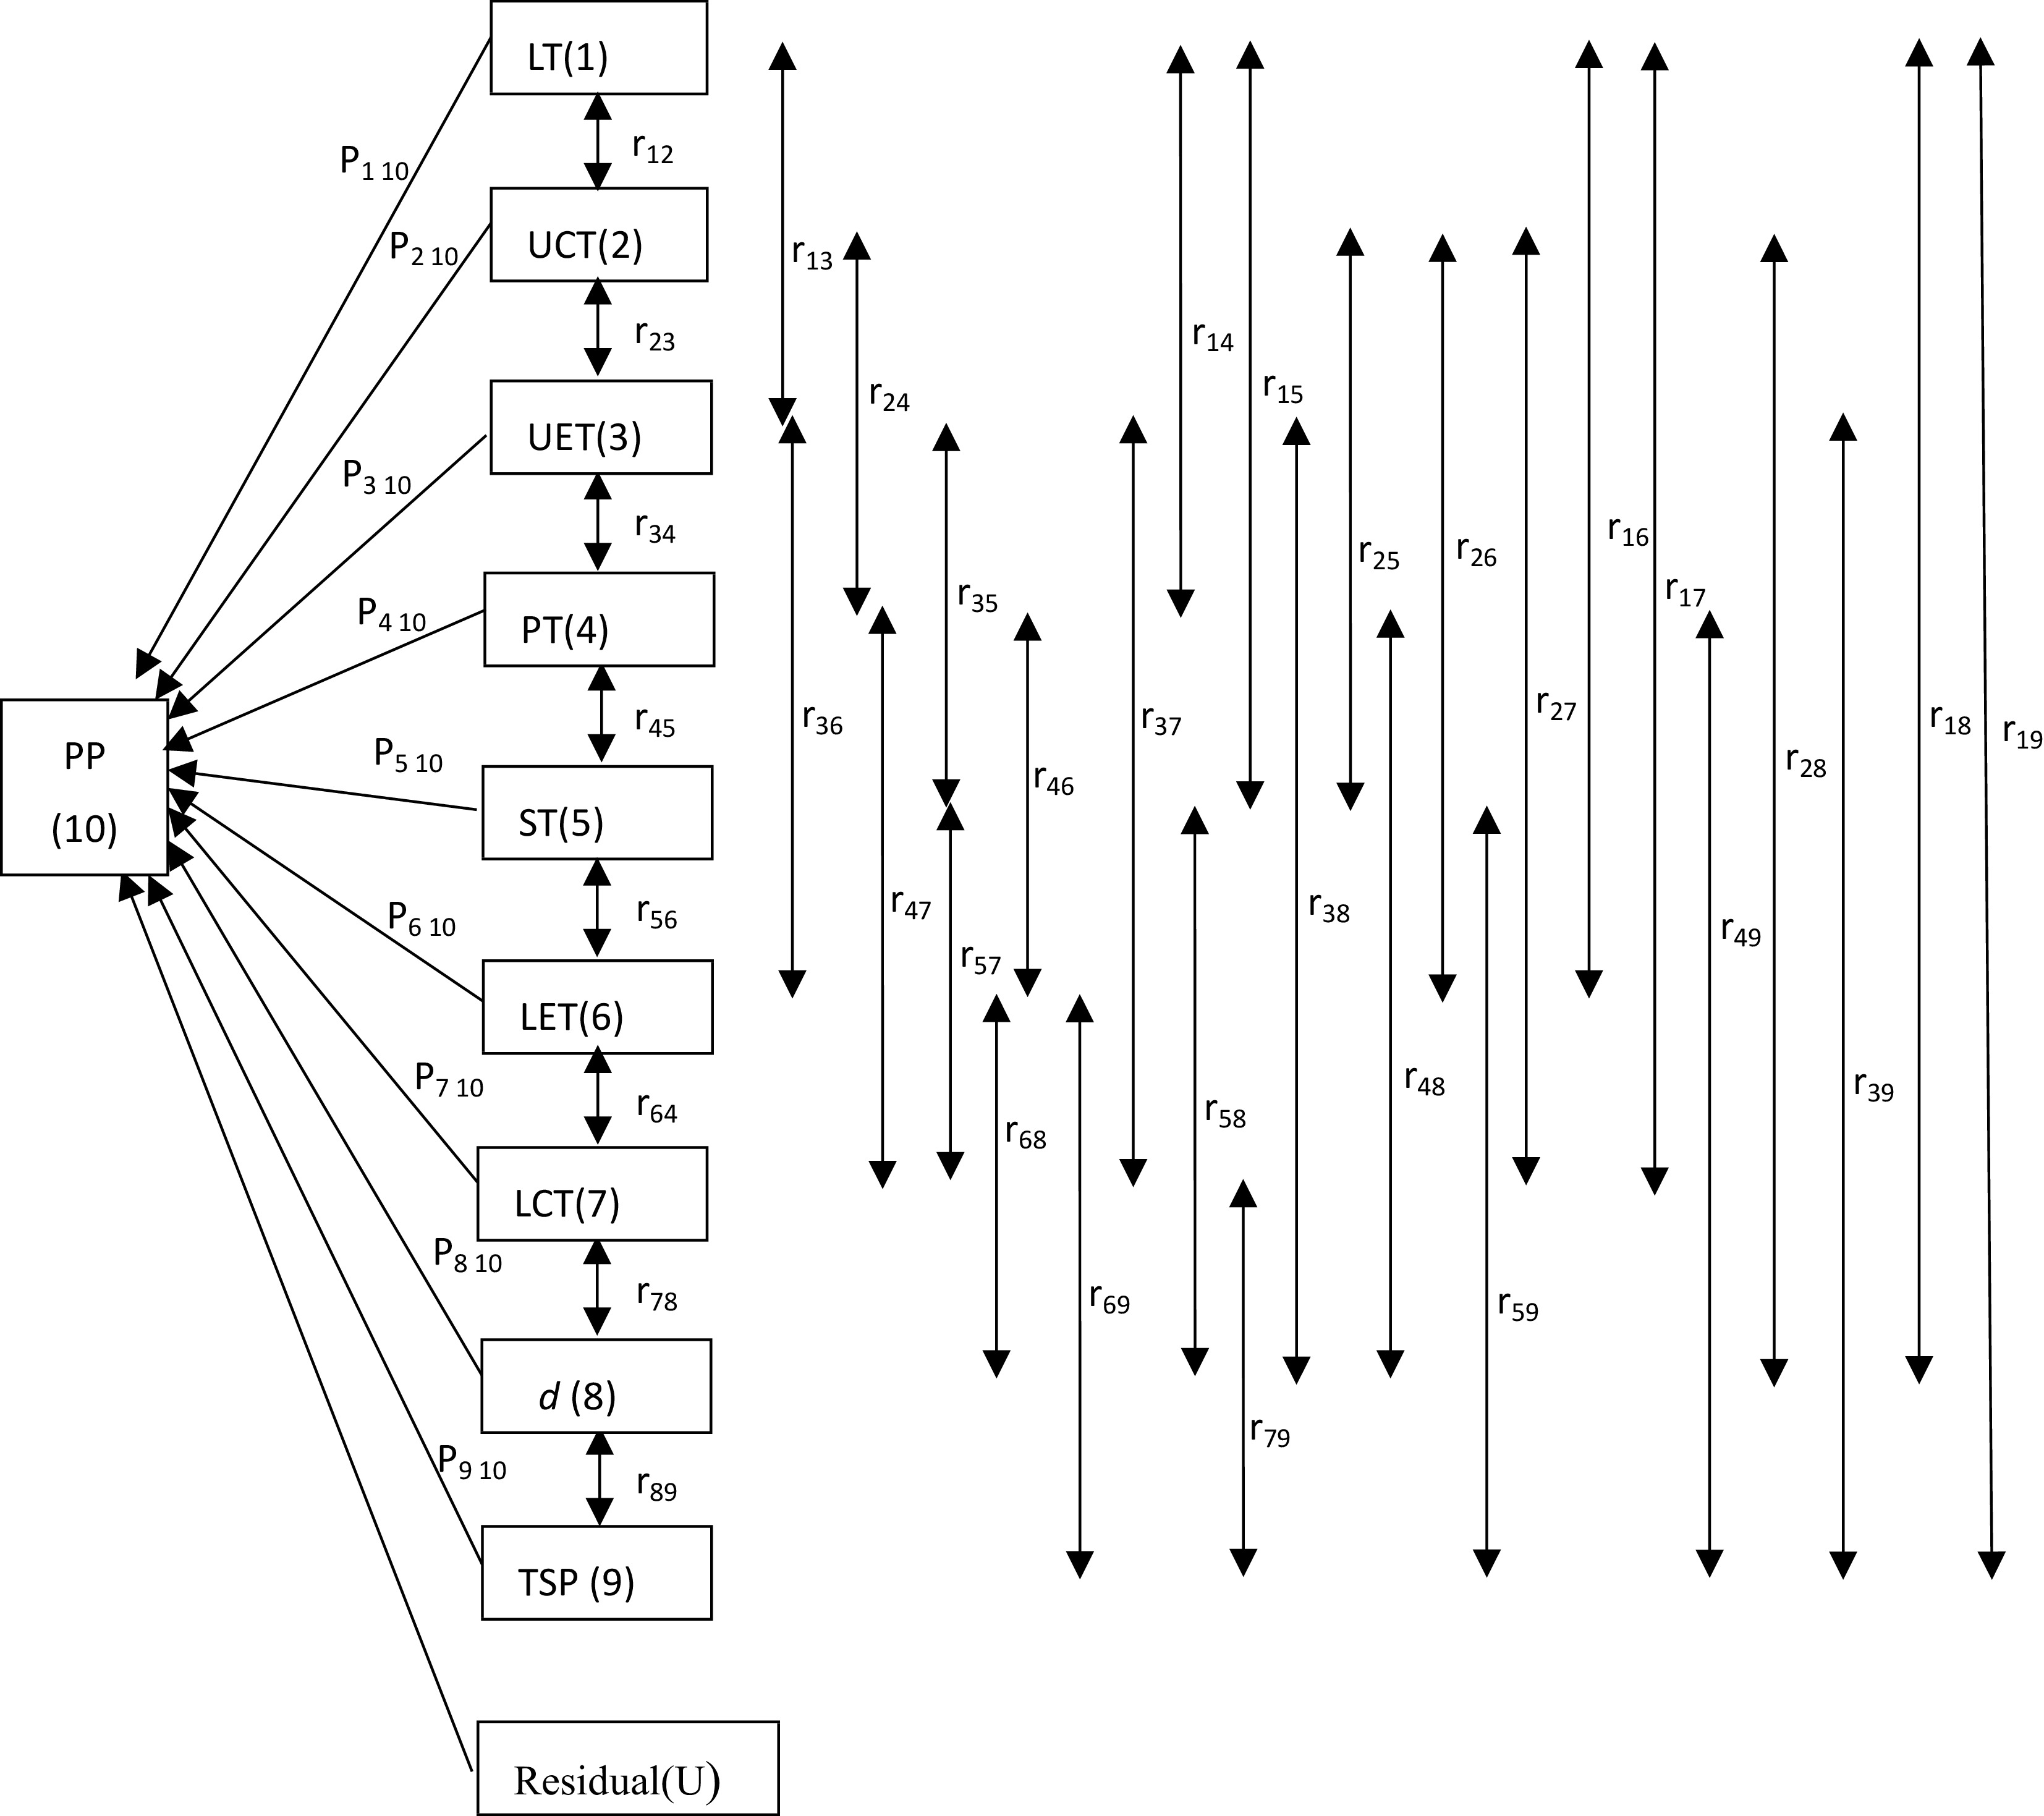
Figure 1.
Path diagram for the relationship between leaf anatomical traits and photosynthetic parameters. The direct effects (Pij) of leaf anatomical traits on the photosynthetic parameter (PP) are represented by single-headed arrows, while the indirect effects (rijPij) of leaf anatomical traits are shown by double-headed arrows. Subscript designations for leaf anatomical traits and photosynthetic parameters are identified numerically as follows: (1) LT = leaf thickness; (2) UCT = upper cuticle thickness; (3) UET = upper epidermal thickness; (4) PT = palisade tissue thickness; (5) ST = spongy tissue thickness; (6) LET = lower epidermal thickness; (7) LCT = lower cuticle thickness; (9) d = stomatal density; (10) TSP = total stomach pore area; and (10) PP = photosynthetic parameters. The photosynthetic parameters (PP) are IQY, AQY, α, Pmax, Isat, Ic, RD, Rd, Vcmax, Jmax, TPU, Γ*, gi, Ci, gs, VPD, A, E, WUE.
-
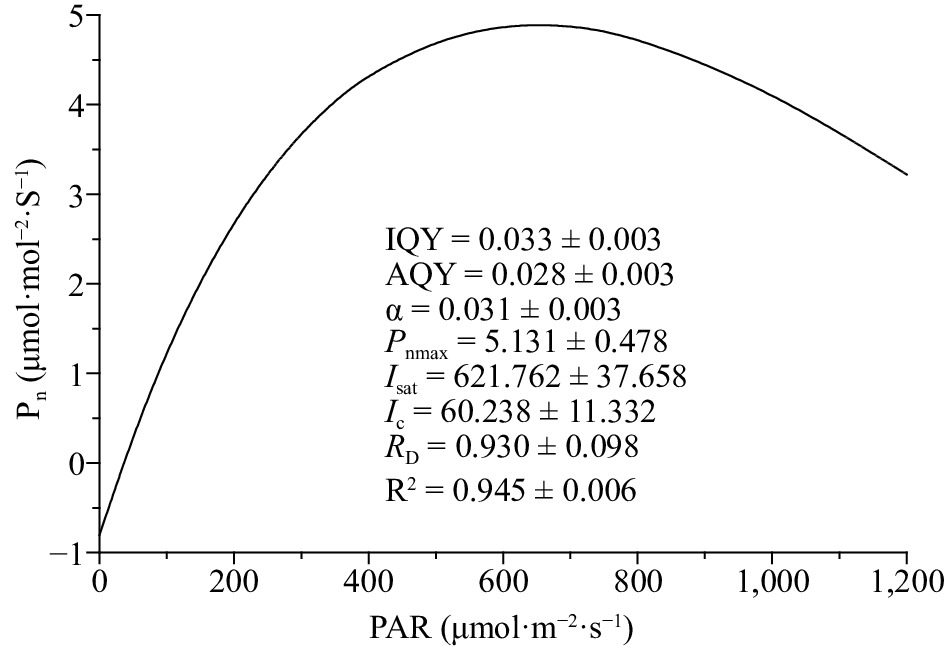
Figure 2.
Photosynthetic light-response curve of coffee plants. Data shown in the figure indicate mean ± standard error. IQY – intrinsic quantum yield; AQY – apparent quantum yield; α – the absolute value of slope between I = 0 and I = Ic; Pnmax – maximum photosynthetic rate [µmol (CO2) m–2·s–1]; Isat – light saturation point [µmol (photon) m–2·s–1]; Ic – light compensation point [µmol (photon) m–2·s–1]; RD – dark respiration [µmol (CO2) m–2·s–1].
-
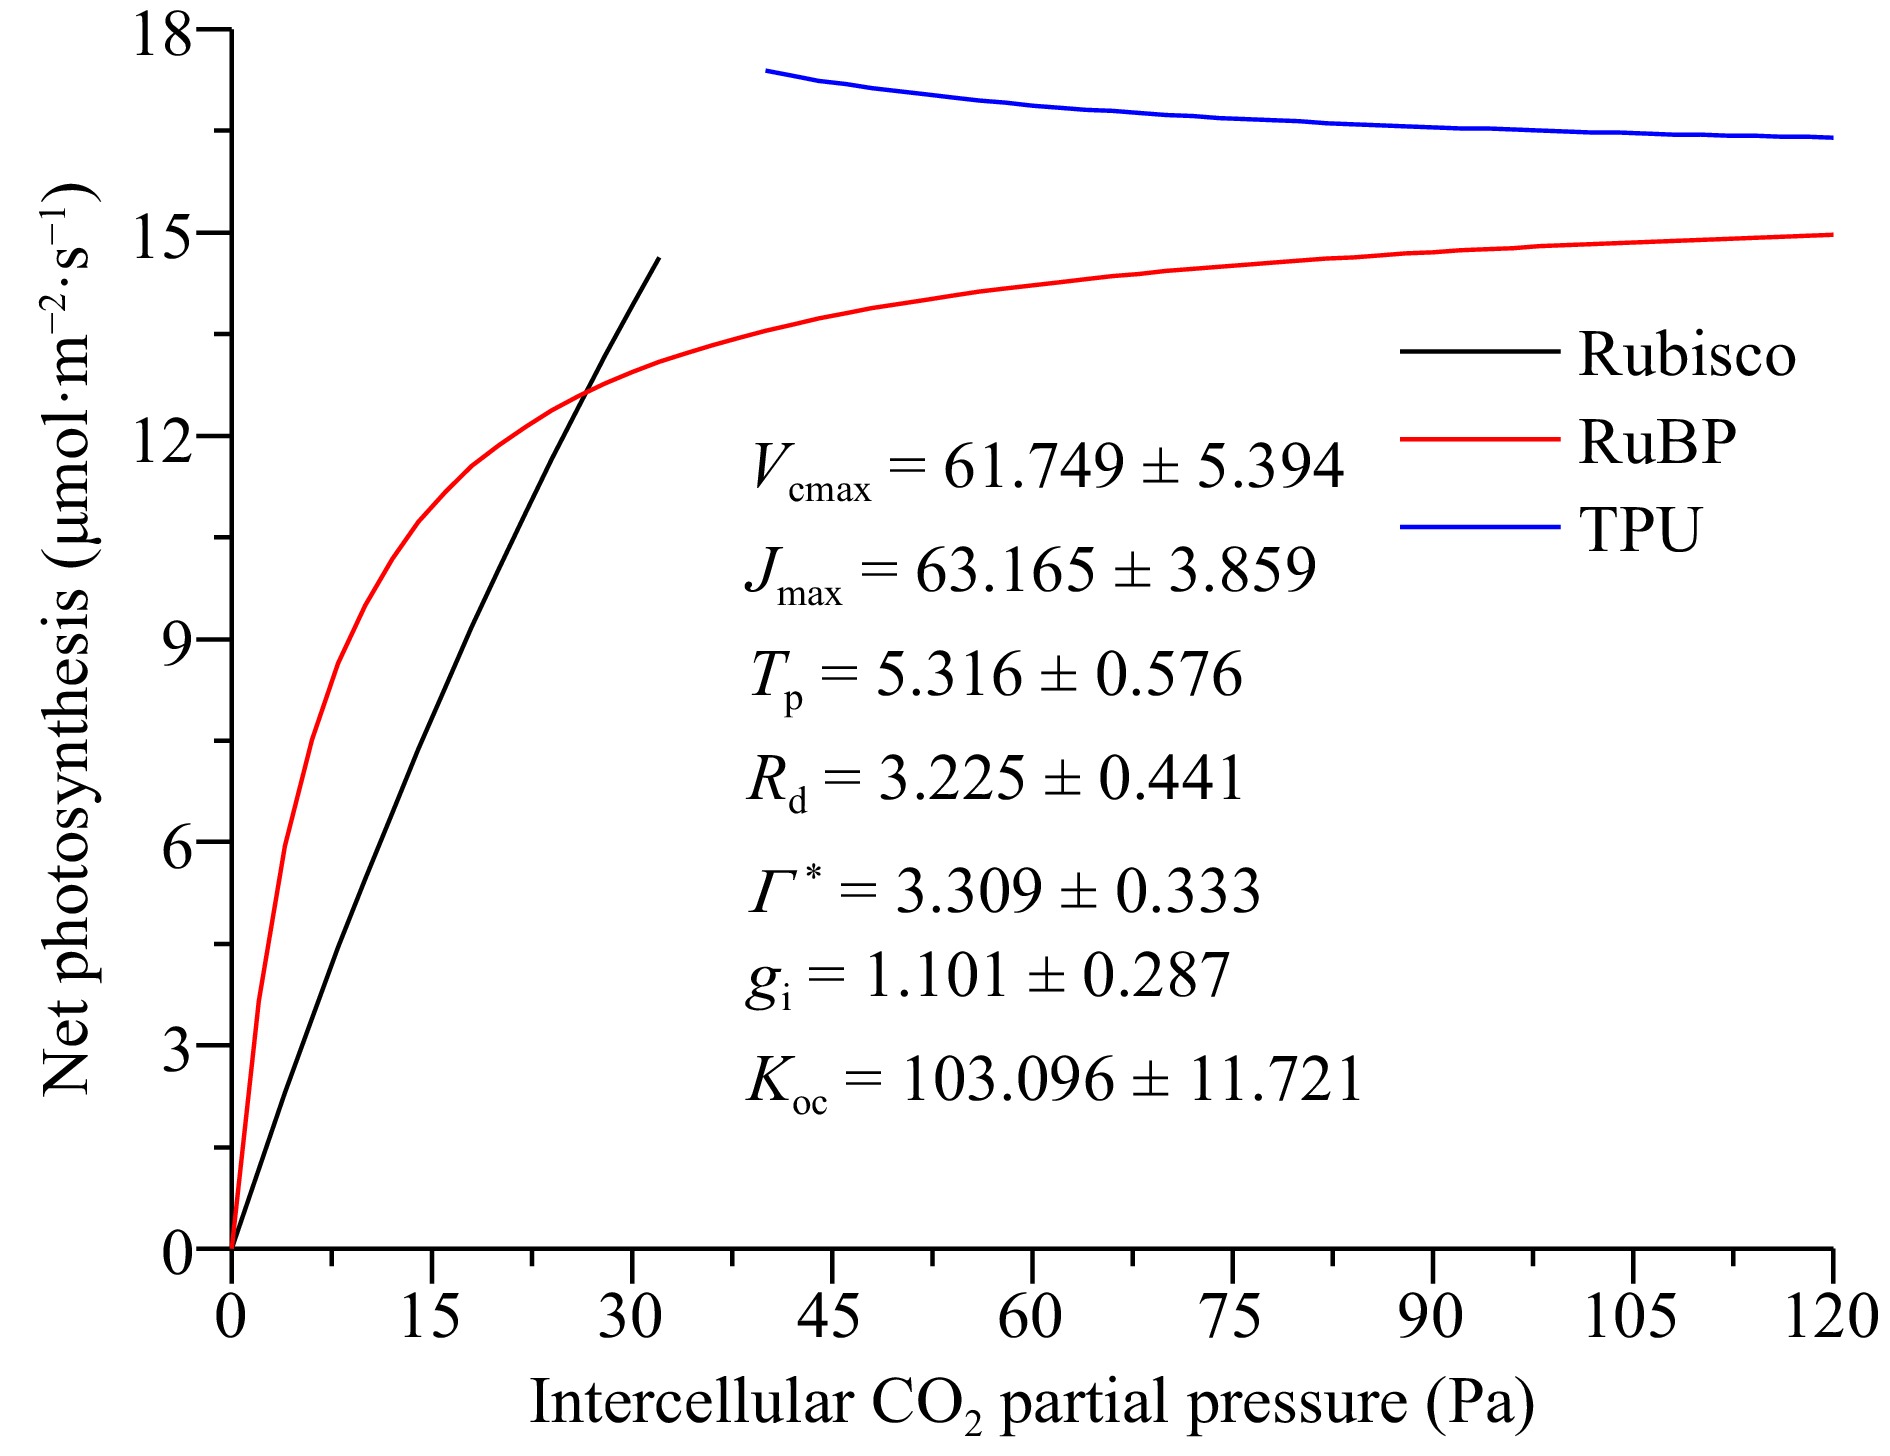
Figure 3.
The A/Ci curves for the coffee plants. Data shown in the figure indicate mean ± stand error. Ci – Intercellular CO2 concentration (µmol·mol–1); Vcmax – Maximal Rubisco carboxylation rate (µmol·m–2·s–1); Jmax – Maximal electron transport rate (µmol·m–2·s–1); Tp – Rate of triose phosphate export from the chloroplast (µmol·m–2·s–1); Rd – Day respiration (µmol·m–2·s–1); Γ* – CO2 compensation point in the absence of dark respiration (Pa); gi – Internal (mesophyll) conductance to CO2 transport (µmol·m–2·s–1·Pa−1);
$ {K}_{oc} $ $ {K}_{\rm{oc}}={K}_{\mathrm{c}}(1+O/K_{\rm o}) $ -
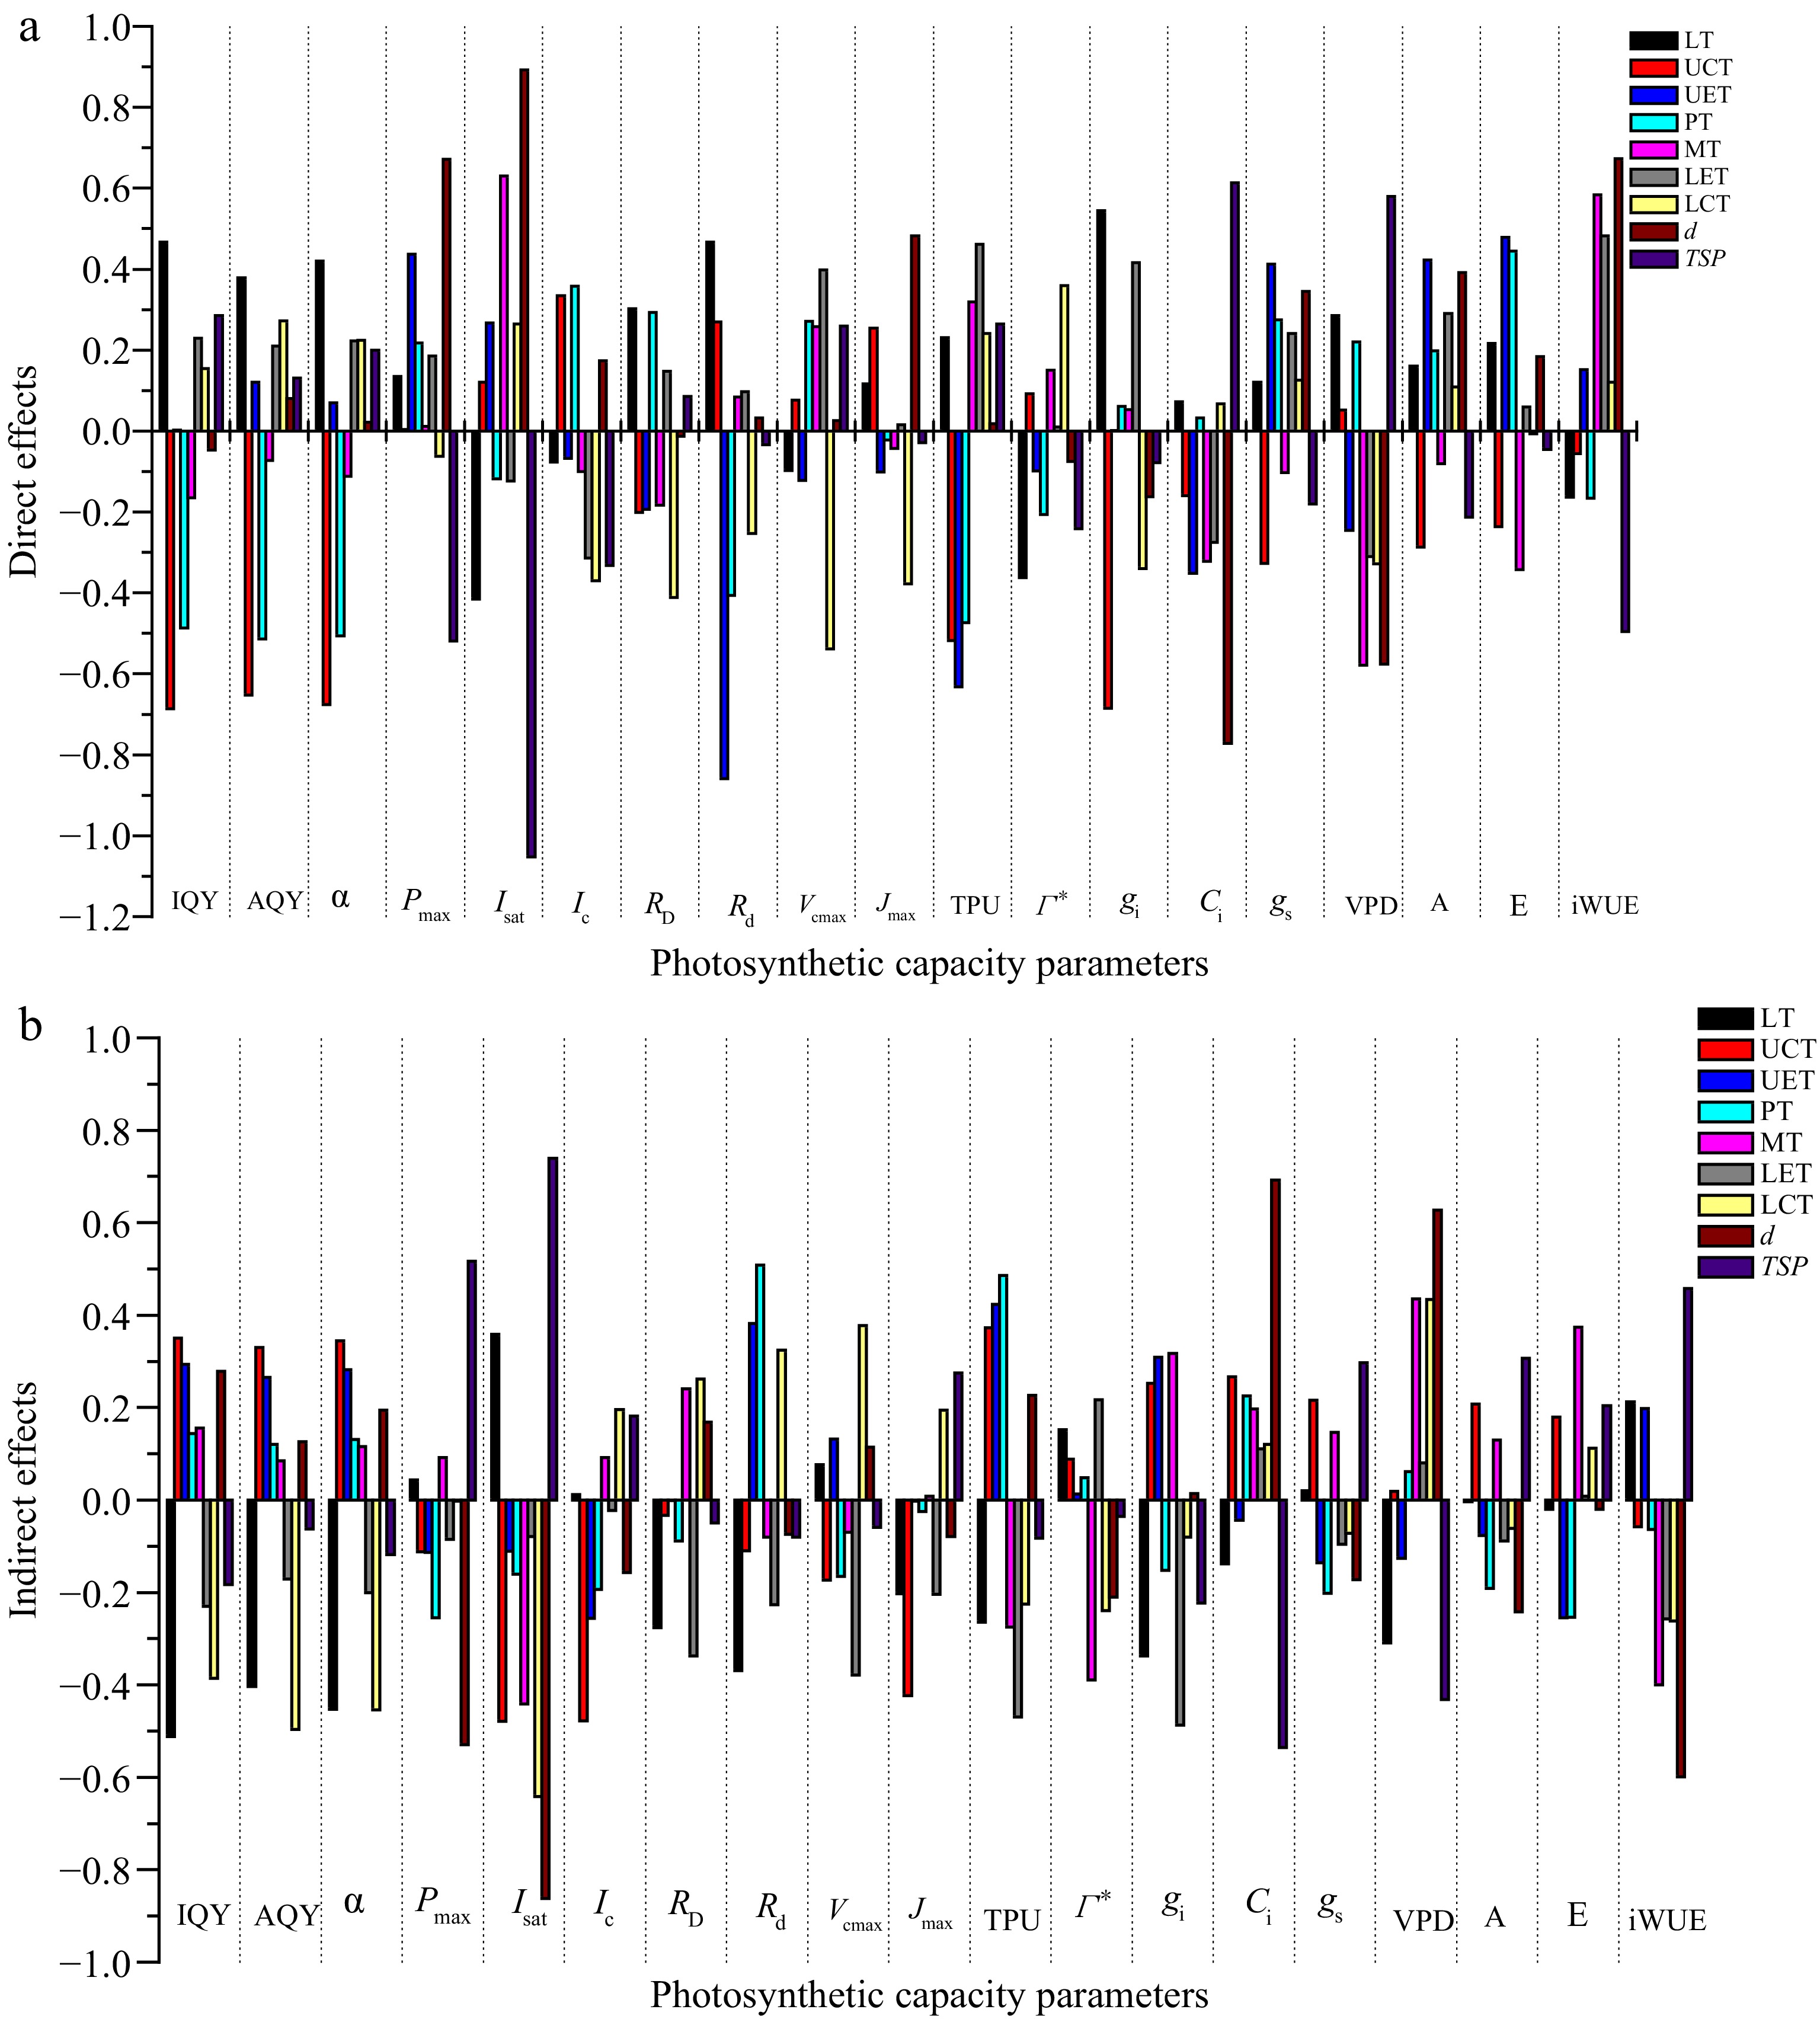
Figure 4.
(a) Direct and (b) indirect effects of each leaf anatomical traits through other traits on photosynthetic parameters. LT – leaf thickness, UCT – upper cuticle thickness, UET – upper epidermal thickness, PT – palisade tissue thickness, ST – spongy tissue thickness, LET – lower epidermal thickness, LCT – lower cuticle thickness, w – guard cell width, l – guard cell length, d – stomatal density, TSP – total stomach pore area. The residual effect of IQY, AQY, α, Pmax, Isat, Ic, RD, Rd, Vcmax, Jmax, TPU, Γ*, gi, Ci, gs, VPD, A, E, and WUE was 0.799, 0.760, 0.775, 0.849, 0.737, 0.859, 0.908, 0.755, 0.883, 0.887, 0.860, 0.877, 0.644, 0.817, 0.858, 0.821, 0.840, 0.858, and 0.801, respectively.
-
Leaf anatomy Mean SE CV (%) Proportion of leaf thickness (%) Tissue components (µm) LT 255.627 1.832 4.645 100.000 UCT 5.497 0.042 4.962 2.154 UET 23.681 0.291 7.957 9.279 PT 51.014 1.042 13.243 19.913 ST 153.285 1.245 5.264 59.969 LET 17.908 0.195 7.056 7.023 LCT 4.243 0.040 6.121 1.662 Stomatal characteristics W (µm) 8.252 0.048 3.733 L (µm) 27.874 0.208 4.839 d (No./mm2) 152.028 1.942 8.277 TSP 0.439 0.006 8.886 LT – leaf thickness, UCT – upper cuticle thickness, UET – upper epidermal thickness, PT – palisade tissue thickness, ST – spongy tissue thickness, LET – lower epidermal thickness, LCT – lower cuticle thickness, w – guard cell width, l – guard cell length, d – stomatal density, TSP – total stomach pore area. Table 1.
The components of anatomical tissues in Arabica coffee leaf.
-
Parameters LT UCT UET PT ST LET LCT w l d TSP IQY −0.044 ns −0.336* 0.296 ns −0.343* −0.010 ns 0.000 ns −0.232 ns 0.175 ns −0.315* 0.232 ns 0.103 ns AQY −0.024 ns −0.322* 0.386* −0.394* 0.012 ns 0.039 ns −0.224 ns 0.197 ns −0.358* 0.206 ns 0.068 ns α −0.033 ns −0.332* 0.351* −0.375* 0.005 ns 0.022 ns −0.230 ns 0.189 ns −0.342* 0.217 ns 0.082 ns Pmax 0.178 ns −0.108 ns 0.324* −0.036 ns 0.103 ns 0.100 ns −0.065 ns −0.037 ns −0.233 ns 0.143 ns −0.003 ns Isat −0.057 ns −0.359* 0.157 ns −0.278 ns 0.189 ns −0.202 ns −0.377* −0.227 ns −0.460** 0.031 ns −0.313* Ic −0.064 ns −0.143 ns −0.324* 0.164 ns −0.008 ns −0.336* −0.174 ns −0.323* −0.071 0.017 ns −0.150 ns RD 0.025 ns −0.234 ns −0.195 ns 0.204 ns 0.057 ns −0.190 ns −0.150 ns −0.243 ns −0.005 ns 0.156 ns 0.036 ns Rd 0.097 ns 0.161 ns −0.477** 0.101 ns 0.003 ns −0.129 ns 0.071 ns −0.354* 0.133 ns −0.043 ns −0.114 ns Vcmax −0.021 ns −0.097 ns 0.009 ns 0.106 ns 0.188 ns 0.019 ns −0.161 ns 0.172 ns −0.003 ns 0.139 ns 0.200 ns Jmax −0.086 ns −0.169 ns −0.104 ns −0.047 ns −0.035 ns −0.188 ns −0.183 ns −0.003 ns −0.212 ns 0.403** 0.246 ns TPU −0.033 ns −0.145 ns −0.209 ns 0.012 ns 0.045 ns −0.008 ns 0.015 ns −0.162 ns 0.045 ns 0.245 ns 0.183 ns Γ* −0.210 ns 0.181 ns −0.086 ns −0.159 ns −0.239 ns 0.228 ns 0.119 ns −0.163 ns 0.104 ns −0.285 ns −0.276 ns gi 0.207 ns −0.433* 0.311 ns −0.092 ns 0.371 ns −0.071 ns −0.420* −0.006 ns −0.301 ns −0.149 ns −0.301 ns Ci −0.066 ns 0.108 ns −0.396** 0.257 ns −0.125 ns −0.164 ns 0.187 ns −0.053 ns 0.311* −0.080 ns 0.077 ns gs 0.140 ns −0.111 ns 0.278 ns 0.073 ns 0.044 ns 0.146 ns 0.053 ns 0.005 ns −0.085 ns 0.174 ns 0.116 ns VPD −0.023 ns 0.071 ns −0.372* 0.281 ns −0.143 ns −0.230 ns 0.106 ns −0.063 ns 0.221 ns 0.052 ns 0.148 ns A 0.157 ns −0.079 ns 0.346* 0.007 ns 0.049 ns 0.203 ns 0.047 ns 0.048 ns −0.117 ns 0.149 ns 0.094 ns E 0.196 ns −0.057 ns 0.224 ns 0.191 ns 0.031 ns 0.068 ns 0.106 ns 0.002 ns 0.003 ns 0.164 ns 0.158 ns WUE 0.049 ns −0.115 ns 0.350* -0.230 ns 0.184 ns 0.226 ns -0.142 ns 0.041 ns -0.216 ns 0.074 ns -0.038 ns LT – leaf thickness, UCT – upper cuticle thickness, UET – upper epidermal thickness, PT – palisade tissue thickness, ST – spongy tissue thickness, LET – lower epidermal thickness, LCT – lower cuticle thickness, w – guard cell width, l – guard cell length, d – stomatal density, TSP – total stomach pore area. Ns = non-significant. *, ** represent significant; highly significant differences at 5% and 1% probability levels, respectively. Table 2.
The correlation between leaf anatomical traits and photosynthetic parameters.
-
Anatomical traits Direct effects Indirect effects Pearson's correlation Comprehensive score Ranking Comprehensive score Ranking Comprehensive score Ranking LT 0.160 1 −0.127 8 0.033 4 UCT −0.175 9 0.055 2 −0.121 9 UET −0.025 6 0.063 1 0.038 3 PT −0.010 5 −0.003 5 −0.013 6 ST −0.009 4 0.052 3 0.043 2 LET 0.132 2 −0.151 9 −0.020 7 LCT −0.048 8 −0.029 7 −0.077 8 d 0.095 3 −0.024 6 0.072 1 TSP −0.043 7 0.041 4 −0.002 5 LT – leaf thickness, UCT – upper cuticle thickness, UET – upper epidermal thickness, PT – palisade tissue thickness, ST – spongy tissue thickness, LET – lower epidermal thickness, LCT – lower cuticle thickness, w – guard cell width, l – guard cell length, d – stomatal density, TSP – total stomach pore area. Table 3.
Comprehensive ordering of the effects of leaf anatomical traits on photosynthetic capacity using the CRITIC method.
Figures
(4)
Tables
(3)