-
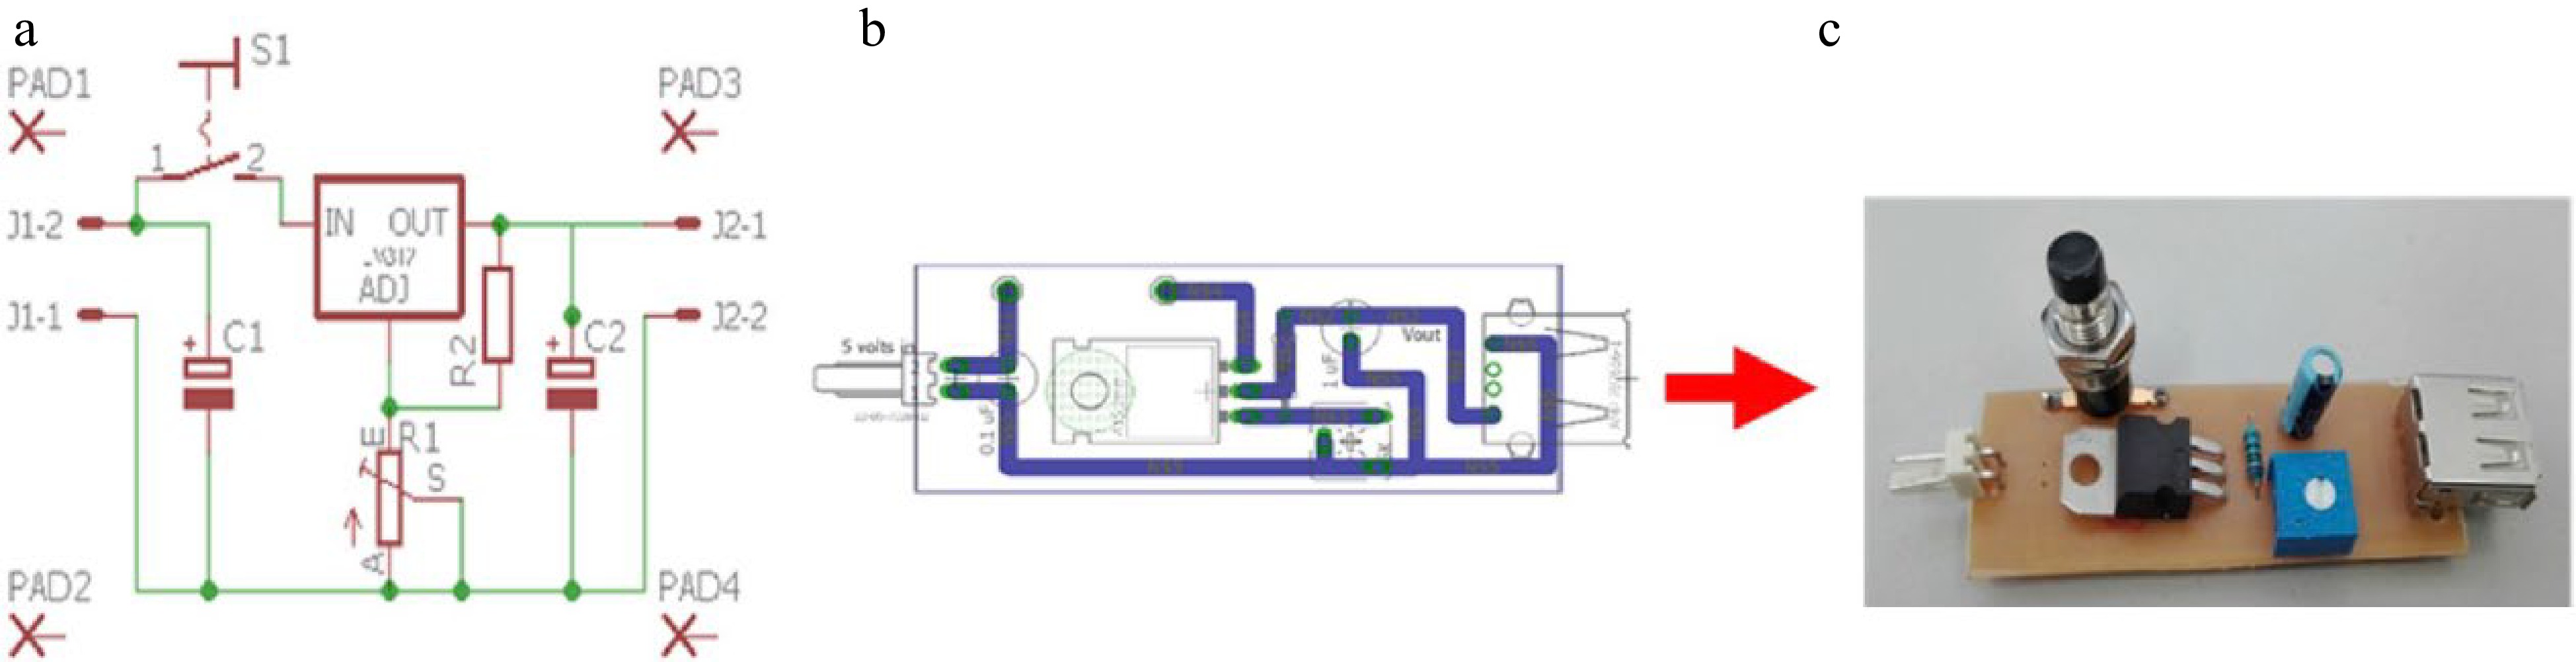
Figure 1.
Fluorimetric system adjustable voltage source. (a) Schematic figure created with the Eagle program. (b) Board figure created with Eagle. (c) Photo of the electronic device.
-
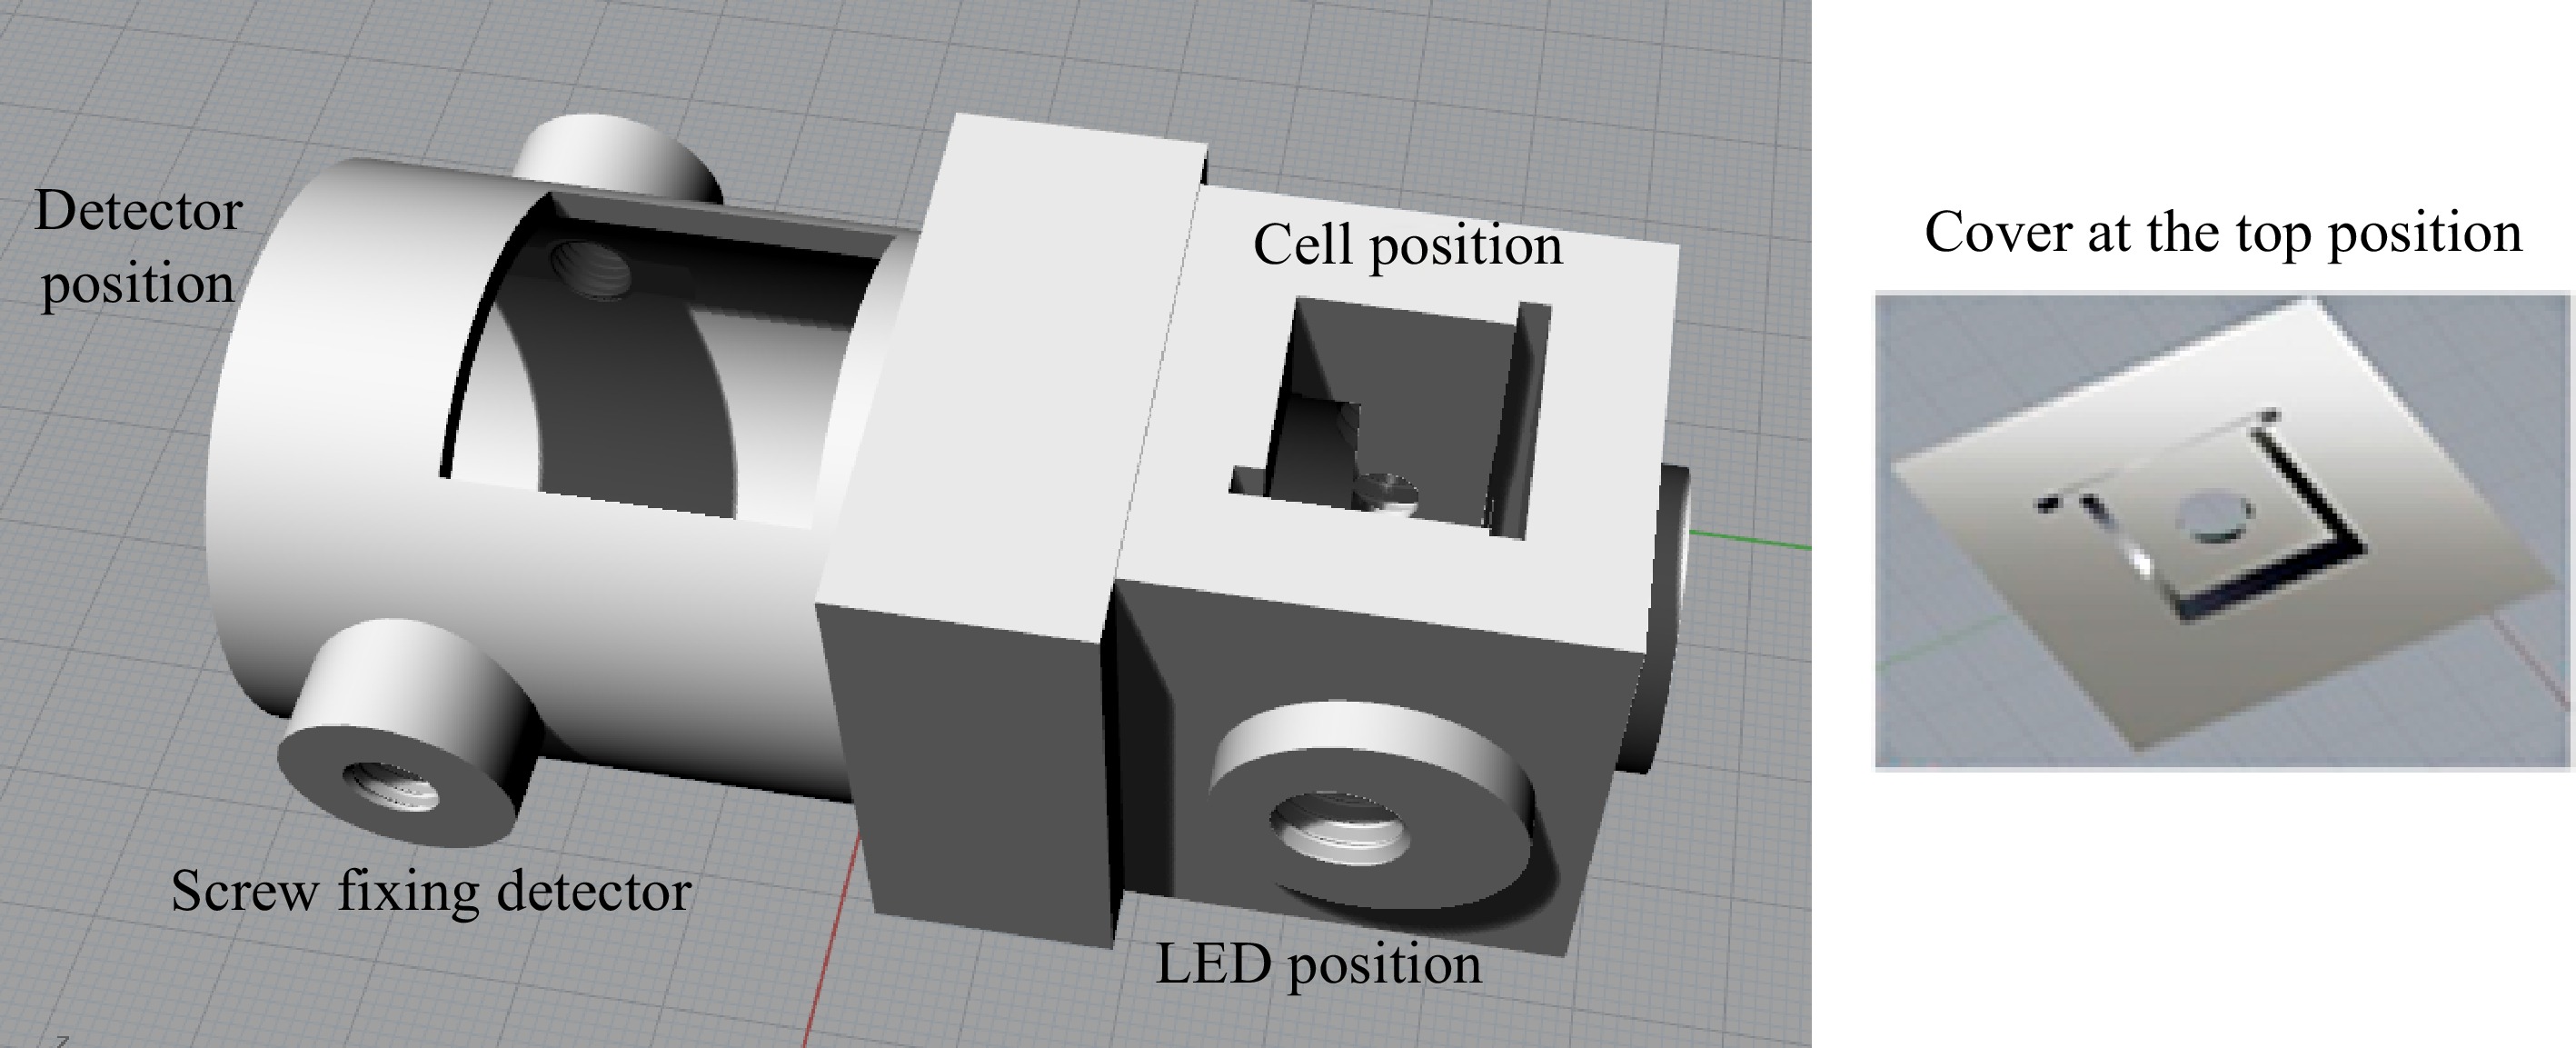
Figure 2.
Design of the 3D device using the fluorimetric system, elaborated with the aid of the Rhinoceros 5 program.
-
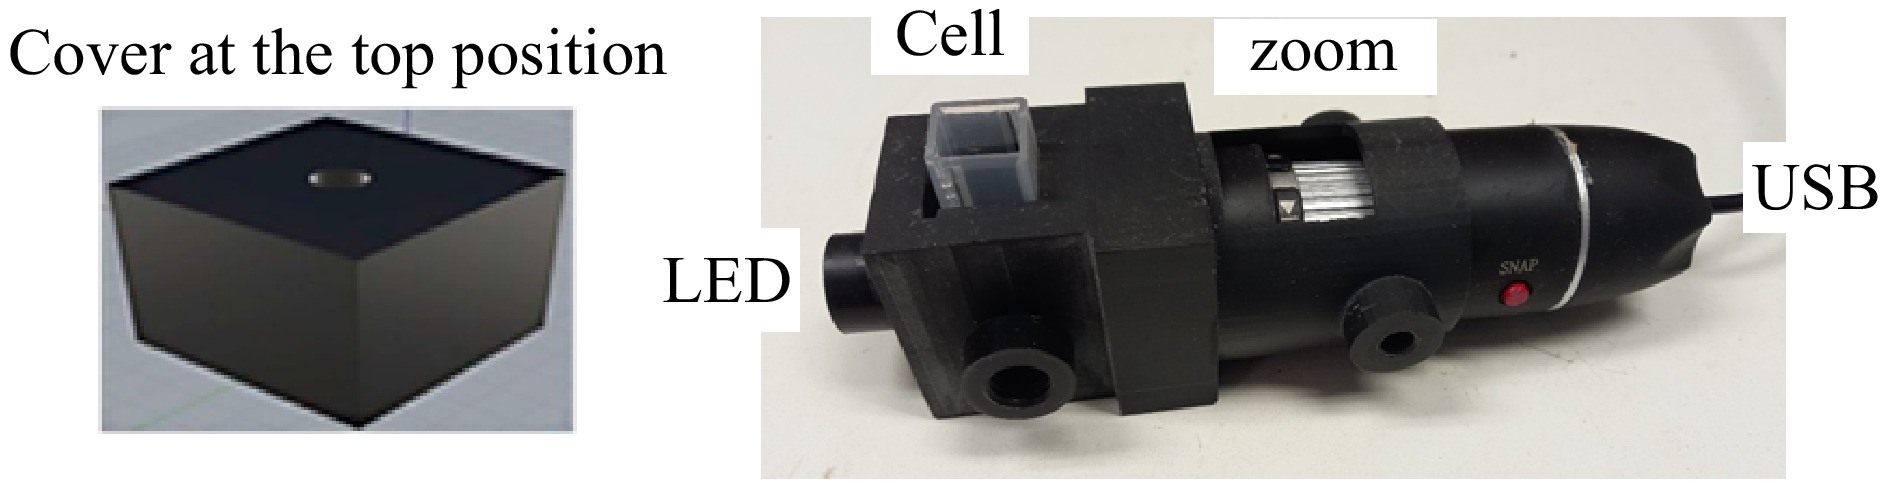
Figure 3.
Photograph of the 3D fluorimetric system.
-
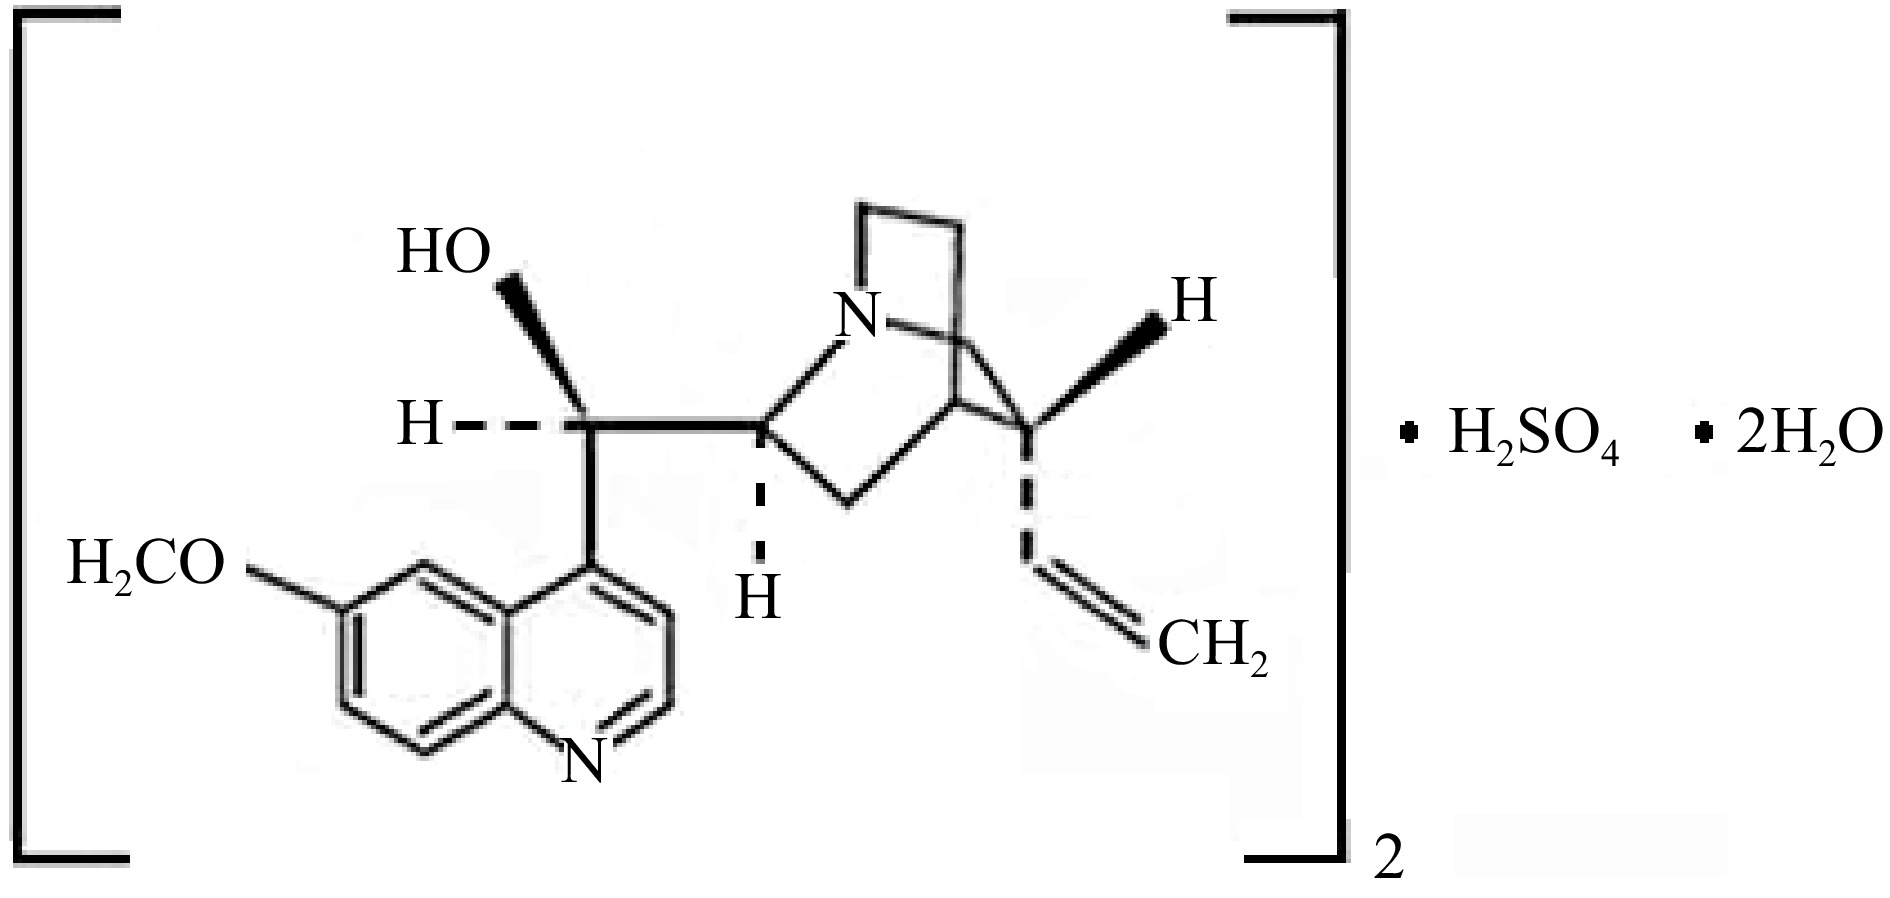
Figure 4.
Structure of quinine sulfate in diluted H2SO4 solutions.
-
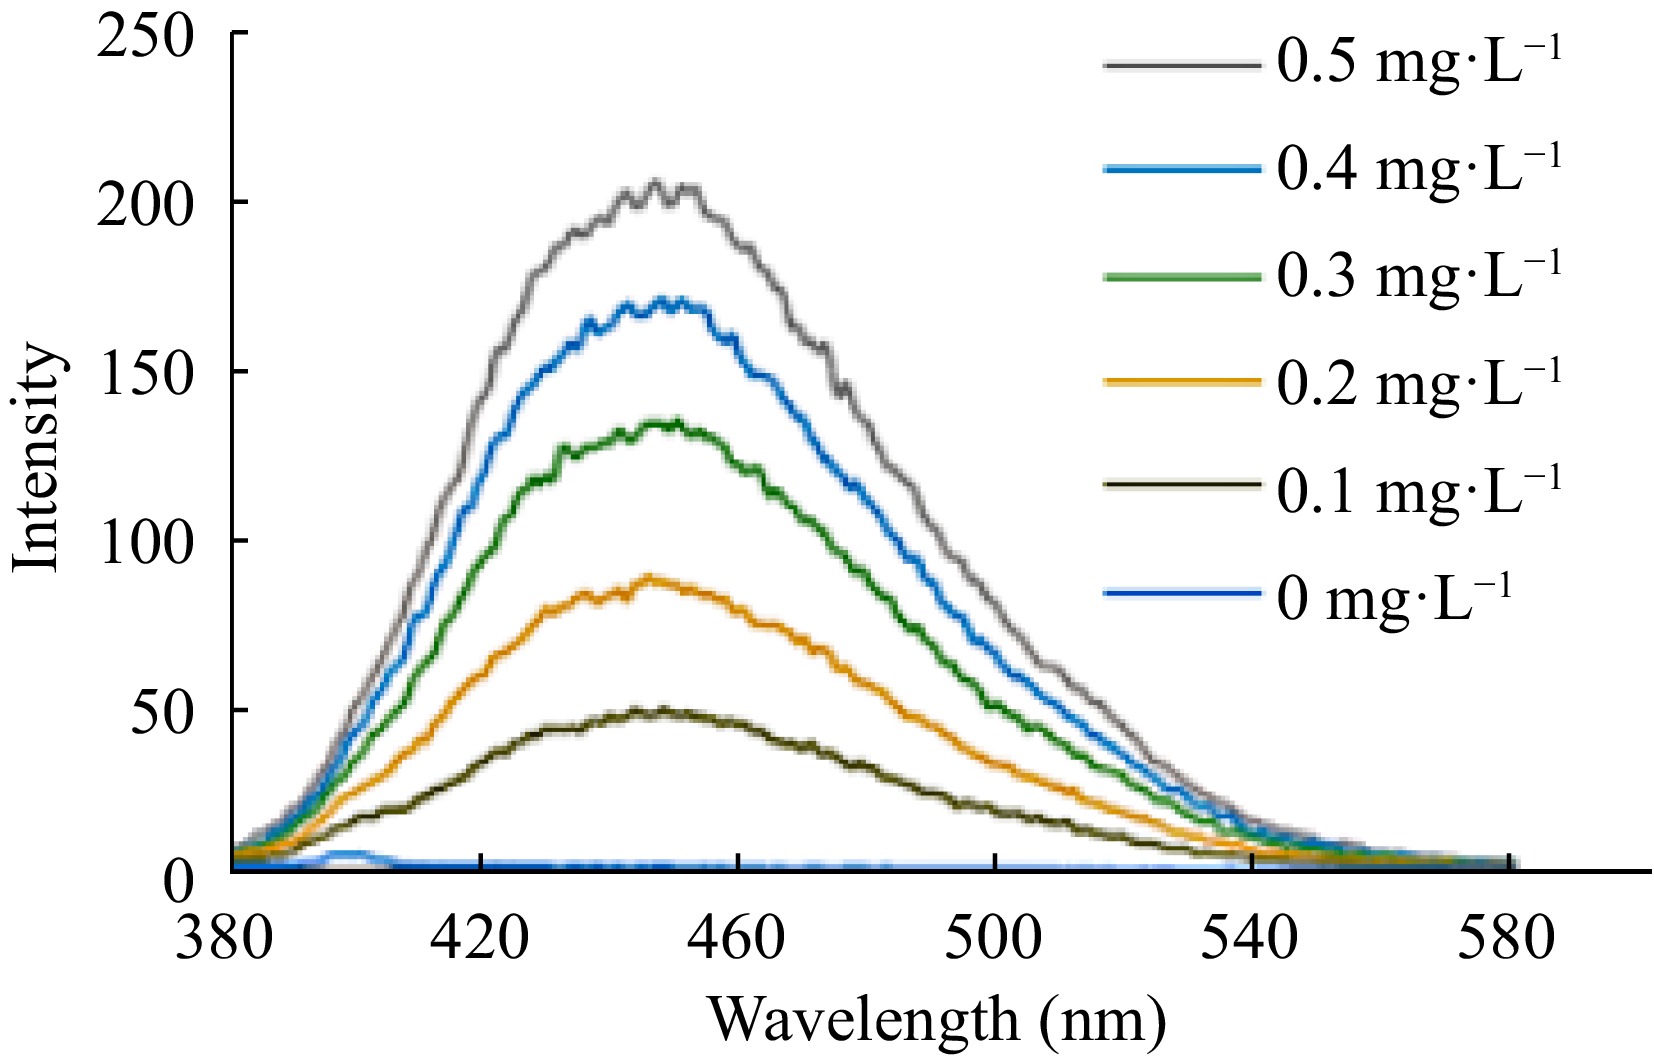
Figure 5.
Emission spectra of quinine.
-
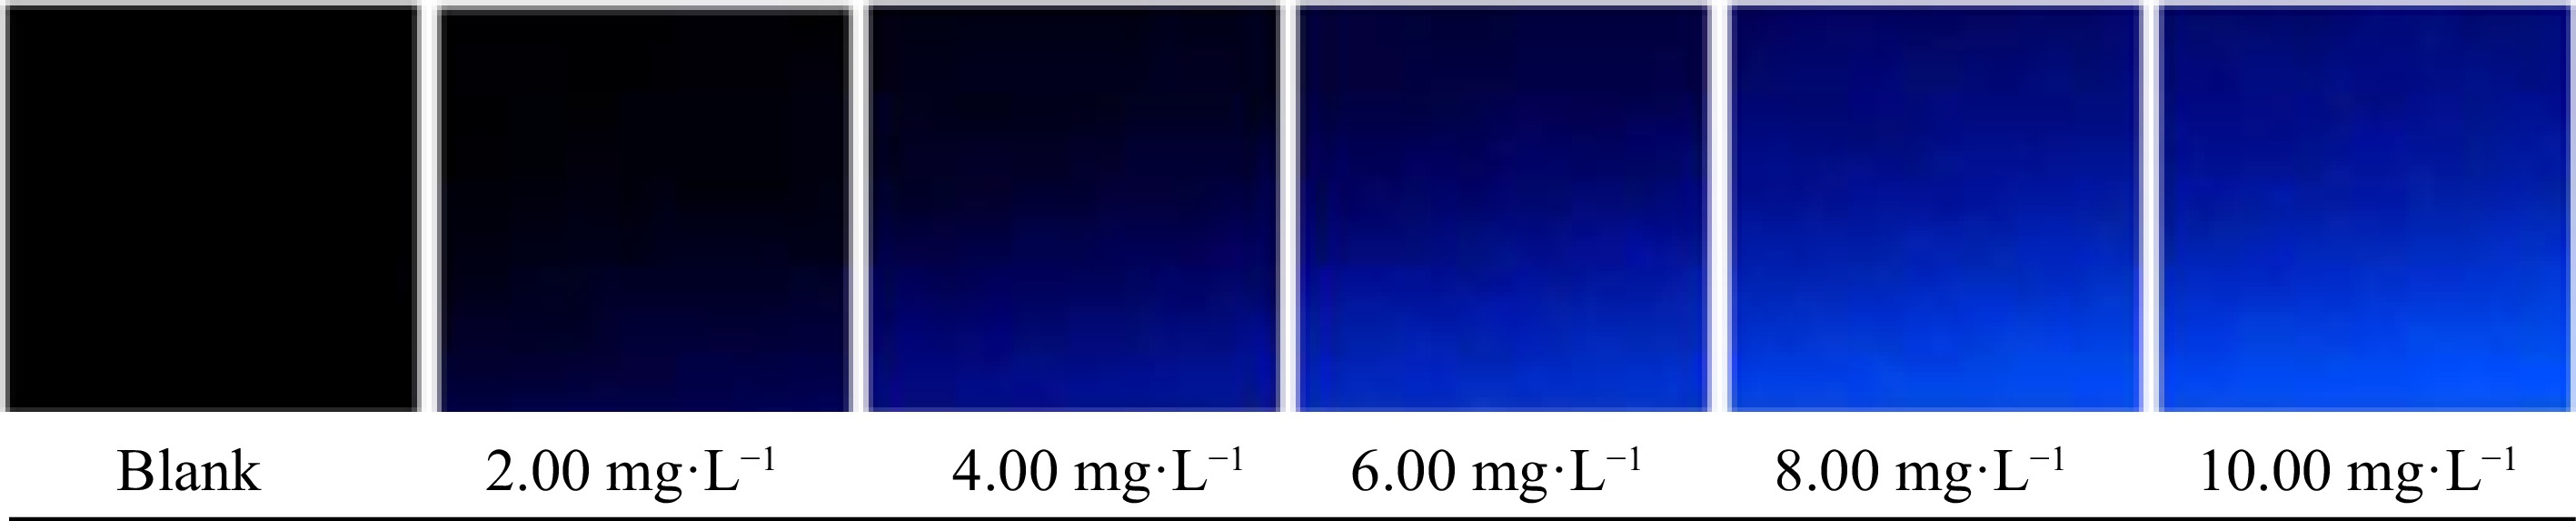
Figure 6.
Digital images of the blank and analytical standards.
-
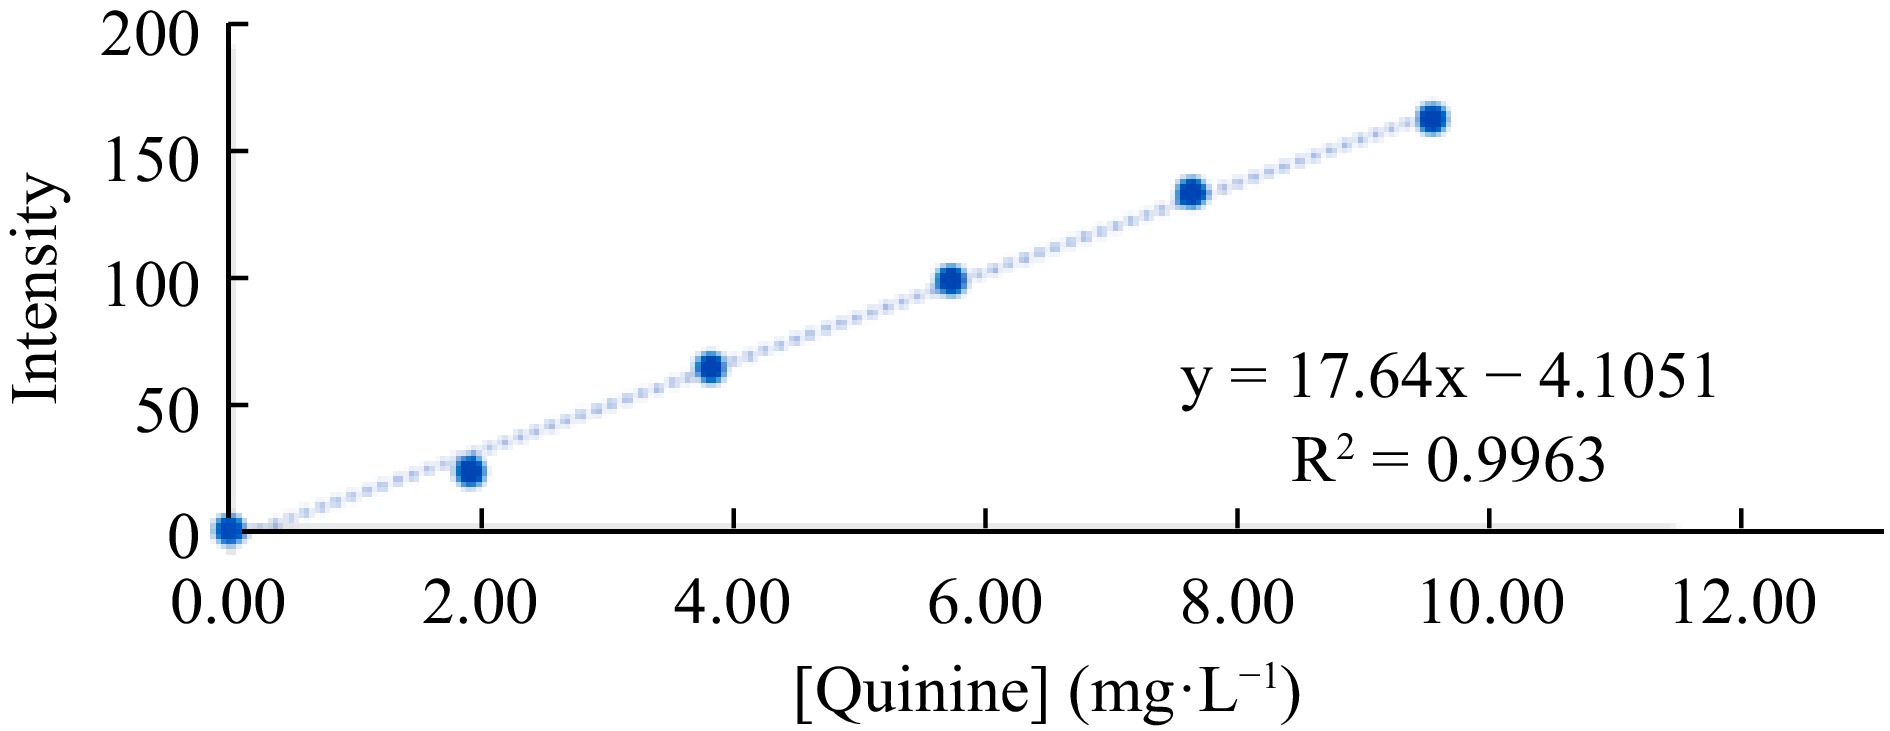
Figure 7.
Analytical curve for quinine determination, constructed from the blue channel intensity values.
-
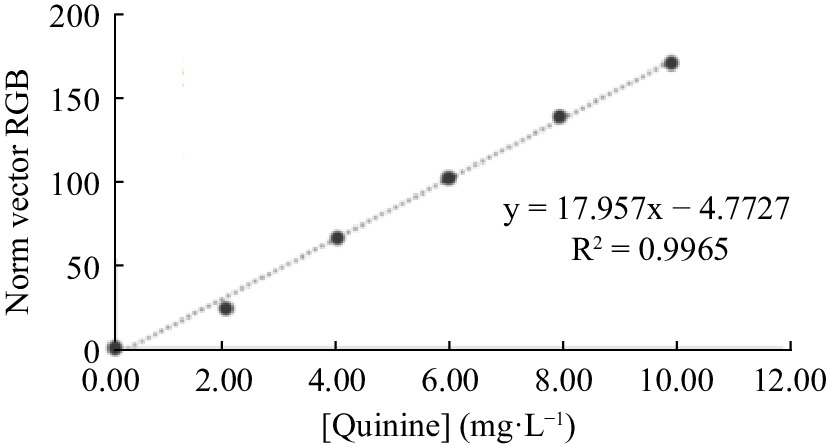
Figure 8.
Analytical curve for quinine determination, built from the mathematical processing standard vector of RGB intensities values.
-
Quinine/H2SO4 0.05 mol L−1
(mg L−1)R G B 0 (Blank) 0 0 0 0 (Blank) 0 0 0 0 (Blank) 0 0 0 2 0.29 0.26 24.25 2 0.5 0.26 23.6 2 0.42 0.24 24.31 4 0.6 2.65 66.73 4 0.57 2.92 66.87 4 0.64 3.04 67.99 6 0.6 10.01 104.05 6 0.67 9.56 102.35 6 0.66 9.67 103.41 8 0.67 20.74 139.35 8 0.65 20.84 139.99 8 0.65 20.73 139.73 10 0.66 34.5 170.52 10 0.65 34.54 169.93 10 0.68 34.19 170.65 R: red; G: green; B: blue. Table 1.
Mean RGB intensities for blanks and analytical standards in triplicate.
-
Sample Repetitions (mg·L−1) DRP% Sample F 4.82 4.73 4.8 4.91 4.86 4.8 4.88 4.87 4.88 1.15 Sample G 5.49 5.54 5.39 5.54 5.39 5.46 5.5 5.56 5.52 1.13 Table 2.
Accuracy of the method verified in terms of DRP%.
-
Sample Proposed method
(mg/100 g)Luminescence PerkinElmer
LS-50B (452 nm) (mg/100 g)A 55.0 ± 0.19 55.1 ± 0.01 B 64.3 ± 0.02 64.2 ± 0.02 C 47.8 ± 0.22 47.9 ± 0.02 Table 3.
Accuracy of the proposed method.
-
Sample [Quinine] ± SD (mg·L−1) A 54.68 ± 0.29 B 64.82 ± 0.24 C 66.72 ± 0.23 D 49.38 ± 0.38 E 63.66 ± 0.25 F 48.20 ± 0.40 G 47.77 ± 0.43 Table 4.
Quinine contents in commercial samples of tonic water, obtained in the application of the proposed method.
Figures
(8)
Tables
(4)