-
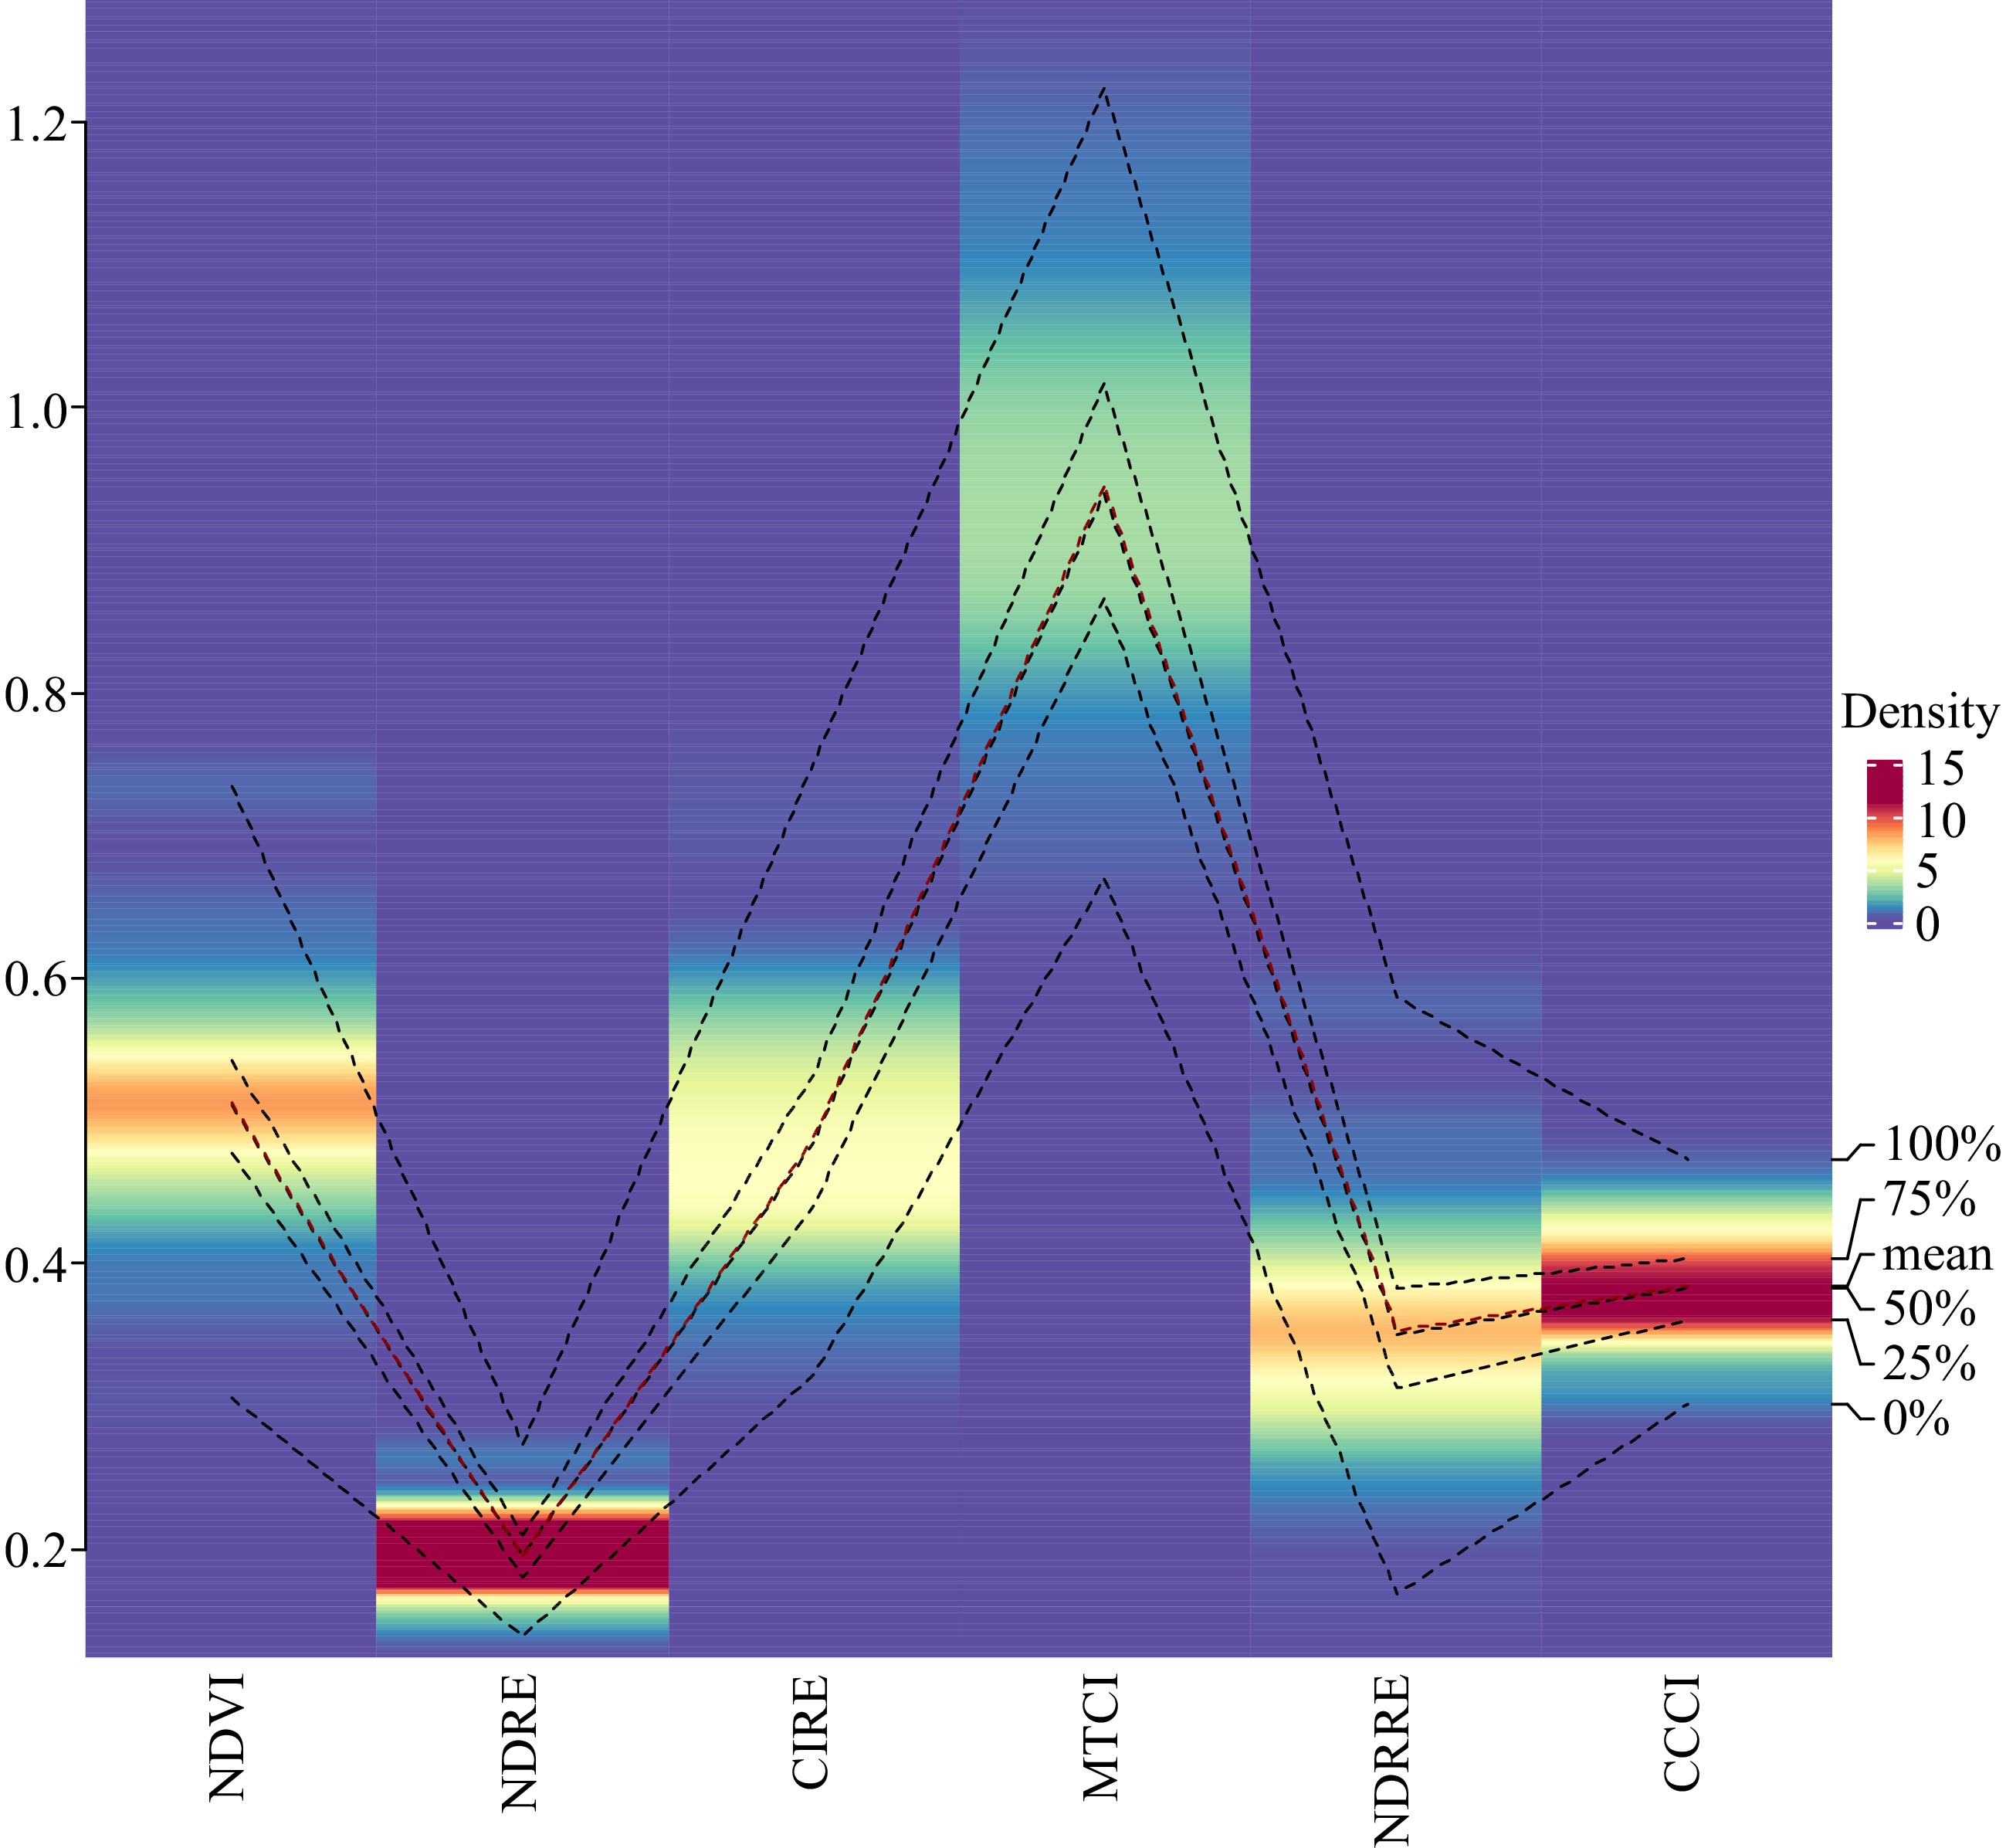
Figure 1.
Density heatmap of the range of indices used to evaluate 50 turf type bermudagrass genotypes.
-
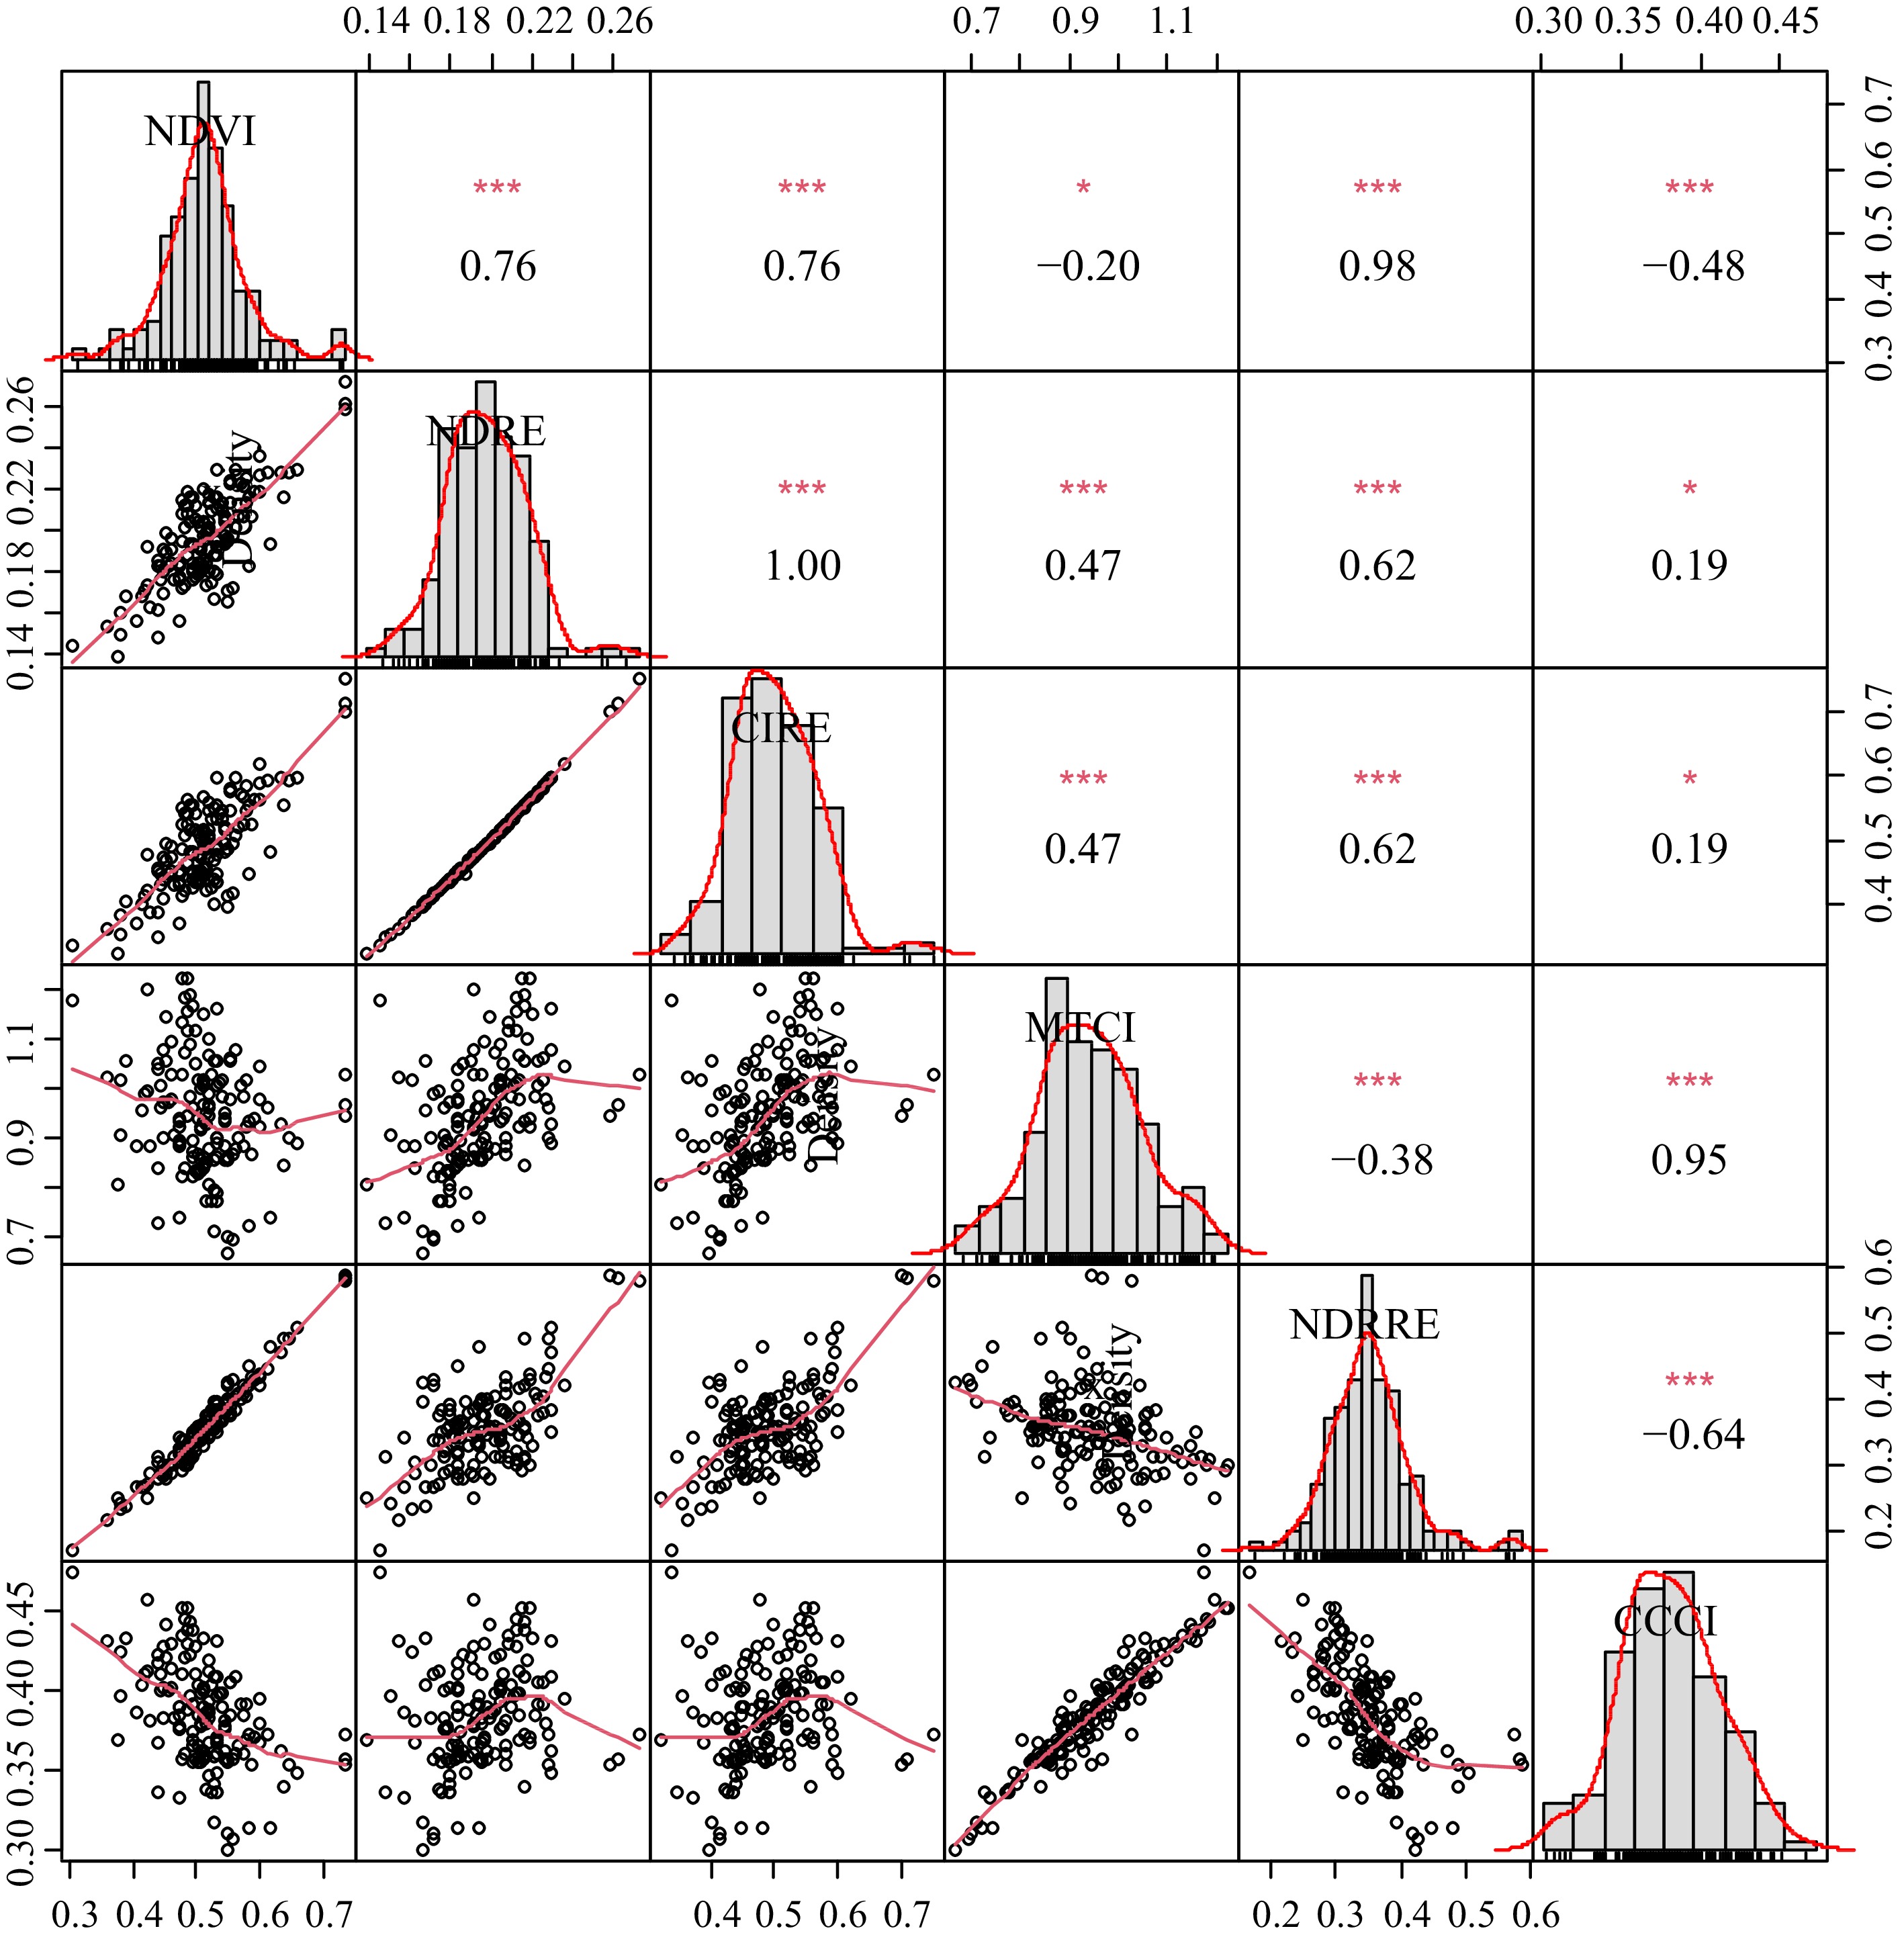
Figure 2.
Scatter plots, frequency distributions, and correlations among the six spectral reflectance indices used to evaluate 50 hybrid bermudagrass genotypes for genetic variation based on canopy reflectance at different wavelengths.
-
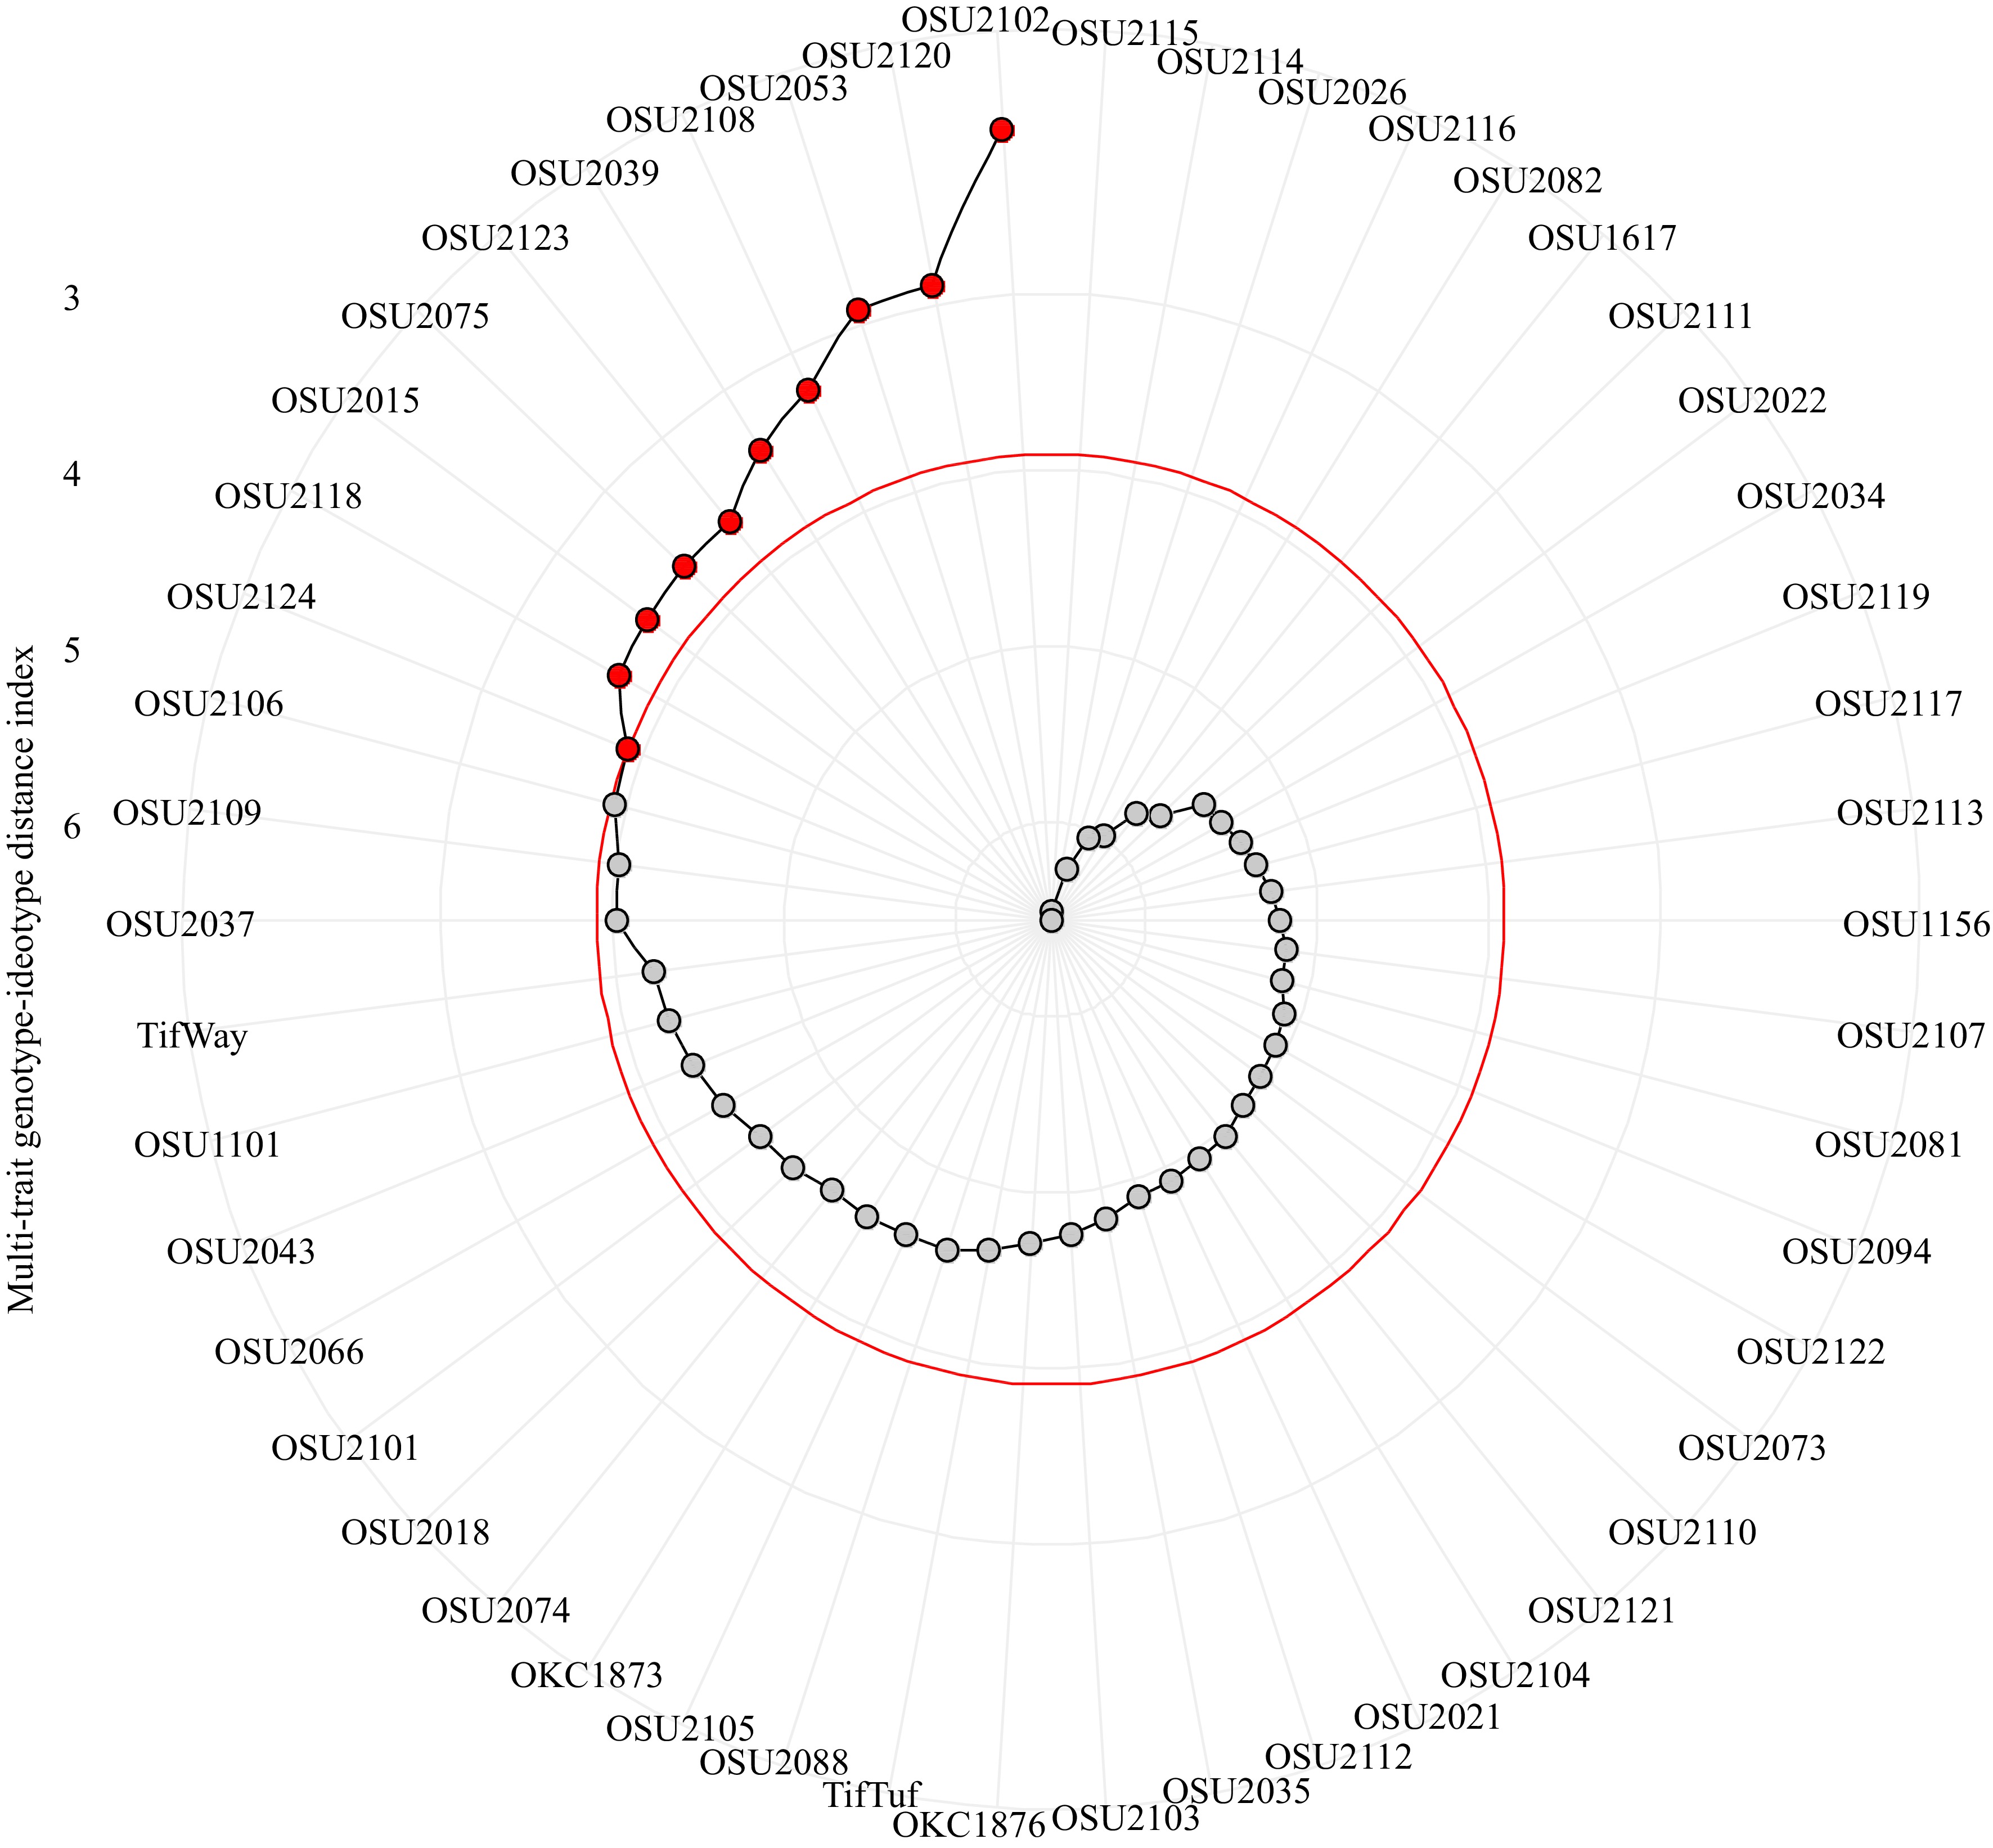
Figure 3.
Genotype rankings for multi-trait genotype-ideotype distance index (MGIDI). The selected genotypes based on MGIDI index are shown in red.
-
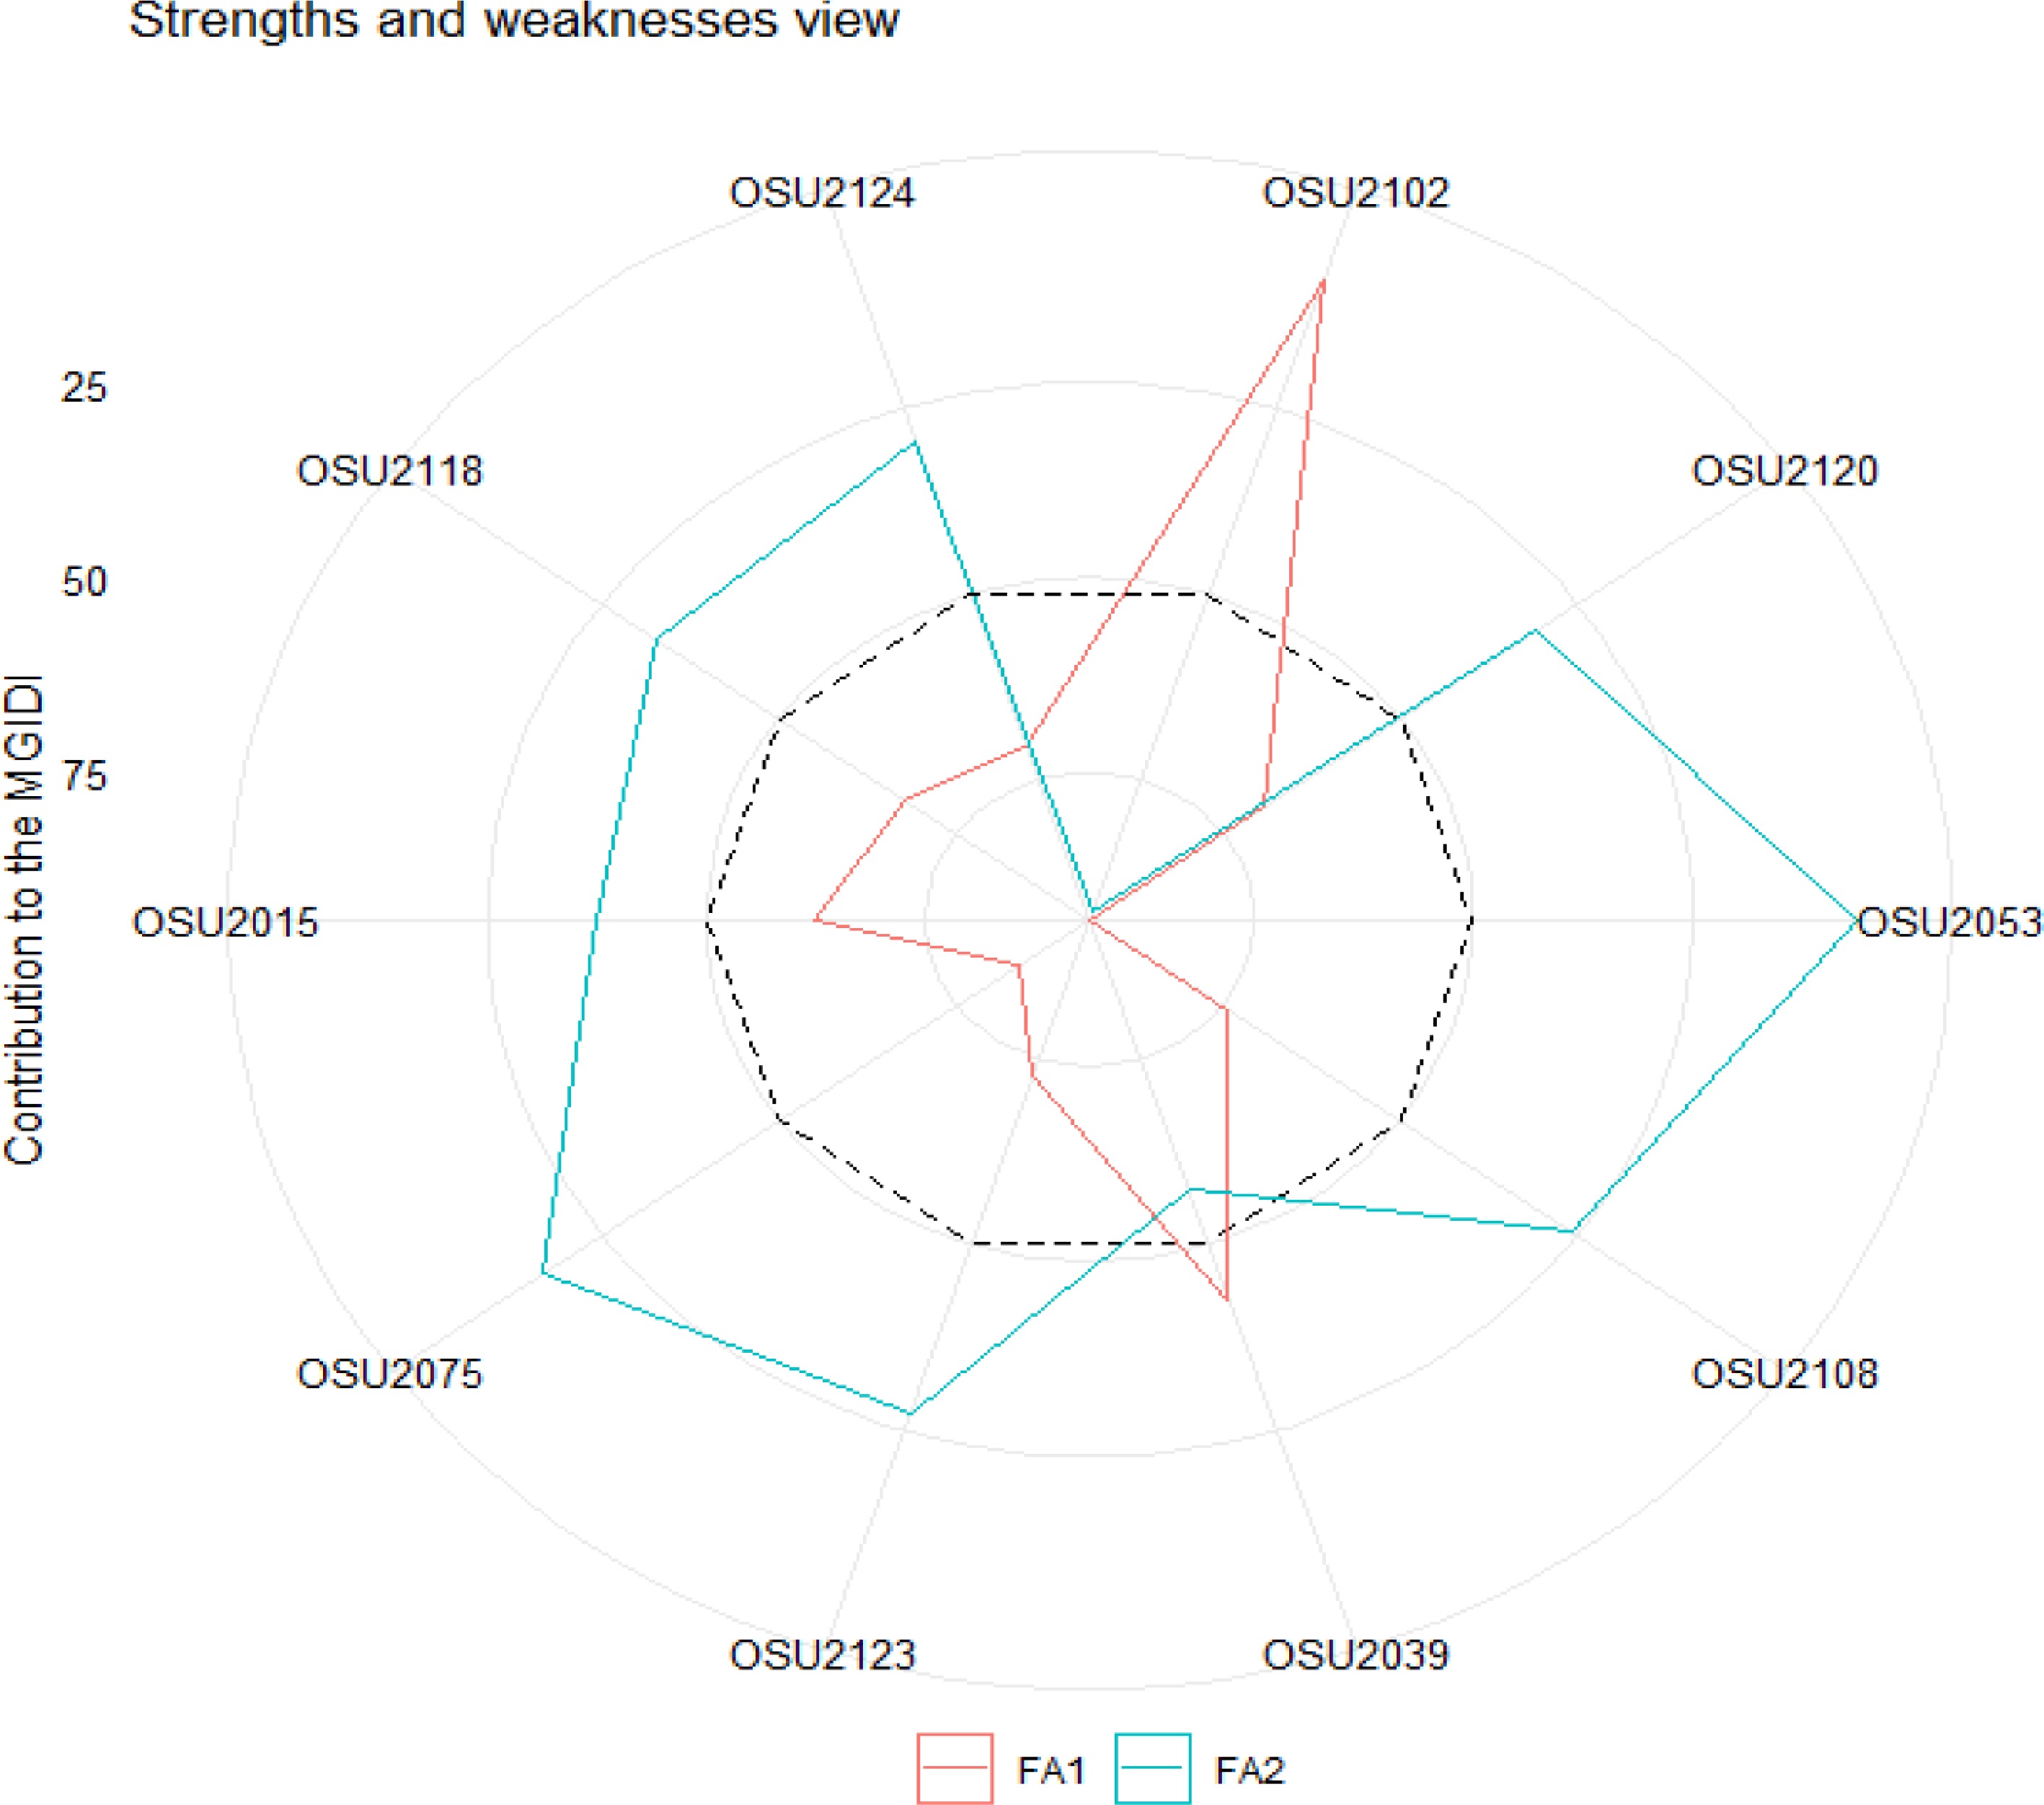
Figure 4.
The strength and weakness view of the selected genotypes with the proportion of the contributing factors to the computed multi-trait genotype-ideotype distance index (MGIDI). The dashed line represents the average of the two factors (FA1 and FA2).
-
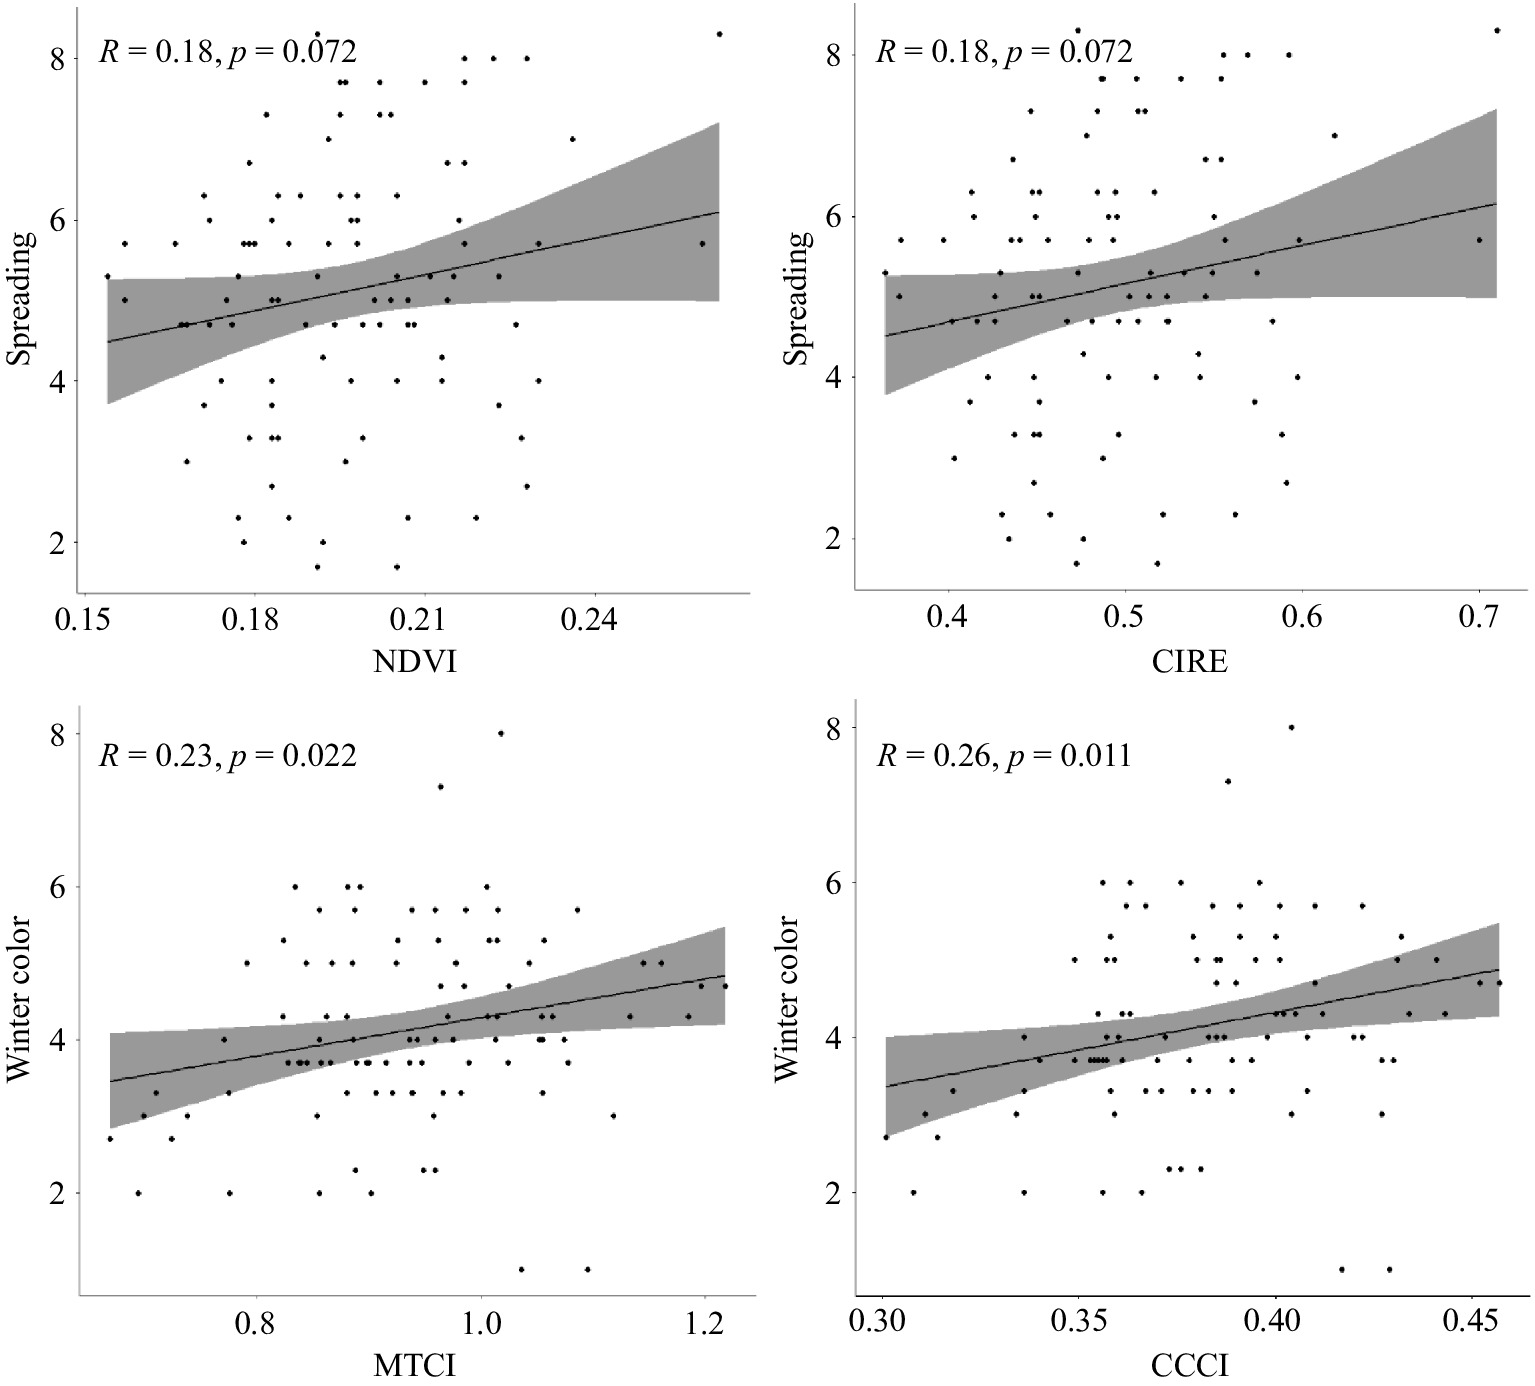
Figure 5.
Correlation of spectral indices related to photosynthetic area and chlorophyll content with establishment and winter color retention in bermudagrass hybrids. Only four out of six spectral vegetation index (SVI) are presented here.
-
Spectral reflectance indices Formula References Normalized difference vegetation index (NDVI) (R780 − R670)/
(R780 + R670)[46] Normalized difference red edge index (NDRE) (R780 − R730)/
(R780 + R730)[47] The chlorophyll index using red edge (CIRE) (R780/R730) −1 [48] Normalized difference vegetation index-Red-Red edge (NDRRE) (R730 − R670)/
(R730 + R670)[49] The MERIS terrestrial chlorophyll index (MTCI) (R780 − R730)/
(R730 − R670)[50] Canopy chlorophyll content index (CCCI) NDRE/NDVIR [51] Table 1.
Published formulae for different spectral vegetation indices used in the study.
-
Source DF Mean squares NDVI NDRE CIRE NDRRE MTCI CCCI Replication 2 0.0023 0.0003 0.0024 0.0035* 0.0341* 0.0025* Genotype 49 0.0107*** 0.0011*** 0.0111*** 0.0105*** 0.0208*** 0.0018*** Error 98 0.0009 0.0002 0.0017 0.0010 0.0091 0.0006 DF = Degree of freedom; NDVI = Normalized difference vegetation index; NDRE = Normalized difference red edge index; CIRE = Chlorophyll index using red edge; NDRRE = Normalized difference vegetation index red-red edge; MTCI = MERIS terrestrial chlorophyll index; and CCCI = Canopy chlorophyll content index; *, **, *** = significant at p = 0.05, 0.01, or 0.001, respectively. Table 2.
Analysis of variance for hybrid bermudagrass spectral reflectance indices calculated using published formulae.
Figures
(5)
Tables
(2)