-
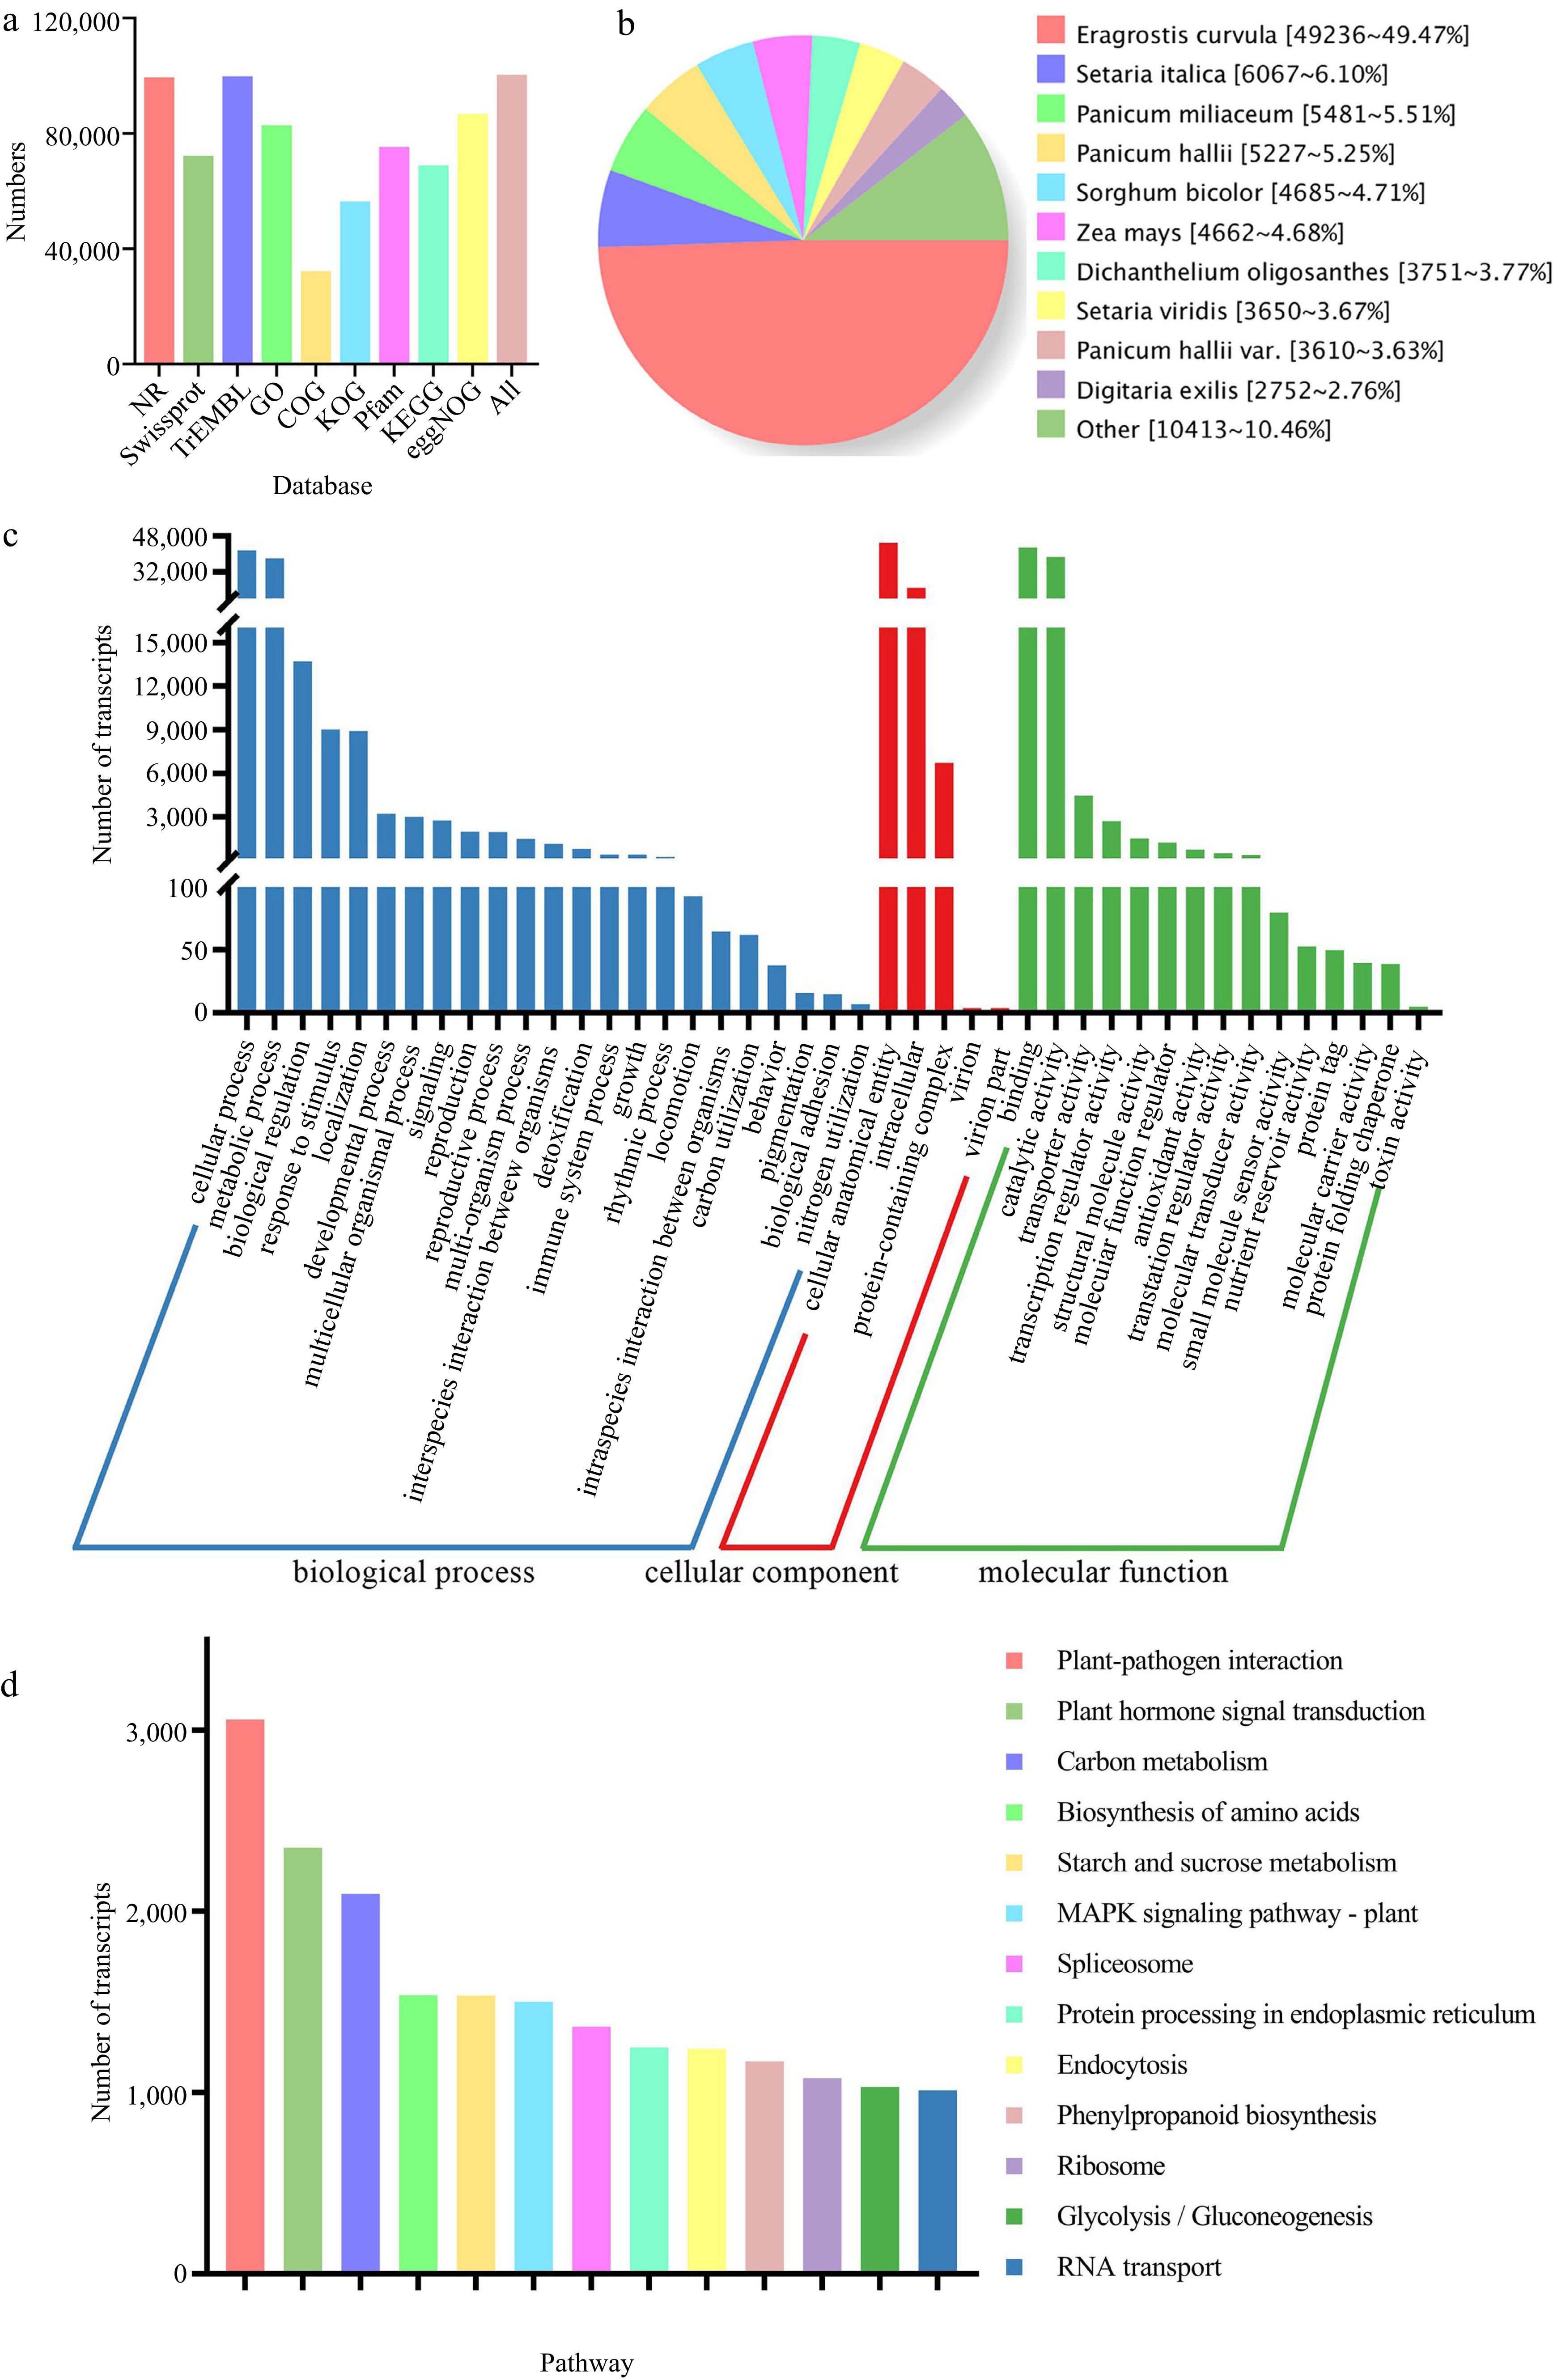
Figure 1.
Function annotation of non-redundant transcripts. (a) Function annotation of transcripts in all databases. (b) Nr homologous species distribution diagram of transcripts. (c) Distribution of GO terms for all annotated transcripts. Transcripts (82,896) were classified into three groups: 'biological process', cellular component', and 'molecular function'. (d) Thirteen KEGG pathways involving more than 1,000 transcripts.
-
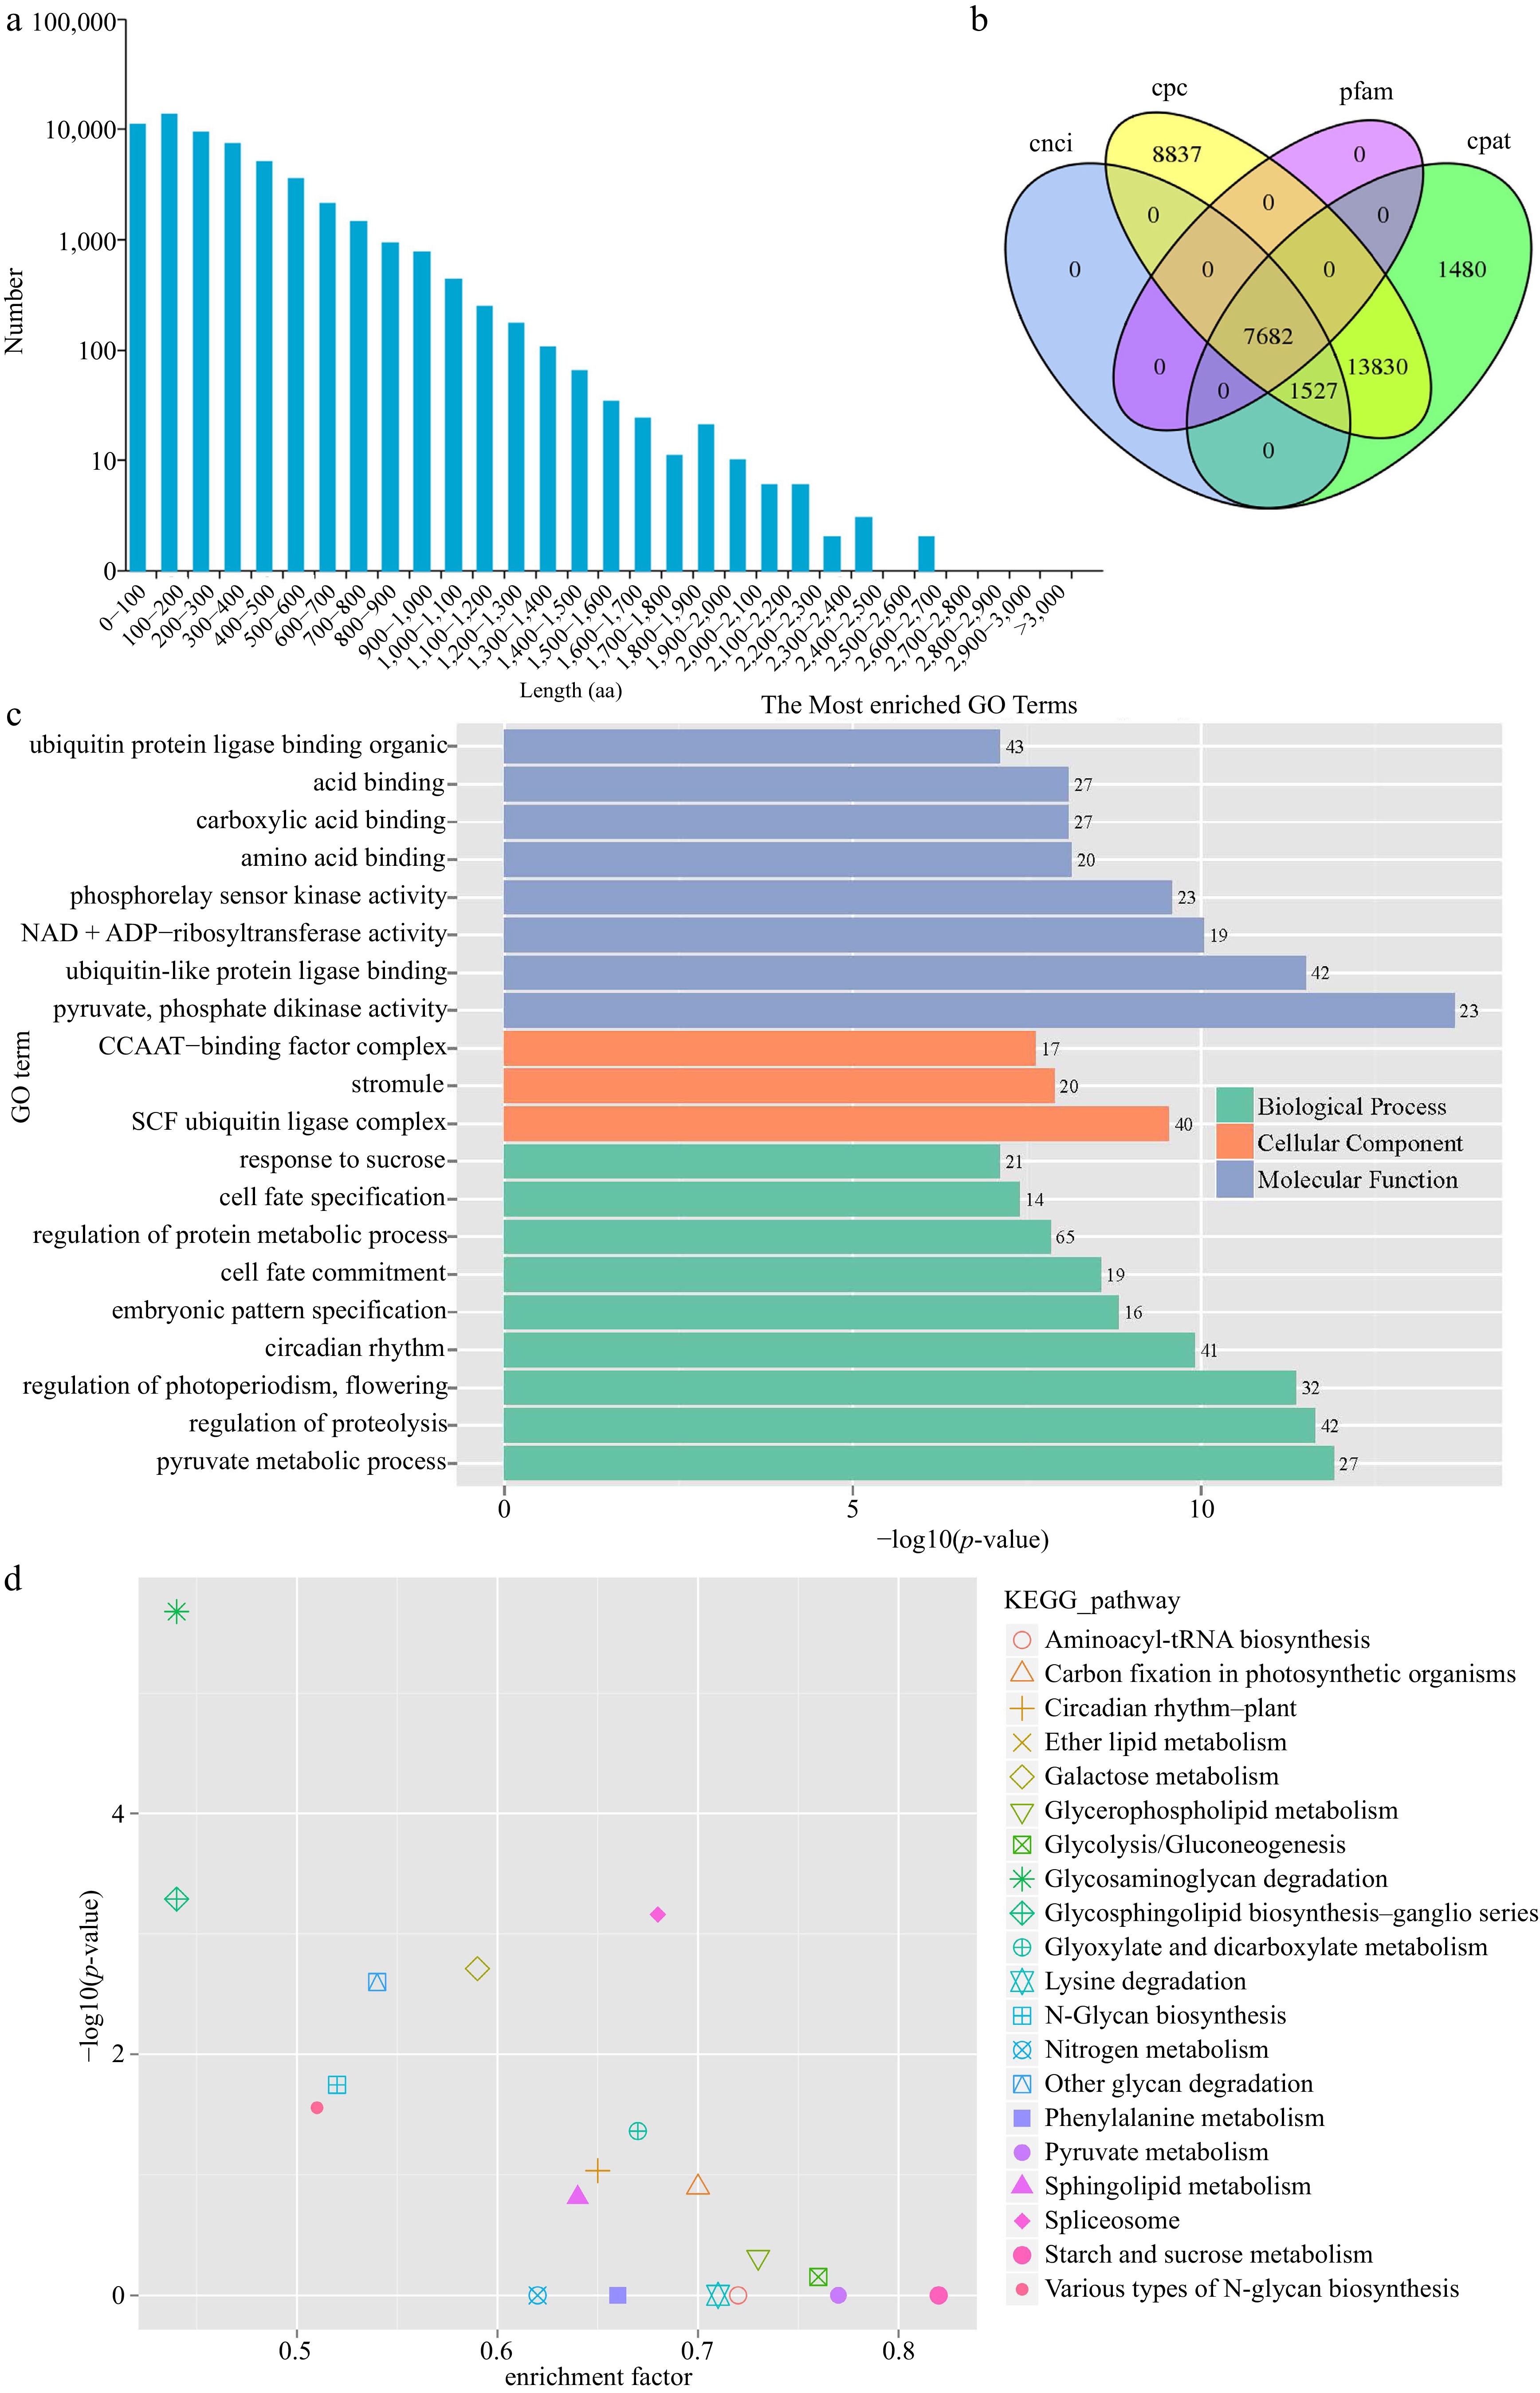
Figure 2.
Structure analysis of full-length transcripts. (a) Length distribution of amino acid sequences in the coding region of ORFs. (b) Venn diagram of lncRNAs predicted by CPC, CPAT, CNCI, and Pfam methods. (c) GO and (d) KEGG enrichment of the transcripts possessed AS events.
-
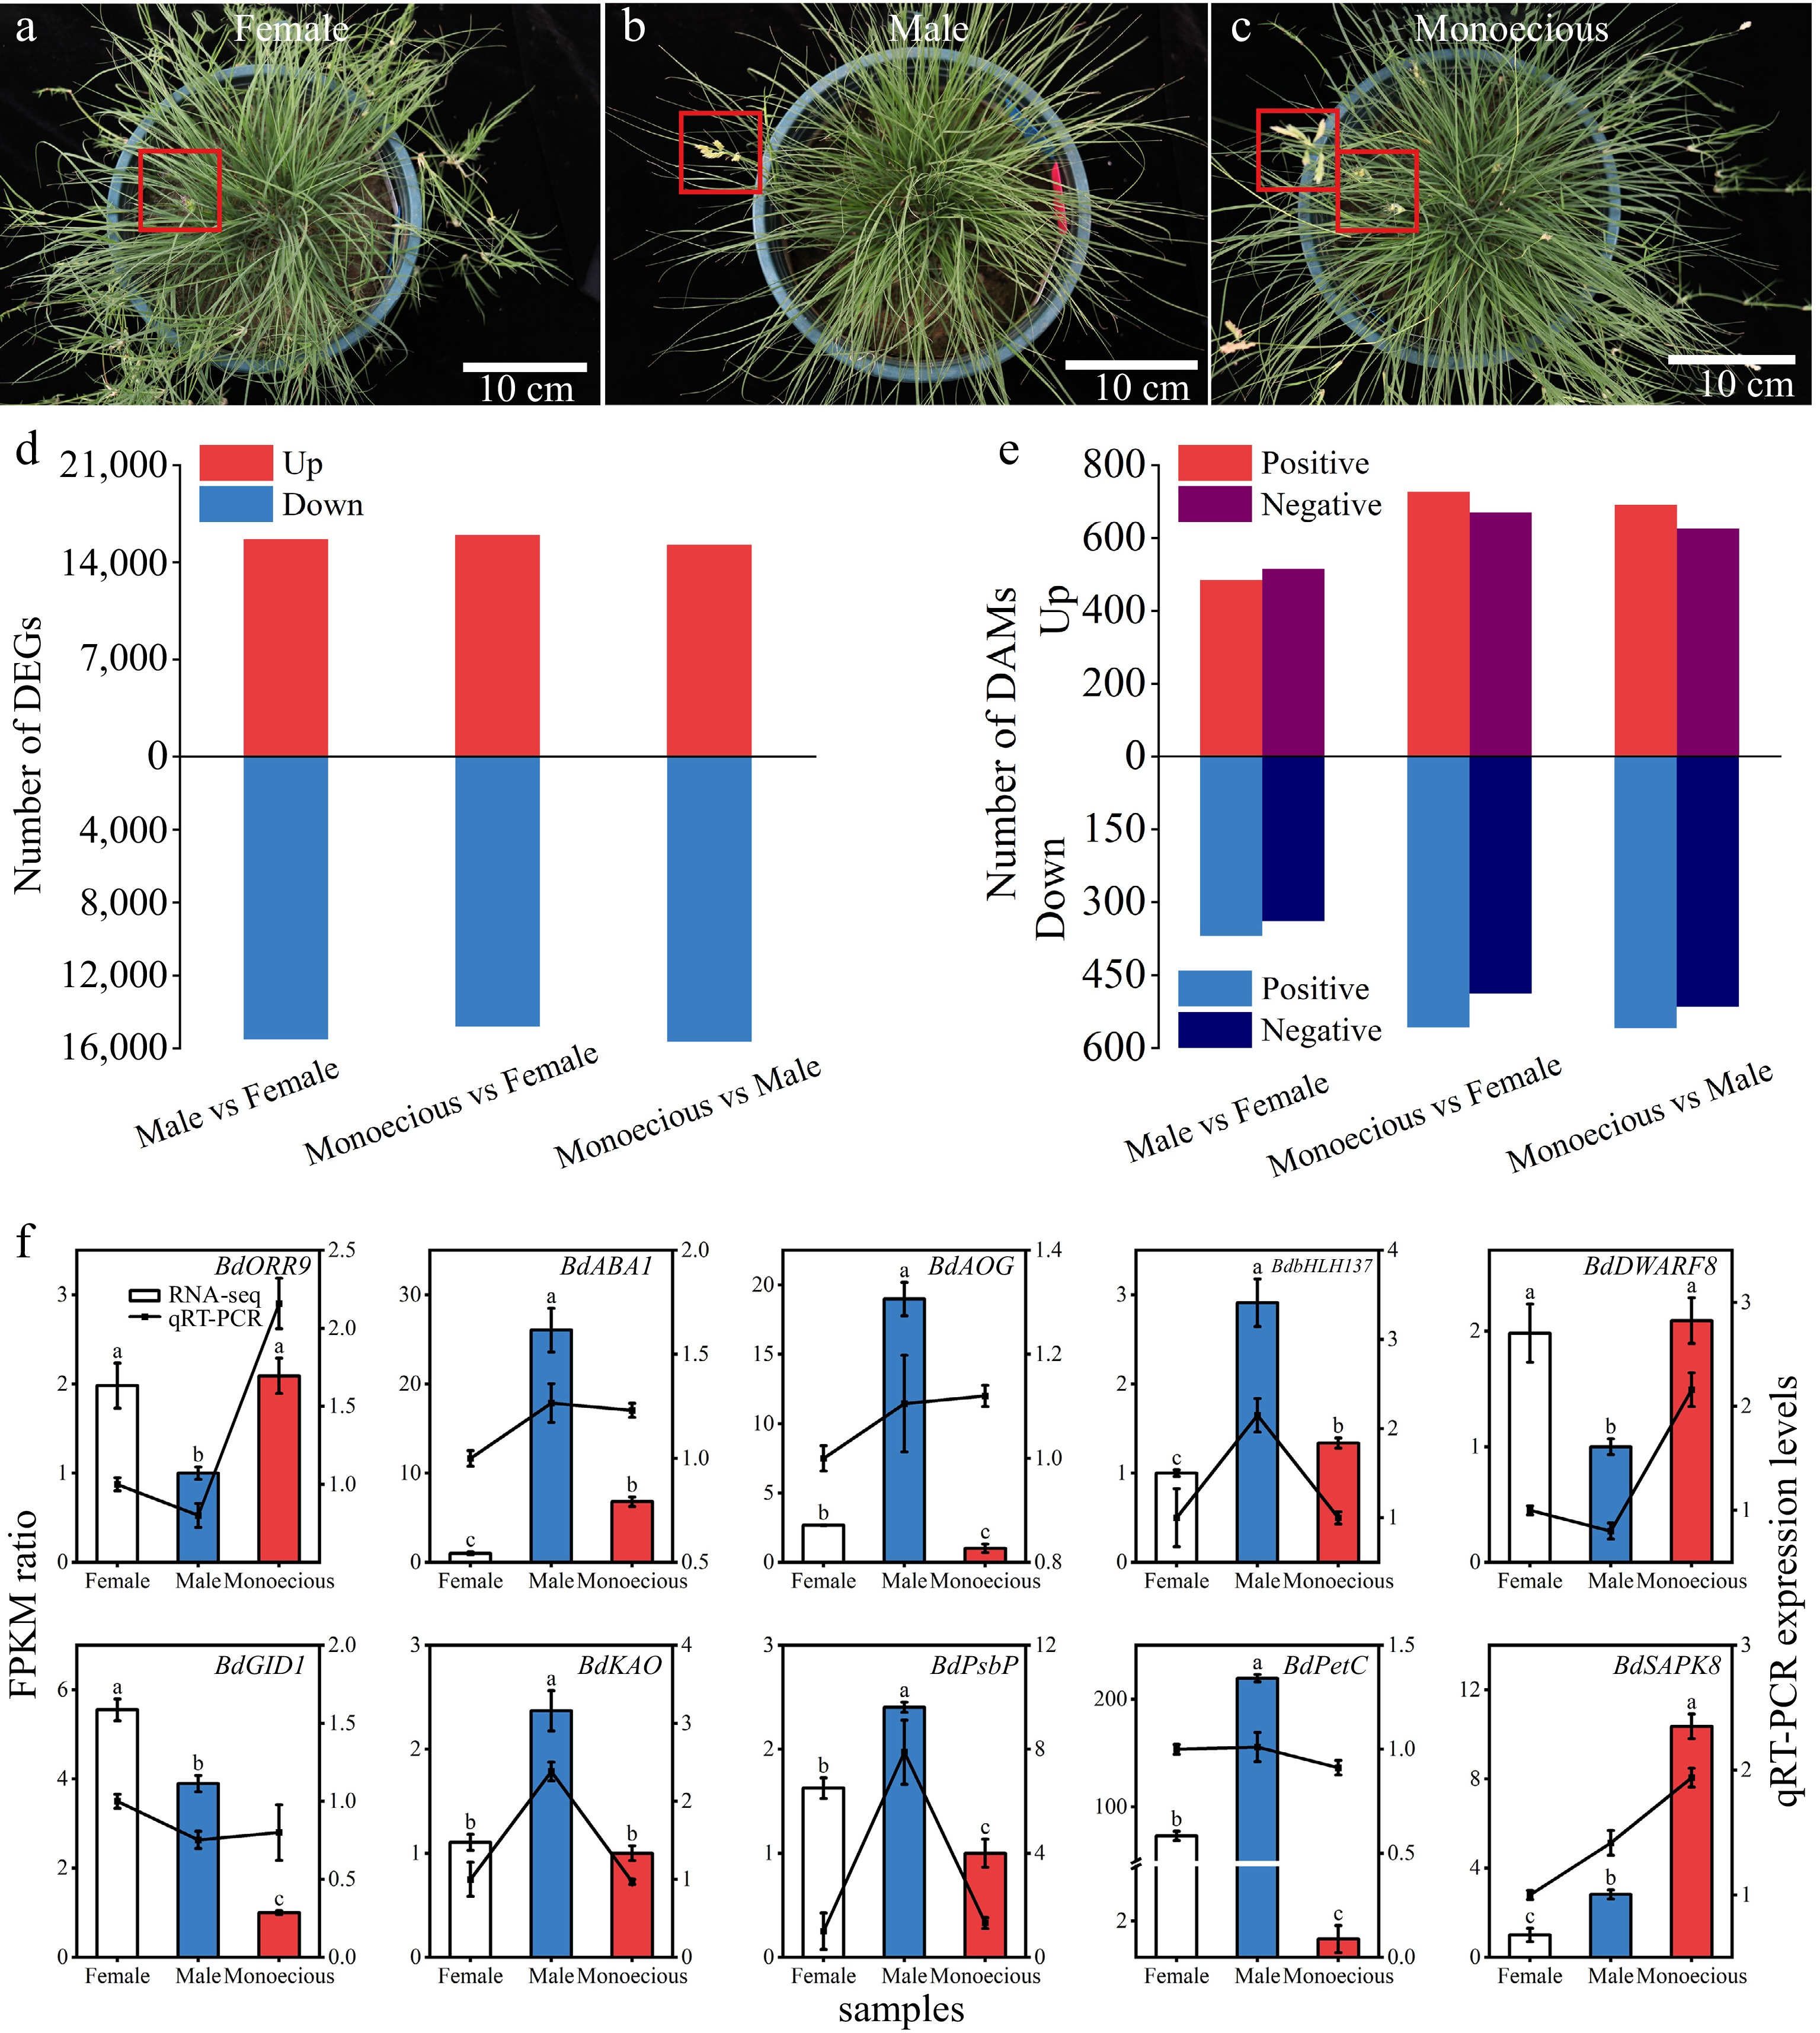
Figure 3.
(a)–(c) Differences in the appearance and the number of (d) DEGs and (e) DAMs between female, male, and monoecious sample groups in B. dactyloides. Red boxes indicate the flower of B. dactyloides. (f) Association analysis between RPKM ratio and relative expression levels of the qRT-PCR. Data represent the mean ± SD (n = 3). Bars represent RNA-seq data, and lines represent qRT-PCR data. The lower-case letters above the bars indicate a significant difference between the sample groups at p < 0.05.
-
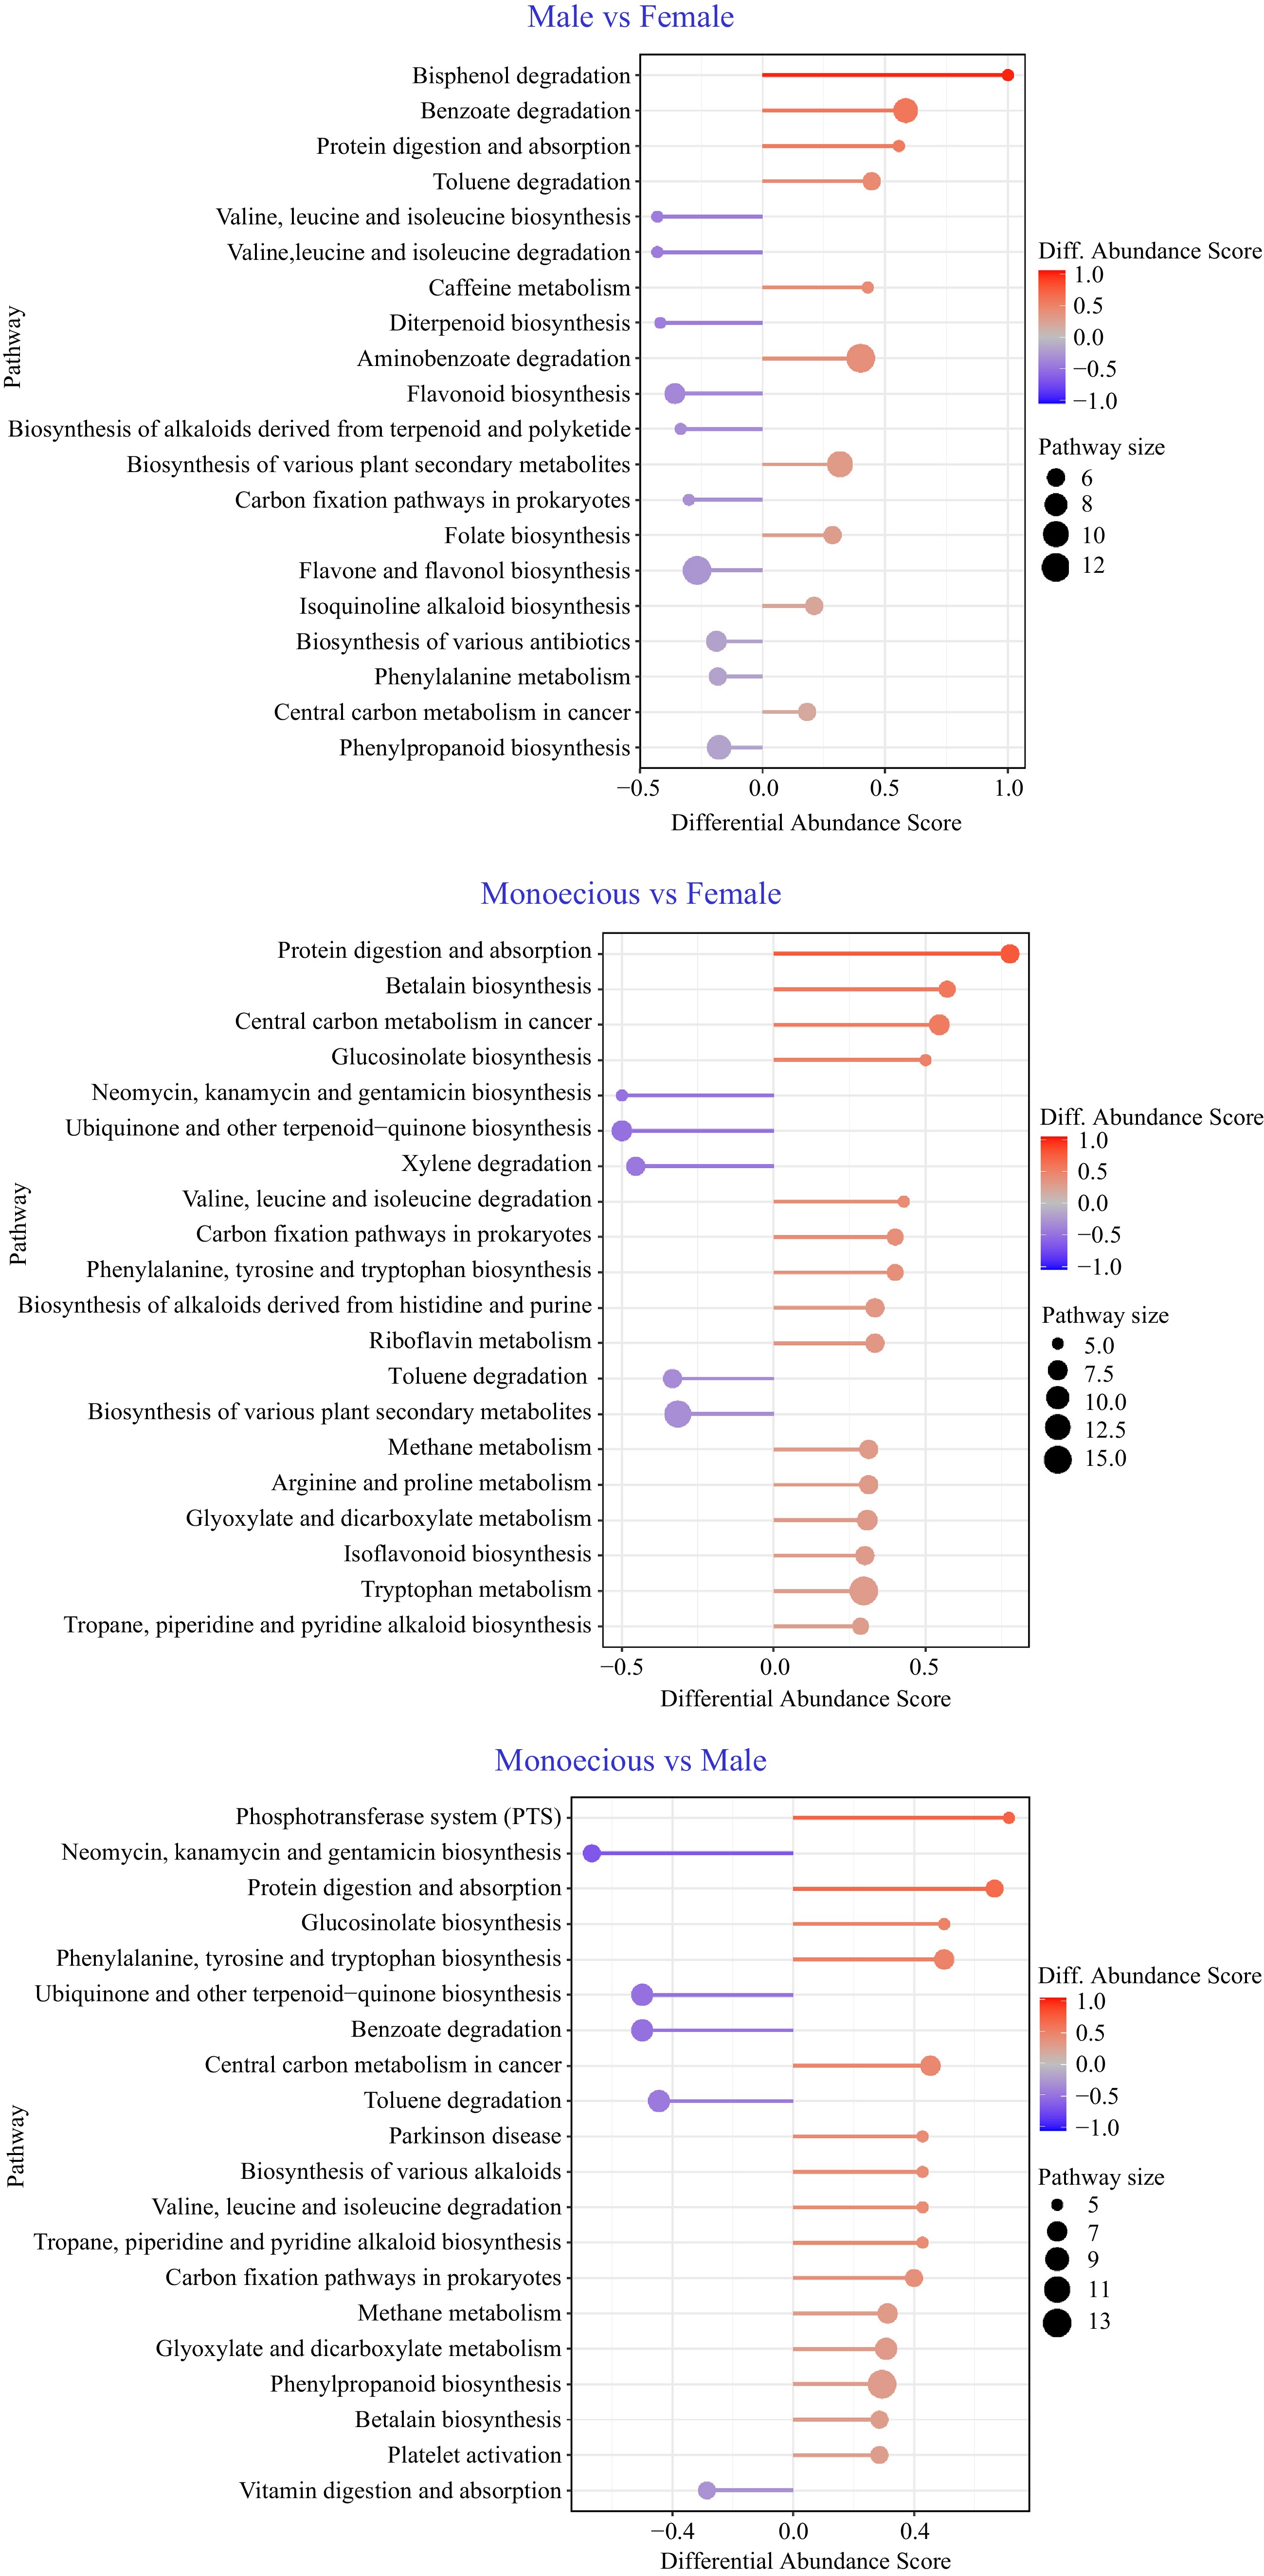
Figure 4.
Pathway-based analysis of metabolic changes on different groups. The differential abundance score captures the average, gross changes for all metabolites in a pathway. A score of 1 indicates all measured metabolites in the pathway increase, and –1 indicates all measured metabolites in a pathway decrease.
-
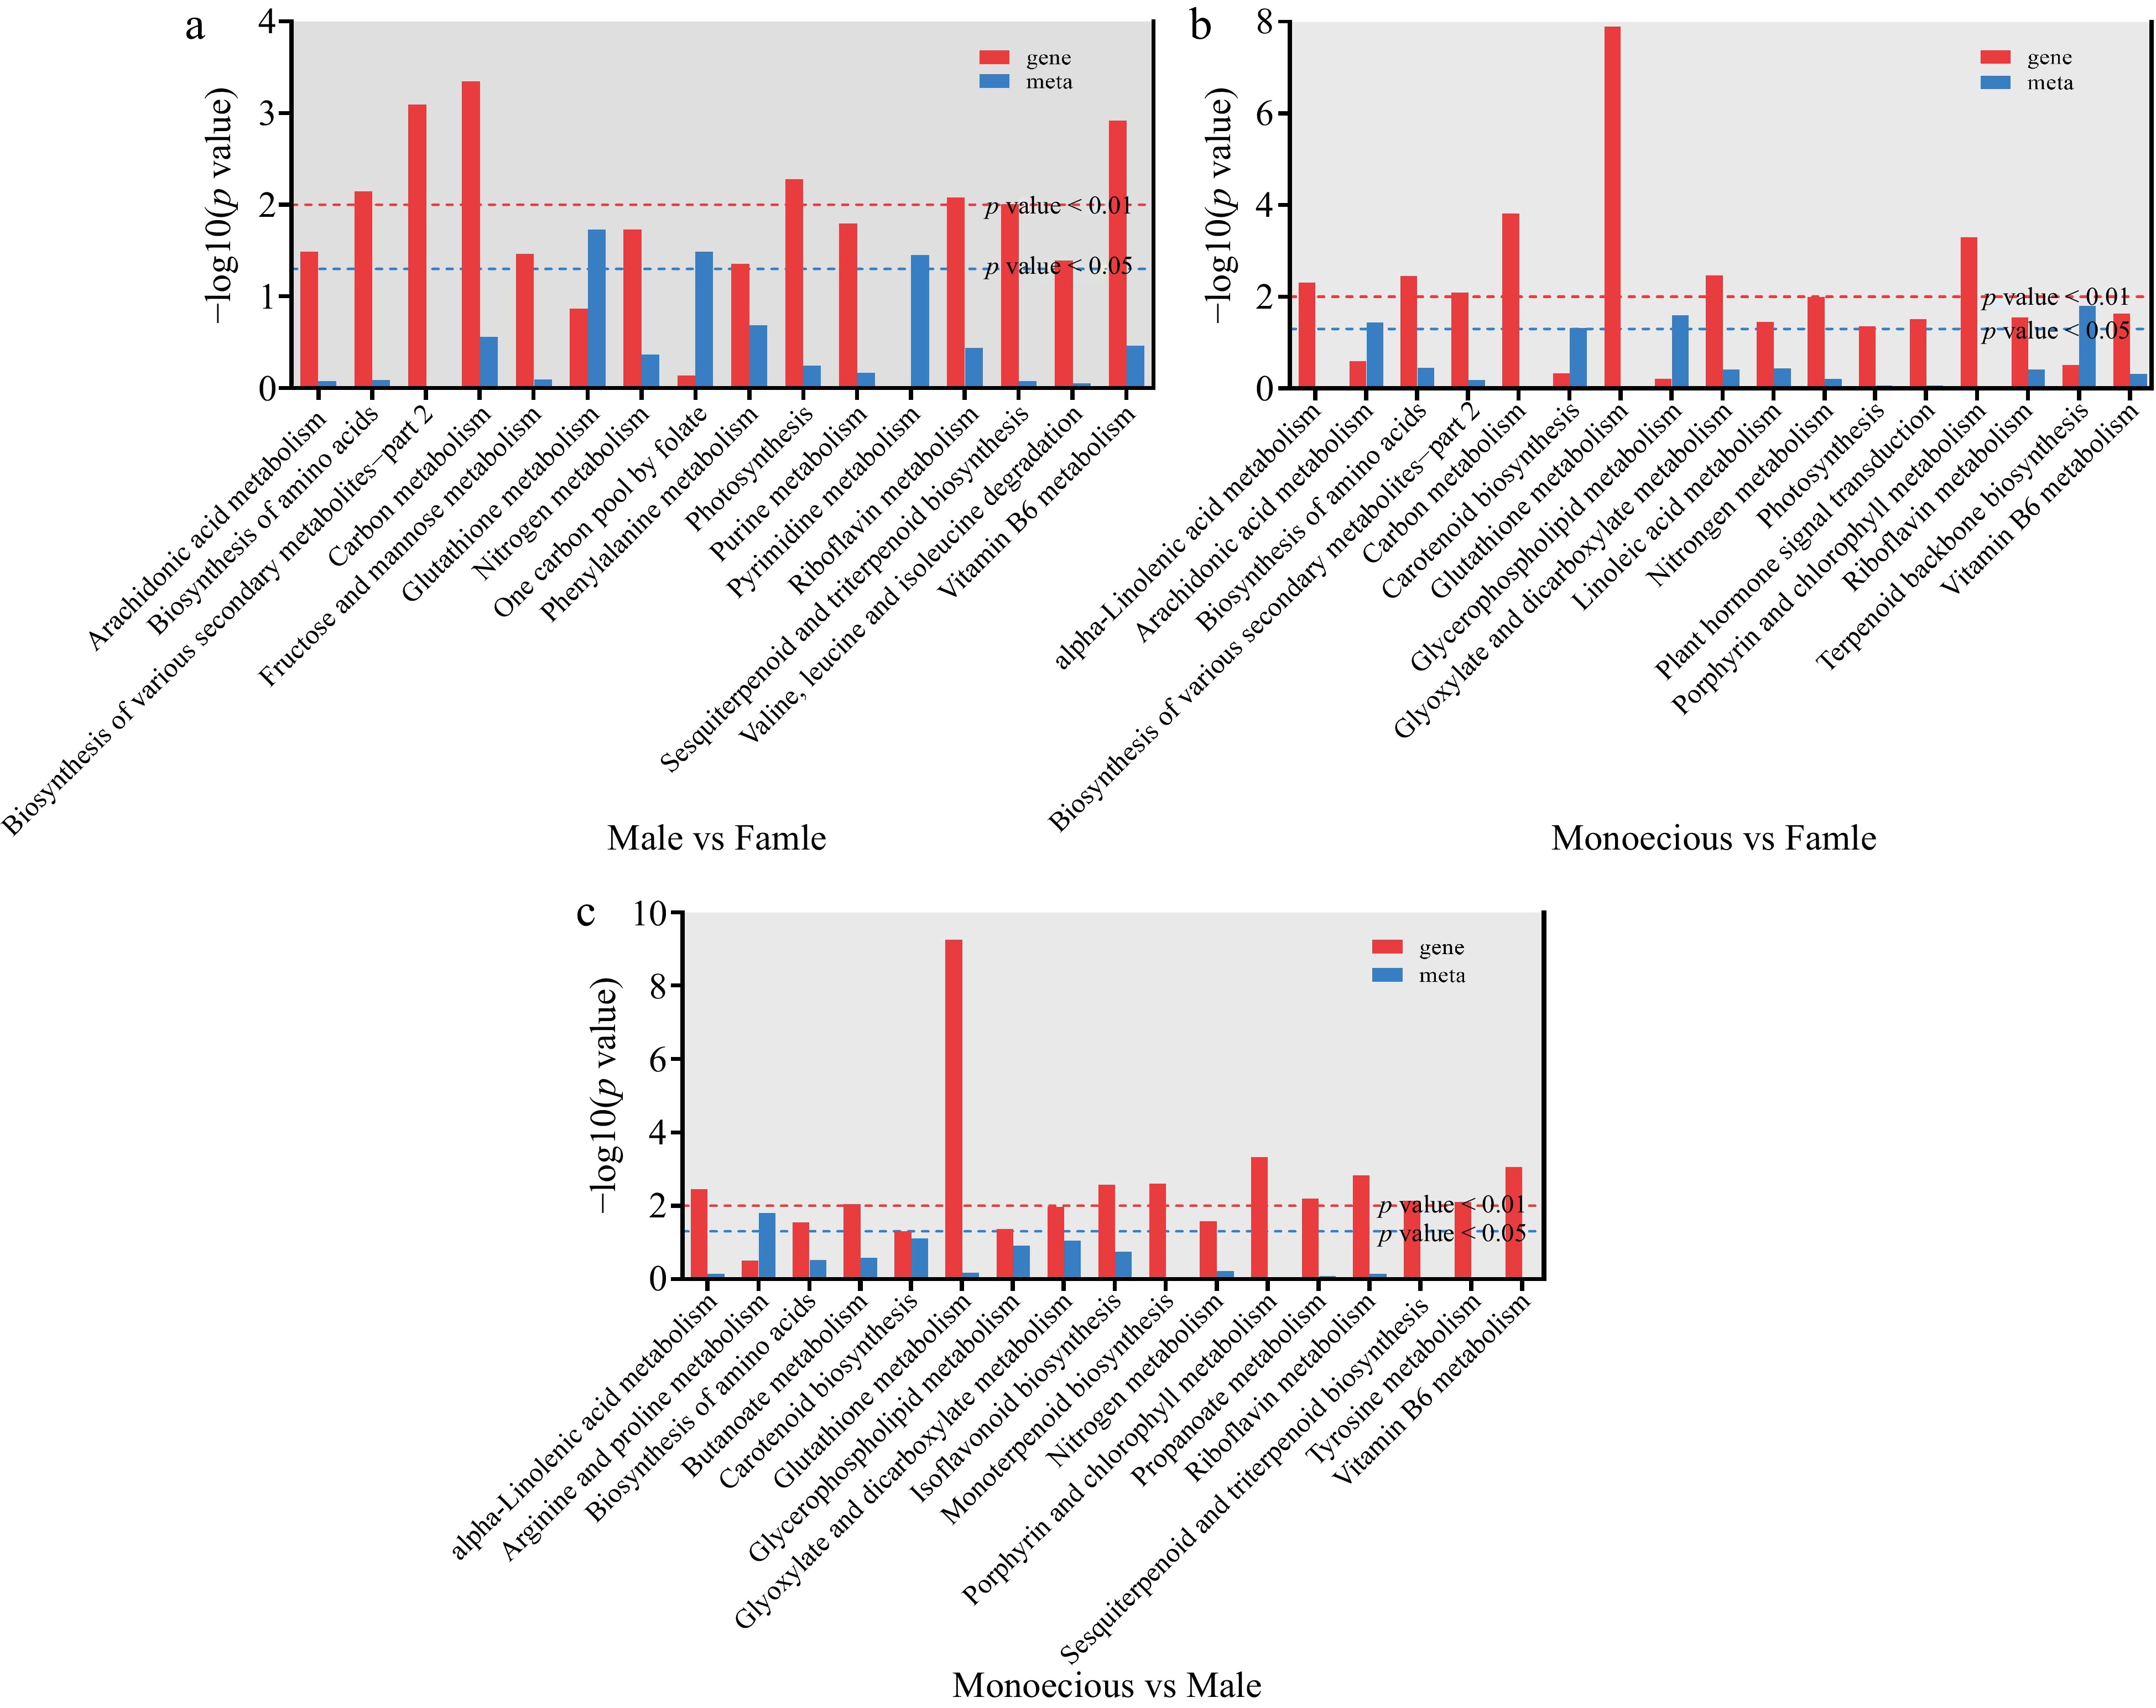
Figure 5.
Co-enrichment p-value histogram of DEGs and DAMs. (a) Male vs female. (b) Monoecious vs female. (c) Monoecious vs male.
-
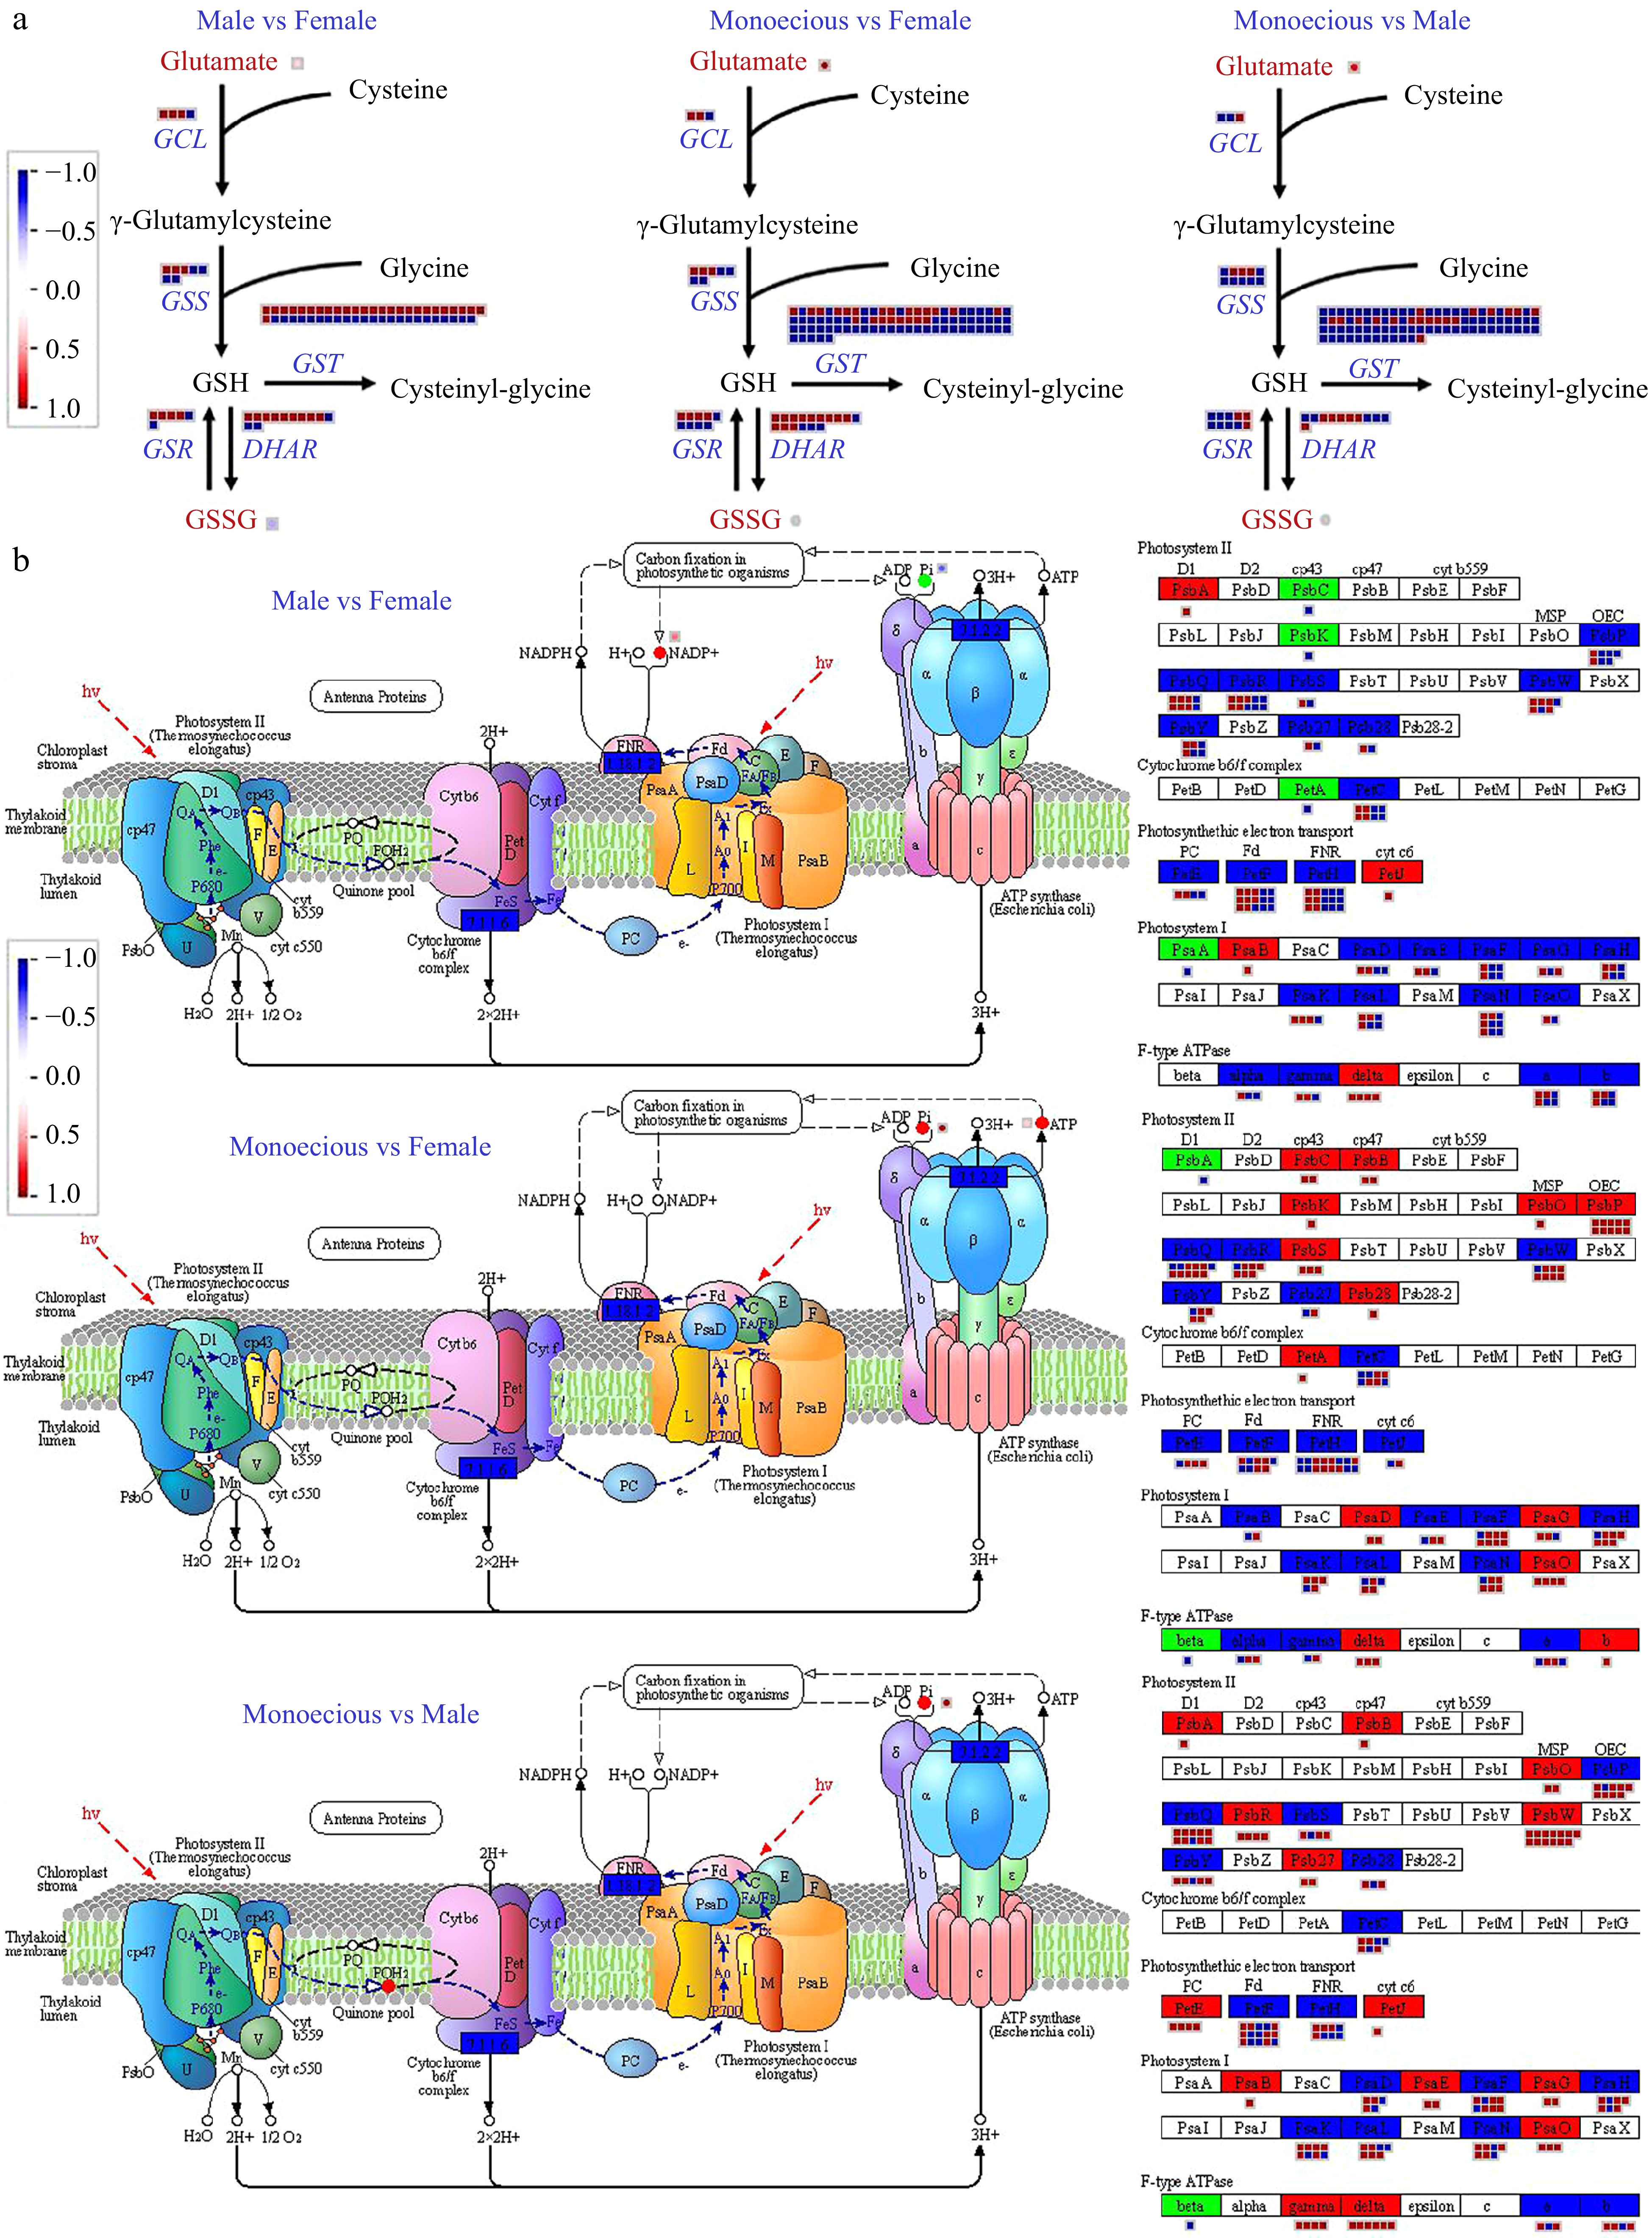
Figure 6.
Comparison of DEGs and DAMs involved in (a) glutathione metabolism and (b) photosynthesis pathways in response to sex differentiation. The red and blue text indicated DAM and DEG, respectively. The red color means up-regulation, while the blue color means down-regulation.
-
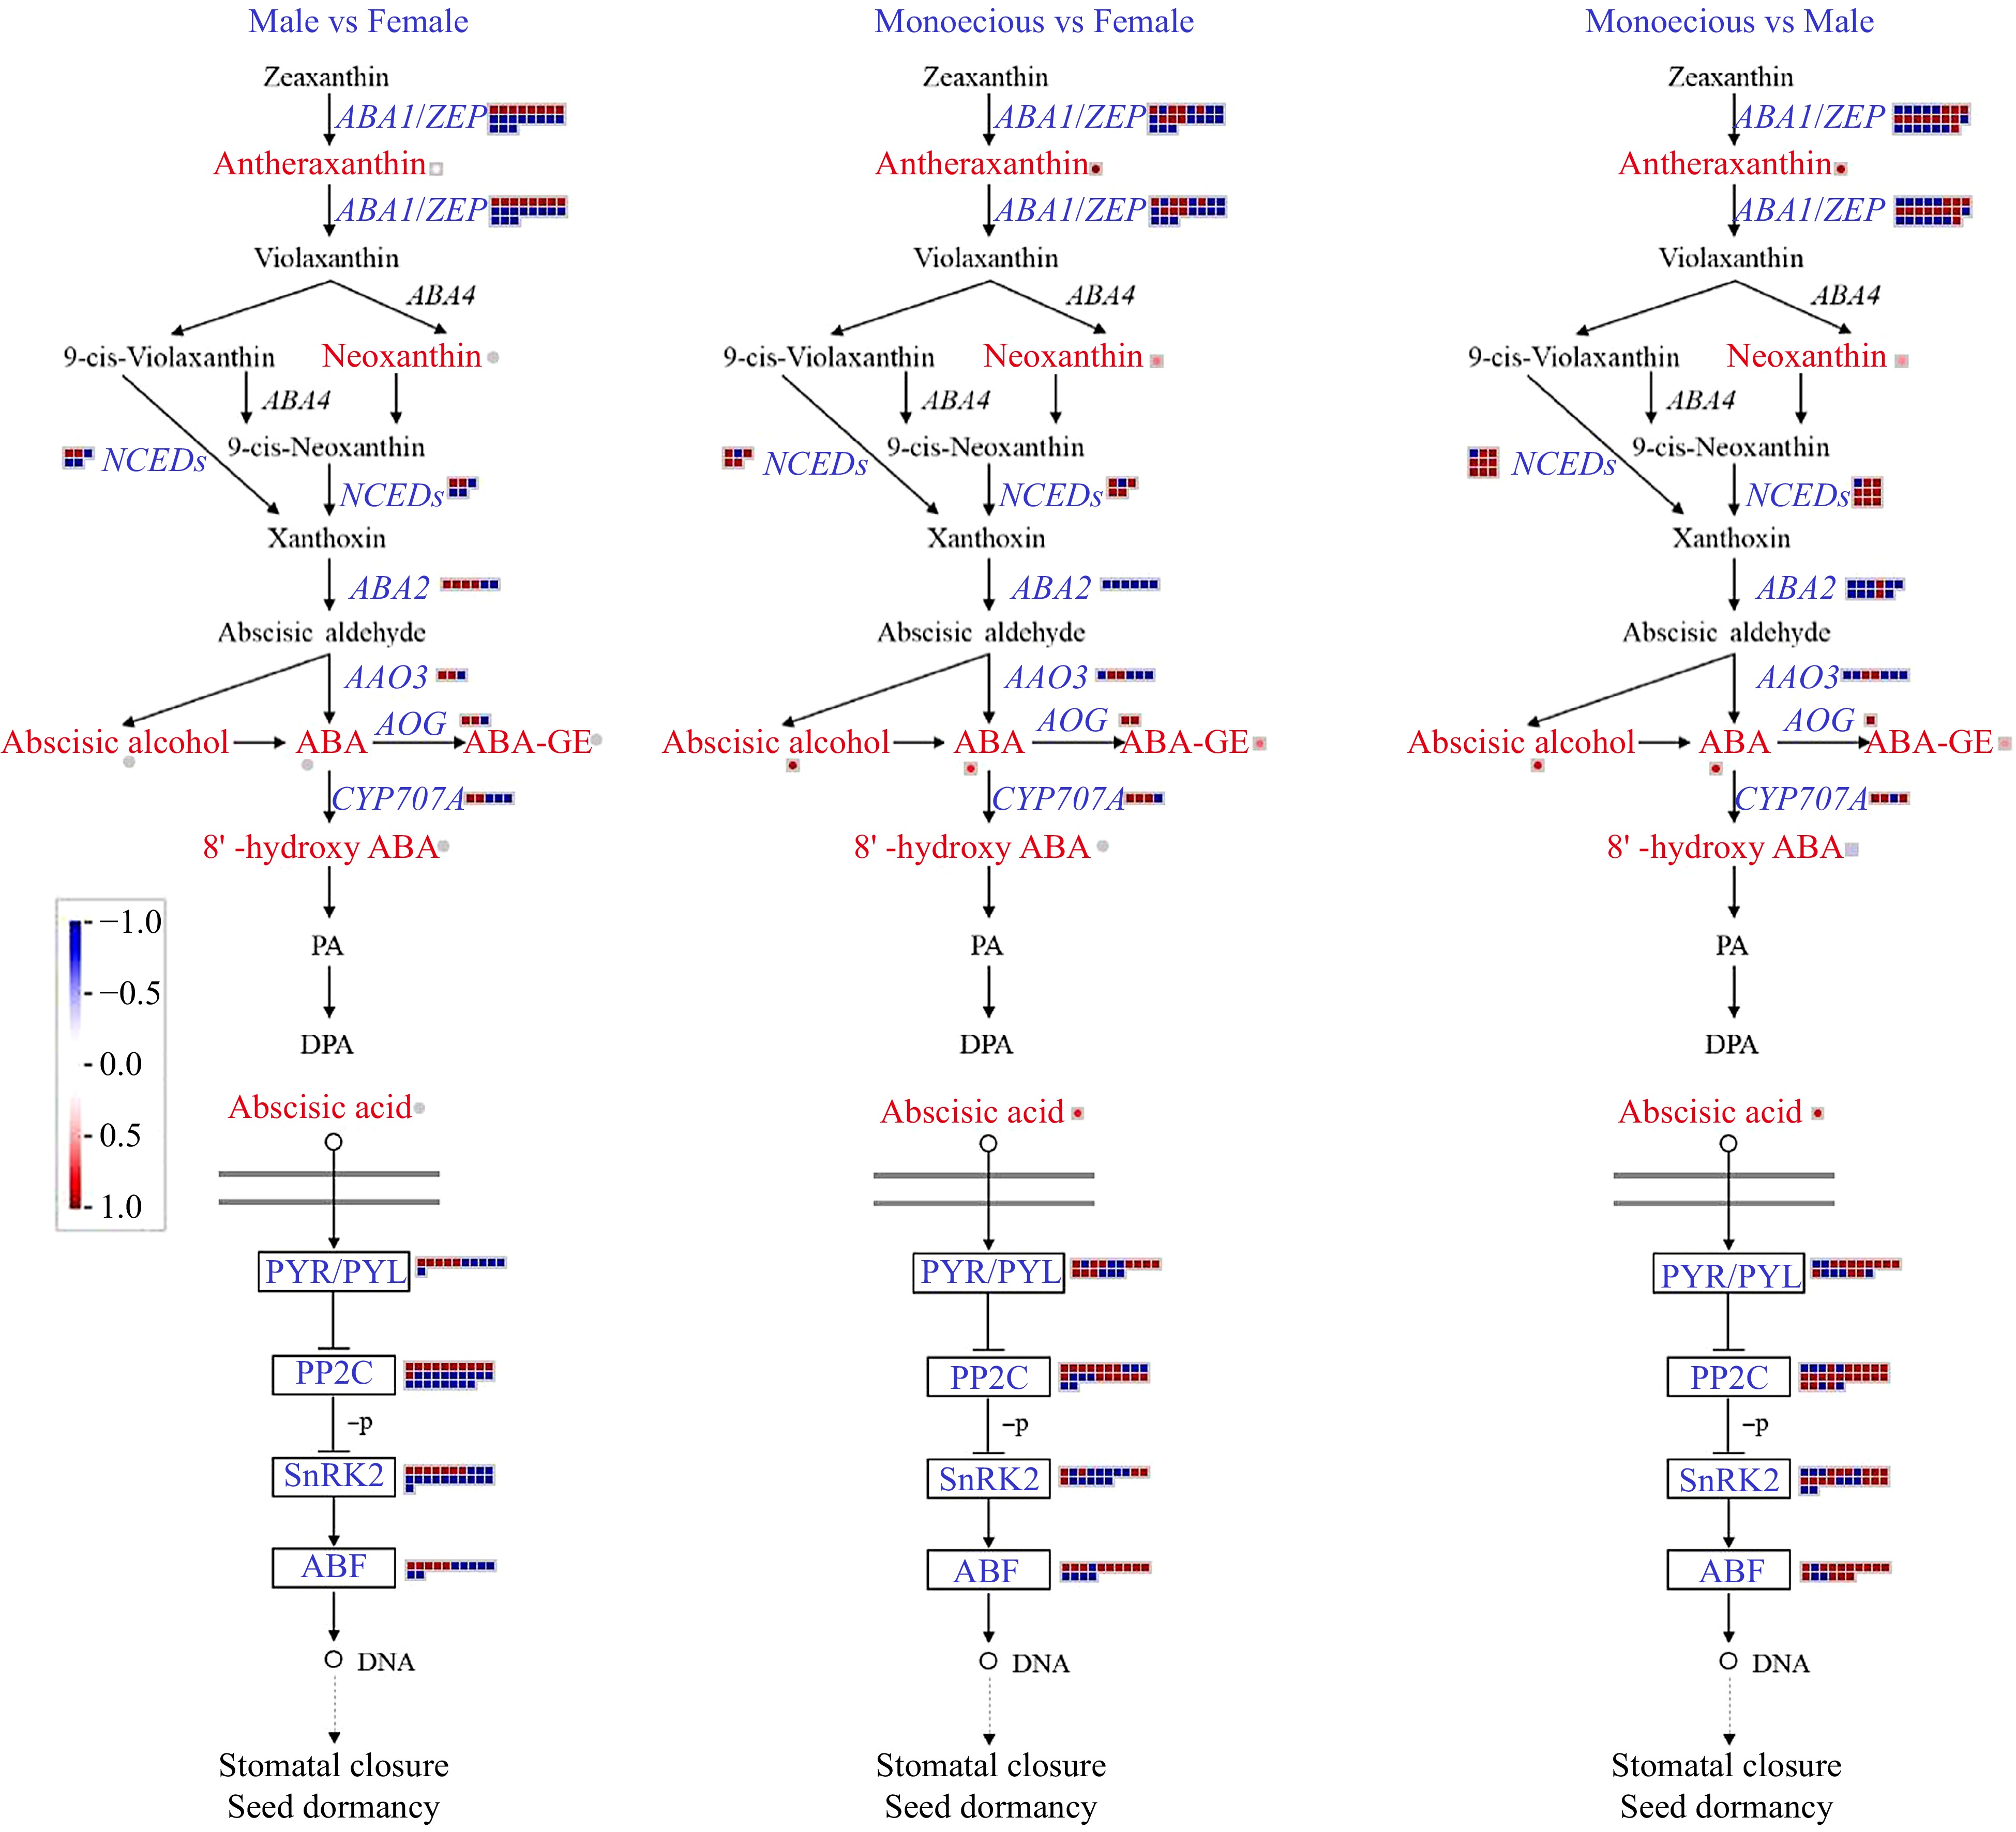
Figure 7.
Comparison of DEGs and DAMs involved in ABA biosynthetic and signaling pathways in response to sex differentiation. The red and blue text indicated DAMs and DEGs, respectively. The red color means up-regulation, while the blue color means down-regulation.
-
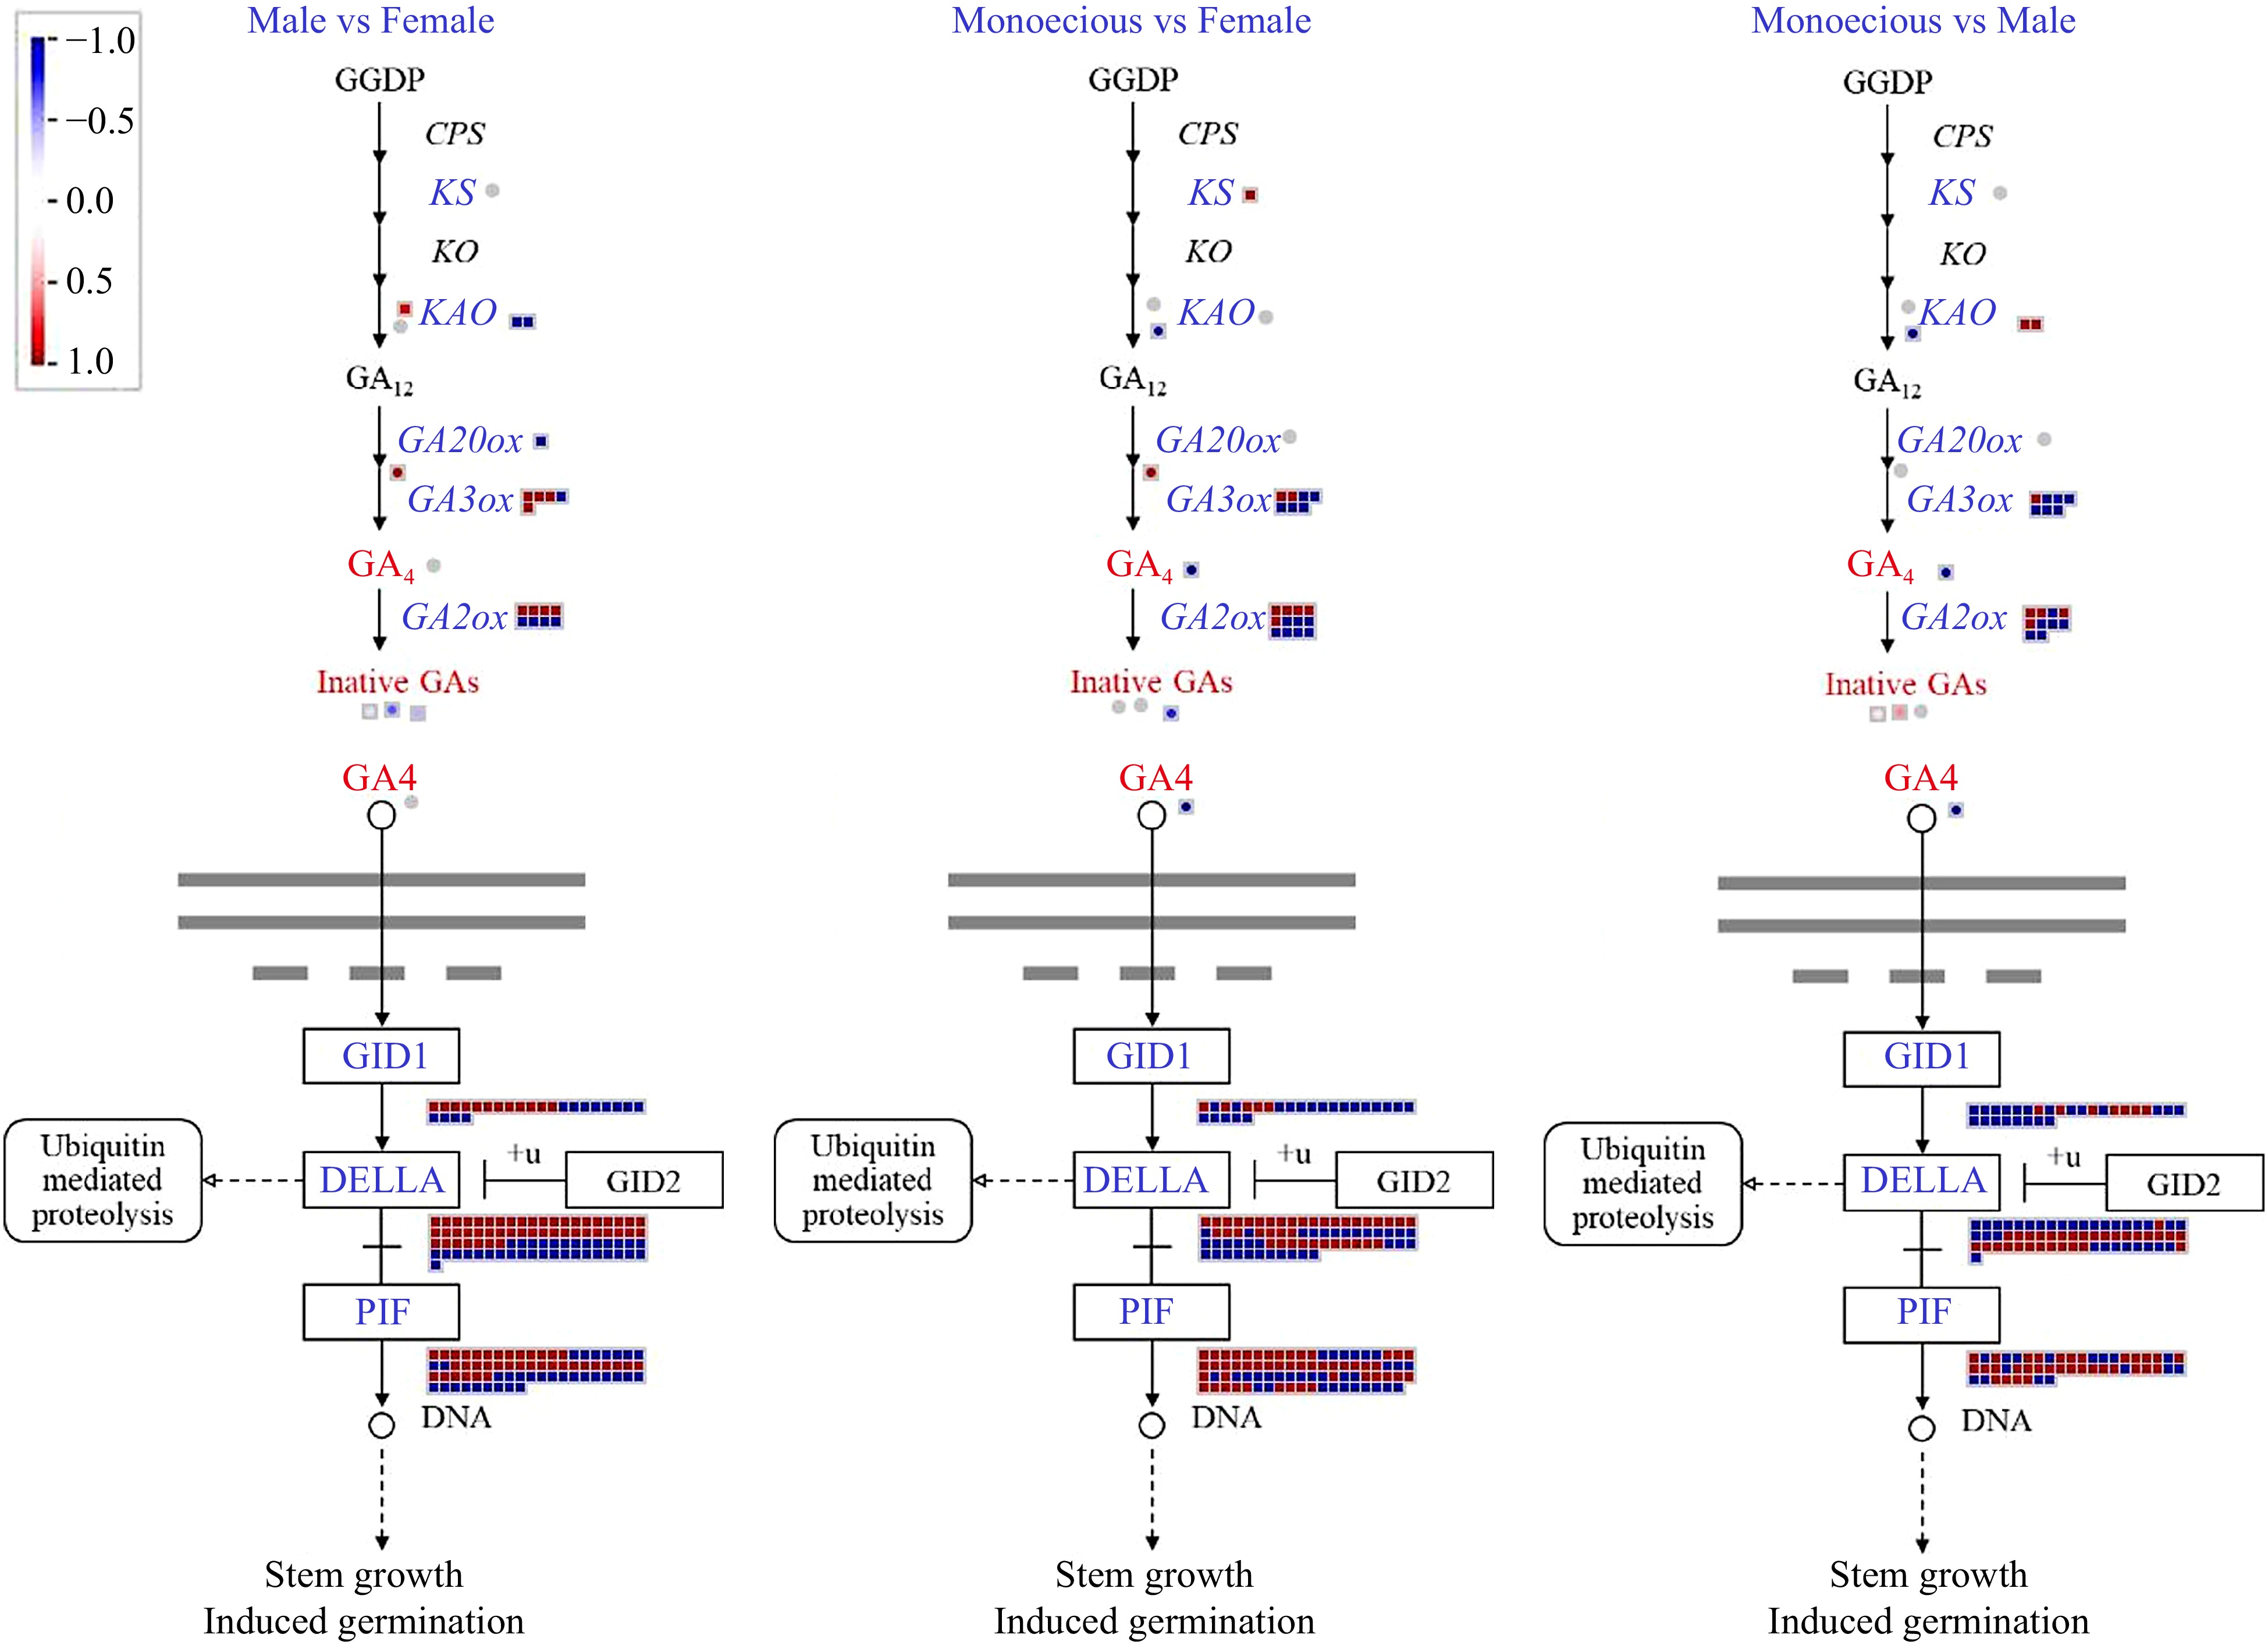
Figure 8.
Comparison of DEGs and DAMs involved in GA biosynthetic and signaling pathways in response to sex differentiation. The red and blue text indicated DAM and DEG, respectively. The red color means up-regulation, while the blue color means down-regulation. GGDP, geranylgeranyl diphosphate; CPS, ent-copalyl diphosphate synthase; KS, ent-kaurene synthase; KO, ent-kaurene oxidase; KAO, ent-kaurene acid oxidase; GA20ox, GA 20-oxidase; GA3ox, GA 3-oxidase; GA2ox, GA 2-oxidase; GID1, GA INSENSITIVE DWARF1.
-
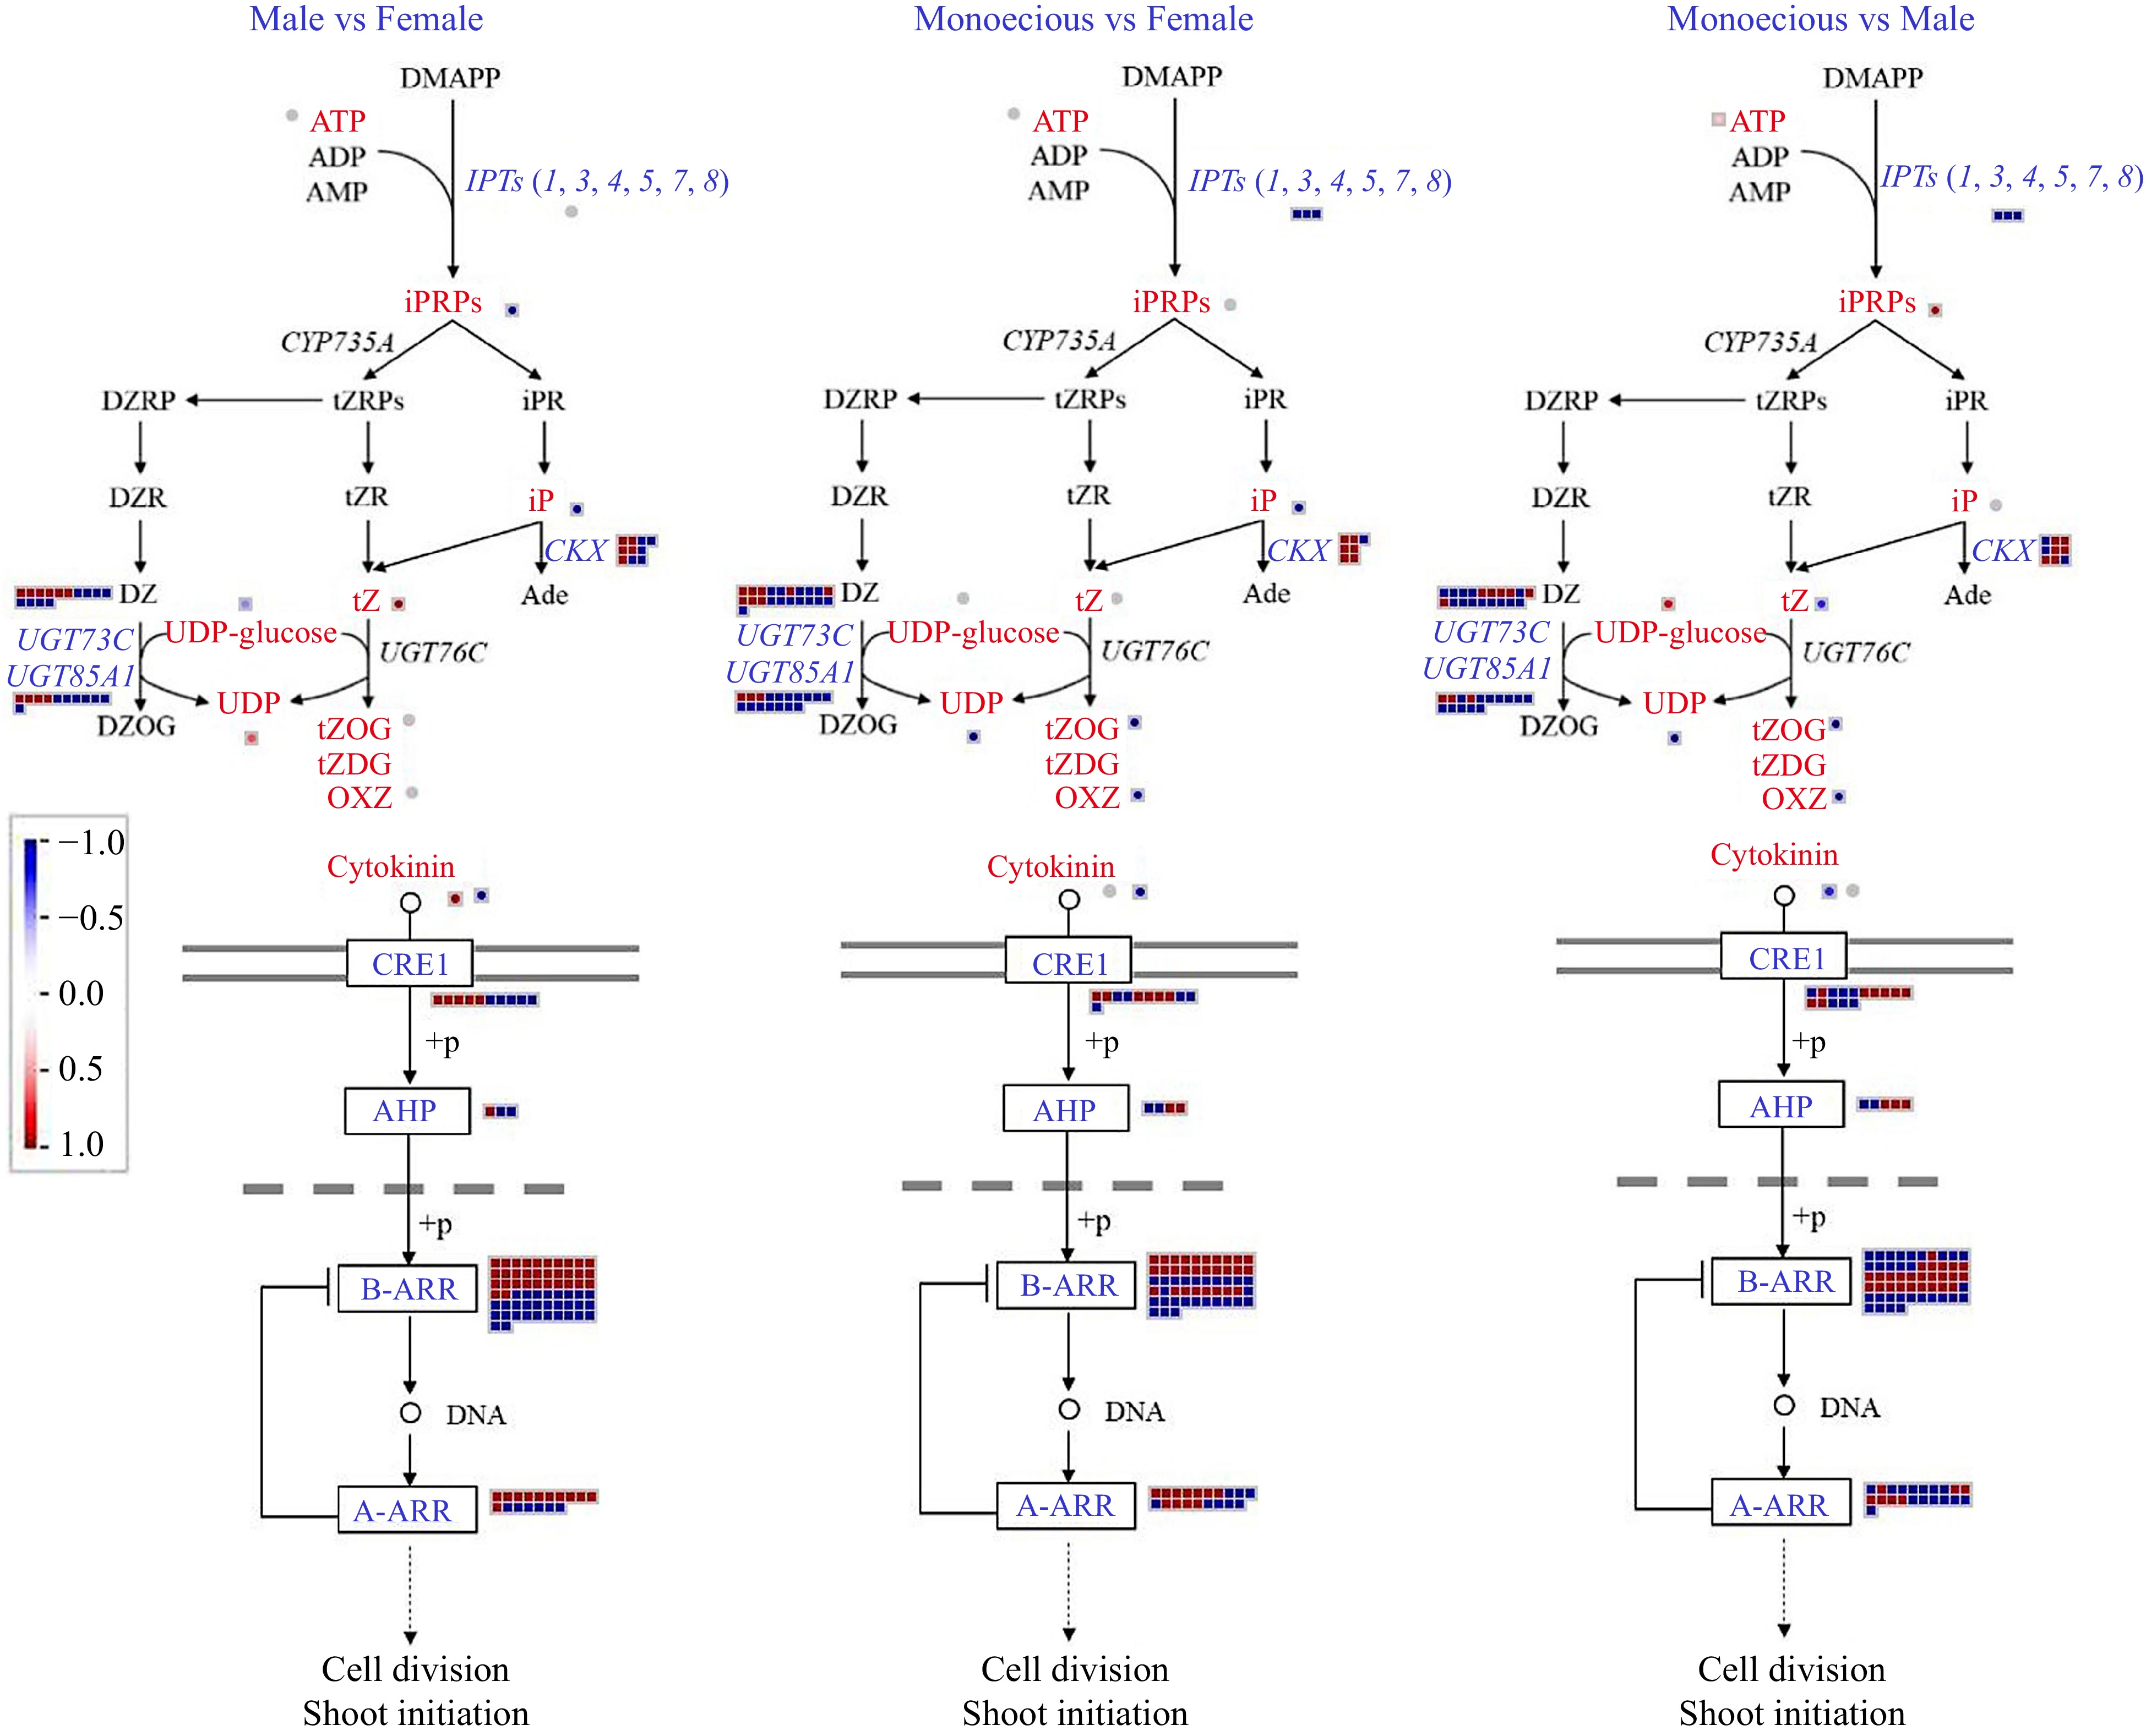
Figure 9.
Comparison of DEGs and DAMs involved in CTK biosynthetic and signaling pathways in response to sex differentiation. The red and blue text indicate DAM and DEG, respectively. The red color means up-regulation, while the blue color means down-regulation.
Figures
(9)
Tables
(0)