-
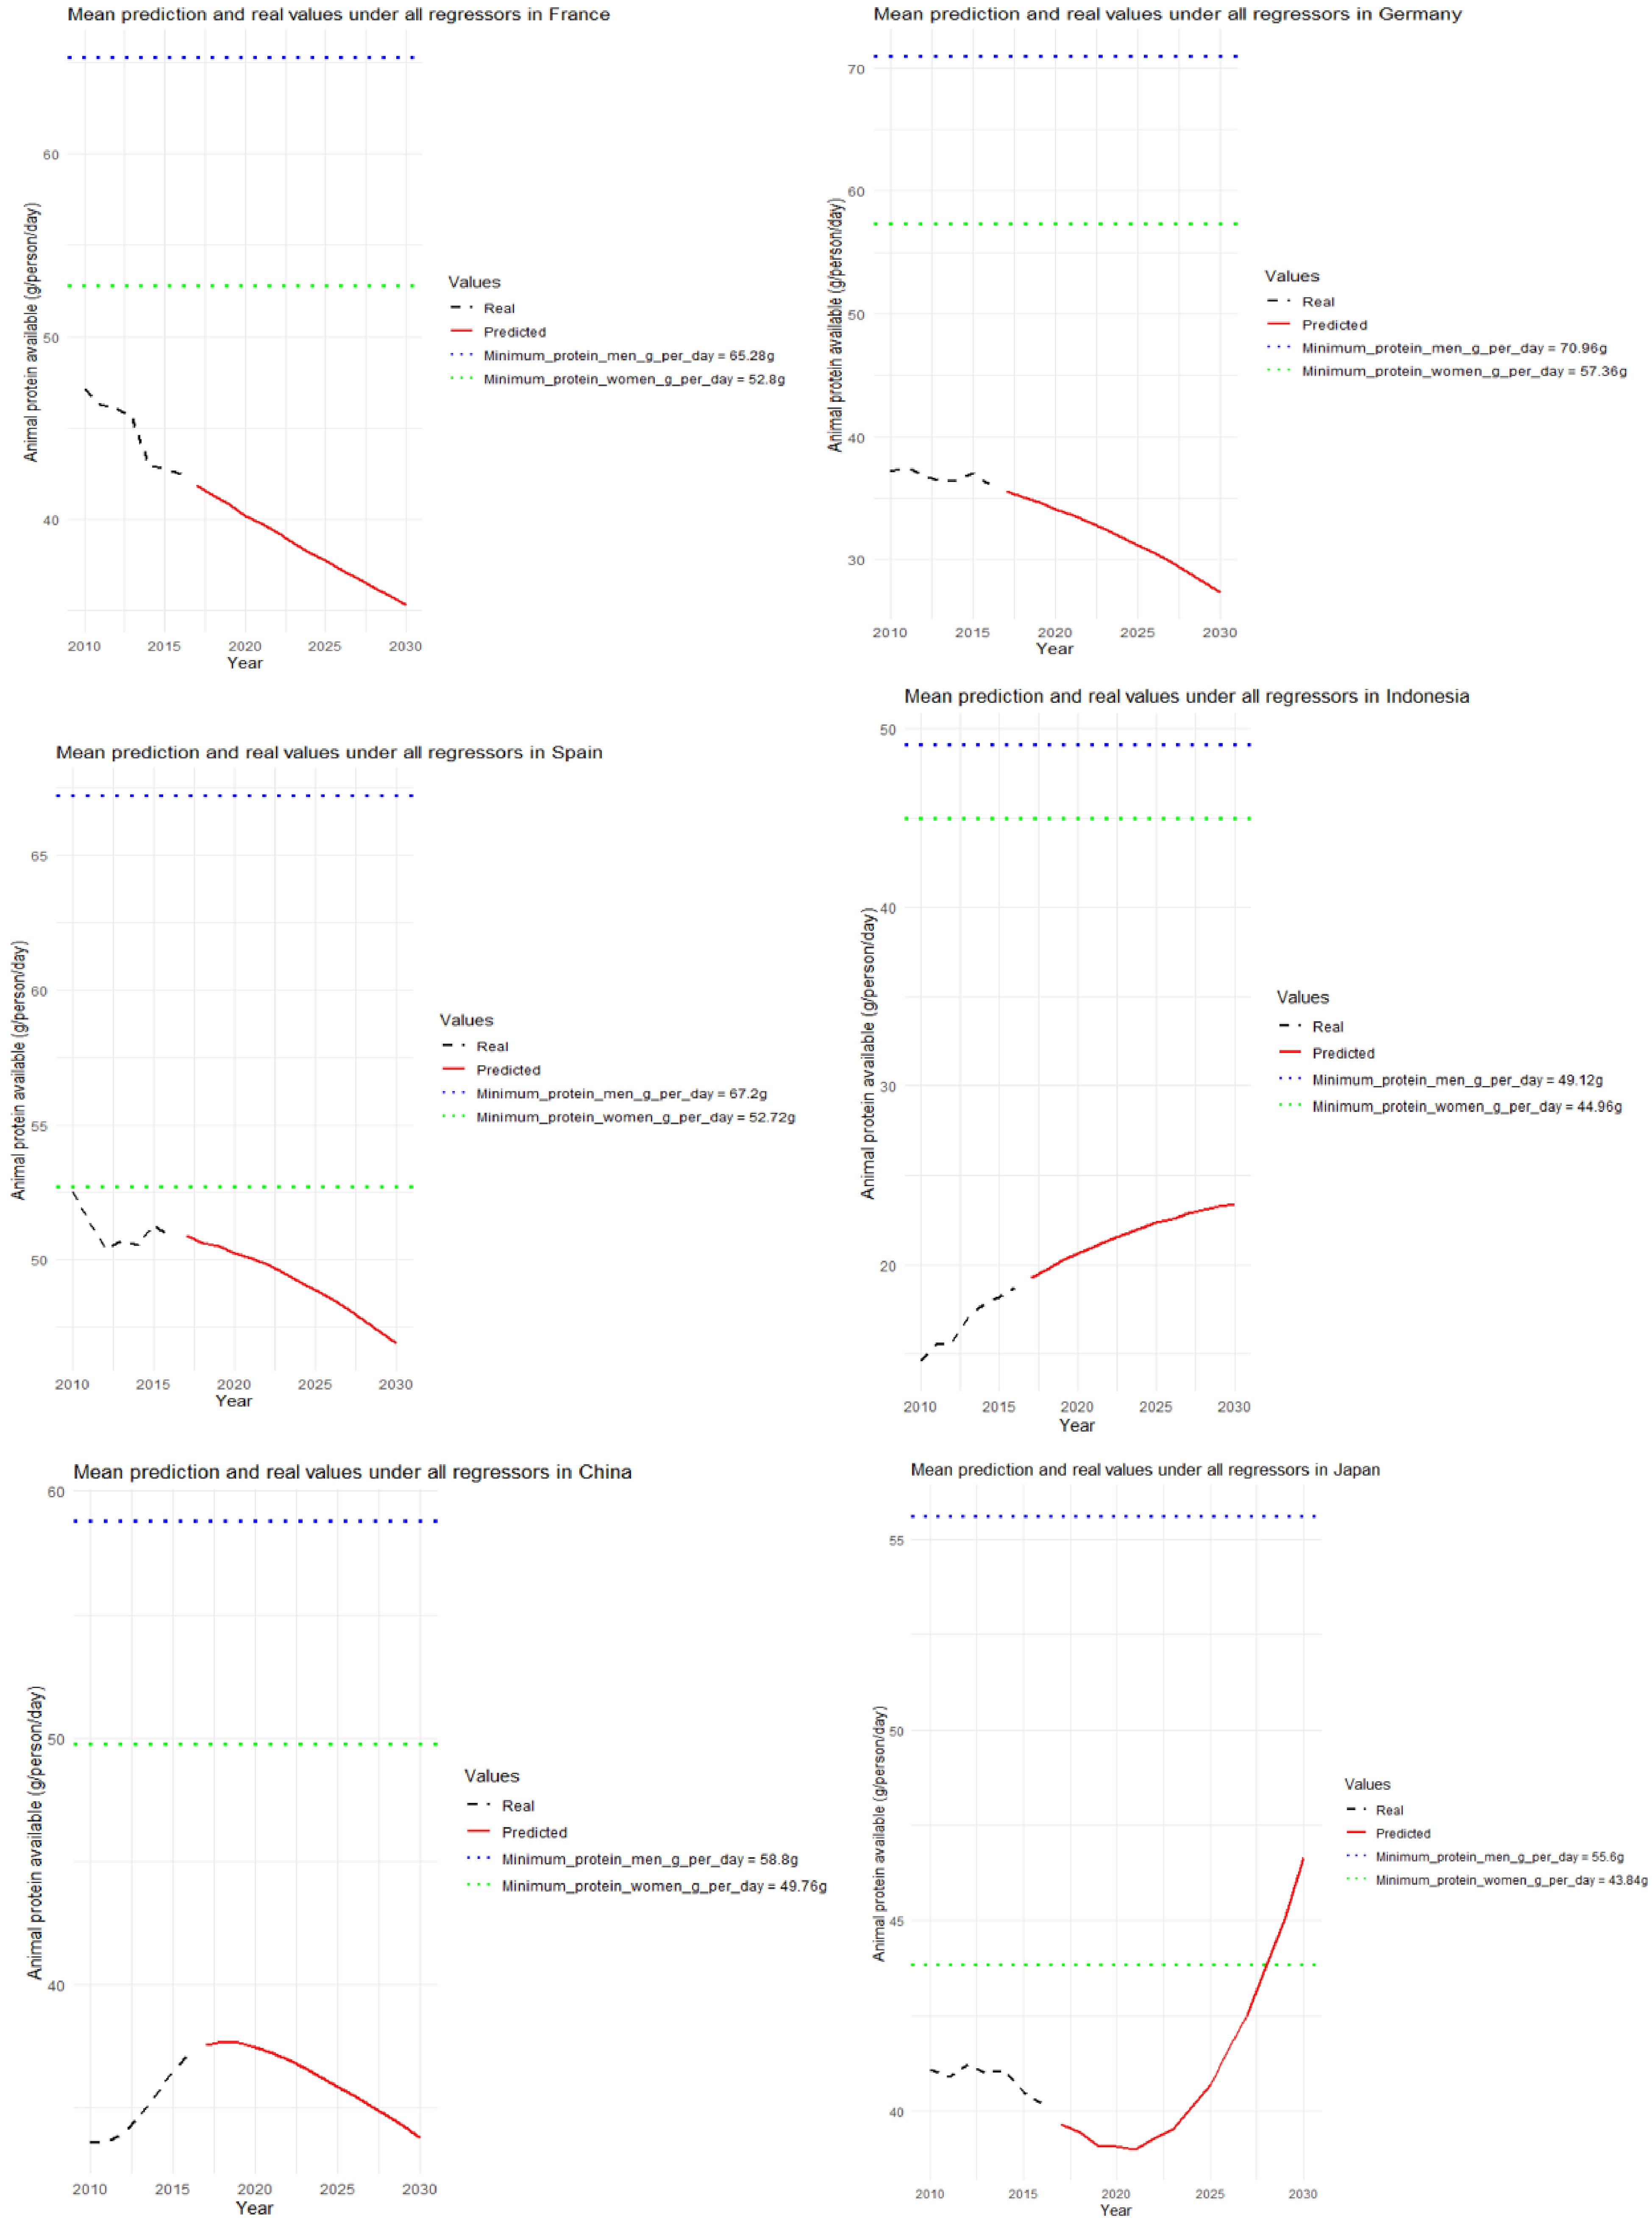
Figure 1.
Annual forecasts to 2030 of the quantity of animal protein available.
-
Variables Description Sources Expected effects Reference Dependent variable Protein available Amount of protein accessible or available to an individual per day (g/person/day) CAM Variable of interest Independent variables Rainfall Annual rainfall (mm) World Bank + [16, 17] Temperature Mean annual temperature (°C) World Bank − [16, 33] CH4 The amount of methane (kiloton) in the atmosphere FAO − [19, 20, 22] N2O The amount of nitrous oxide (kiloton) in the atmosphere FAO − [19, 20, 22] Income Gross annual income per capita (USD) FAO + [1, 24] Price Annual average price of a ton of animal protein (USD/ton) FAO − [1, 25] Farming_lands Total area of agricultural land (hectares) FAO + [28, 29] Population Total population density FAO − [25, 27] Totalproductionprotein Total annual amount of protein produced nationally (tons) FAO + Considered just as an additional indicator of availability Stock_variation Amount of stored protein available after consumptions and sales FAO + Considered just as an additional indicator of availability Country The six countries considered − Random Not quantifiable Table 1.
Summary of the parameters used for the LMM model.
-
Estimate Std. error t value p-value Fixed effects Intercept 5.231e+01 5.658e+00 9.246 1.05e-06 *** Rainfall 1.777e-03 9.522e-04 1.866 0.067505 Temperature −6.340e-01 2.177e-01 −2.913 0.005329 ** CH4 7.522e-04 1.784e-04 4.215 9.38e-05 *** N2O −6.667e-02 1.636e-02 −4.076 0.000154 *** Income 5.259e-05 4.345e-05 1.210 0.231508 Price 1.087e-03 2.895e-04 3.755 0.000429 *** Farming_lands 4.988e-07 5.720e-08 8.721 6.03e-12 *** Population −2.904e-07 2.523e-08 −11.509 4.72e-16 *** Total_protein_production 1.144e-06 8.374e-08 13,660 < 2nd-16 *** Stock_change −1.019e-06 1.443e-07 −7.062 3.21e-09 *** Marginal R2 (R2m) 0.727 Random effects Groups Variance Std.Dev Country (Intercept) 63.7965 7.9873 Residual 0.671 0.819 Significance levels: '***' 0.001; '**' 0.01; '*' 0.05 ' Table 2.
Regression coefficient of the fitting covariates of the linear mixed-effects model.
Figures
(1)
Tables
(2)