-

Figure 1.
Characteristics of the ubiquitinated proteome of rice endosperm and QC validation of MS data. (a) Mass error distribution of all identified ubiquitinated peptides. (b) Peptide length distribution. (c) Frequency distribution of ubiquitinated proteins according to the number of ubiquitination sites identified.
-

Figure 2.
Analysis of ubiquitinated proteins and motifs. (a) Gene ontology (GO) functional characterization of ubiquitinated proteins. (b) Subcellular localization of ubiquitinated proteins. From the inside out, the ring represents 9311-C, 9311-H, GLA4-C and GLA4-H, respectively. (c) Motif enrichment analysis of ubiquitinated proteins.
-

Figure 3.
A temperature regulated rice endosperm ubiquitome. (a) The number of ubiquitinated proteins, peptides and sites detected in four group samples. (b) Venn diagram of ubiquitination sites (proteins) detected in four group samples. (c) PCA based on ubiquitination intensity across all four sample groups with three biological repetitions. (d) Differentially expression profiles of ubiquitination sites (proteins) in 9311 and GLA4 under high-temperature stress. The expression profiles of selected ubiquitination sites (p < 0.05, log2(fold-change) >1) were normalized using the Z-score and presented in a heatmap.
-
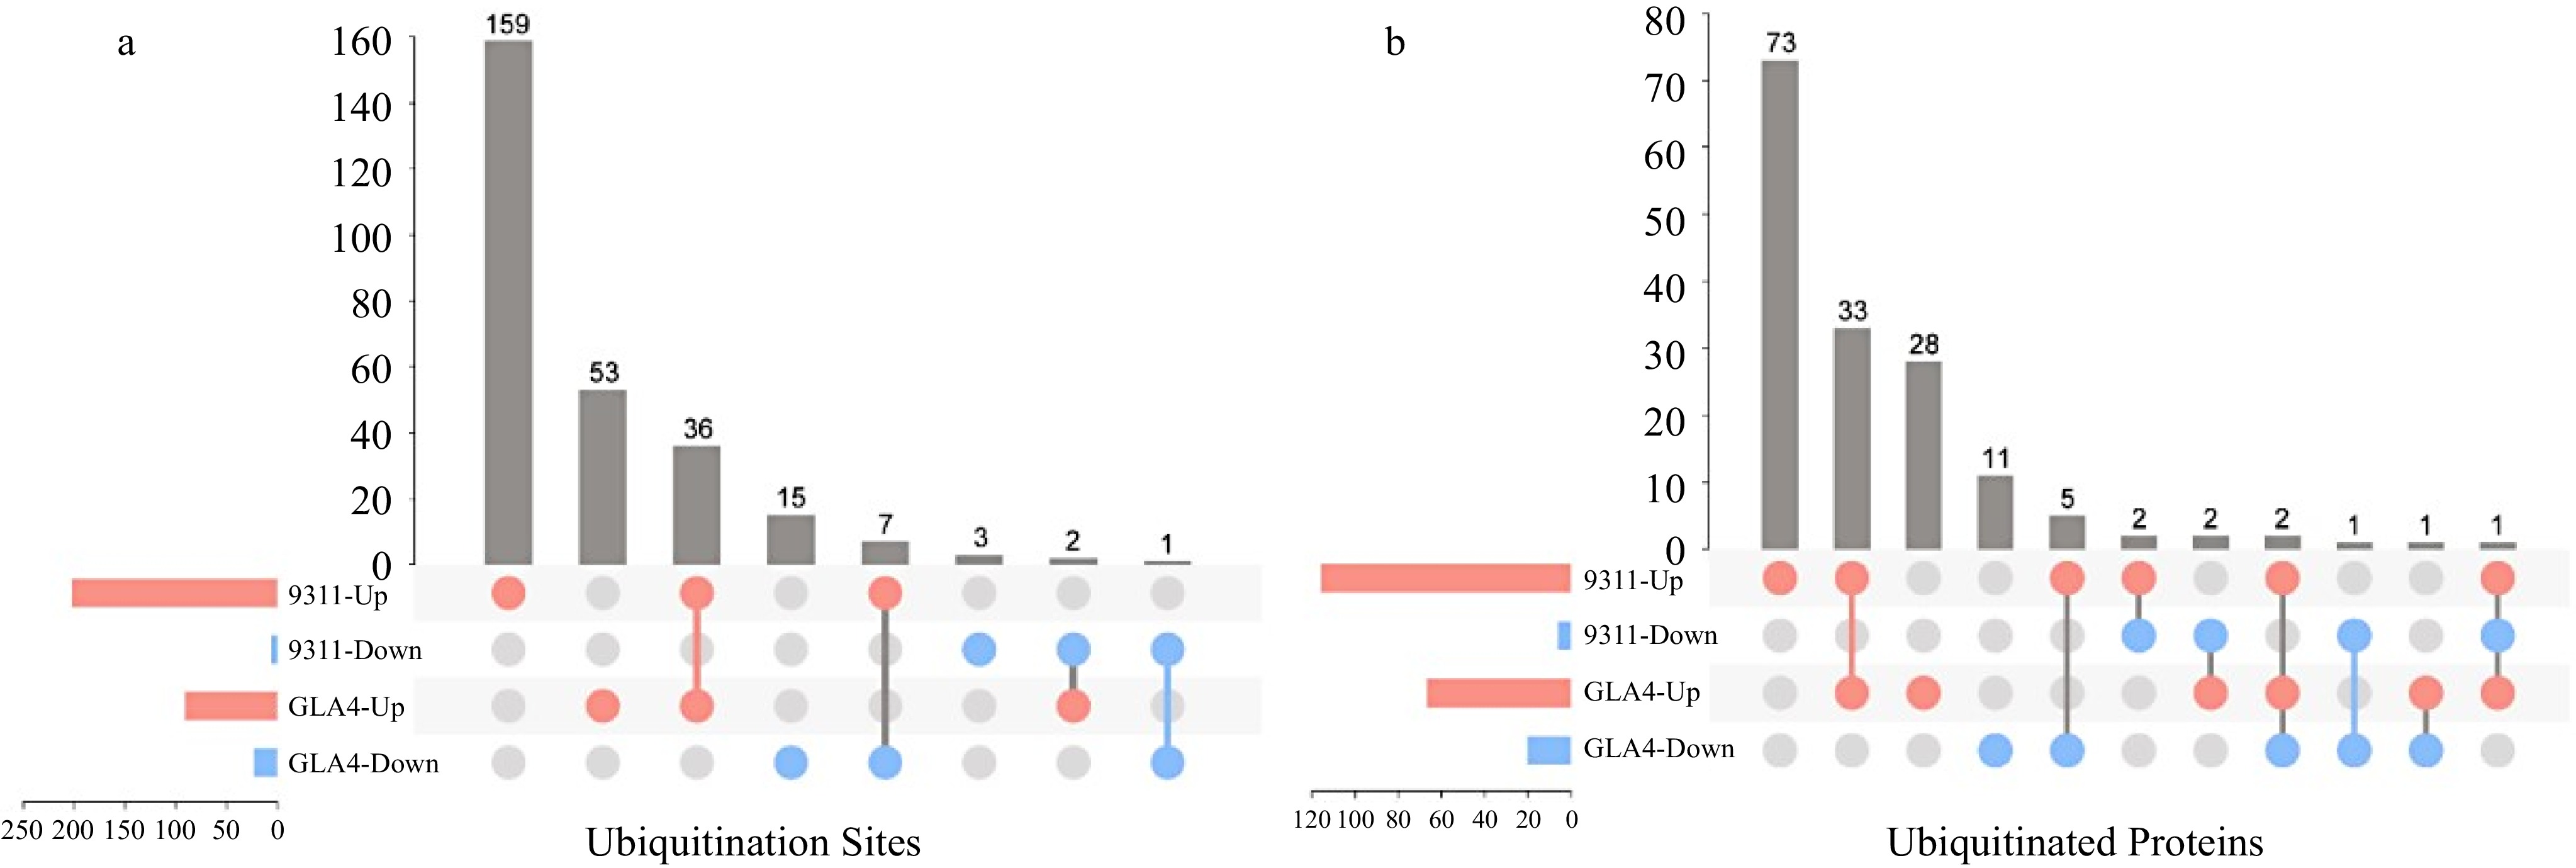
Figure 4.
Comparison of differentially ubiquitinated sites and proteins in 9311 and GLA4 under high-temperature stress.
-

Figure 5.
Enrichment analysis of differentially expressed ubiquitinated proteins based on Gene Ontology (GO) terms.
-
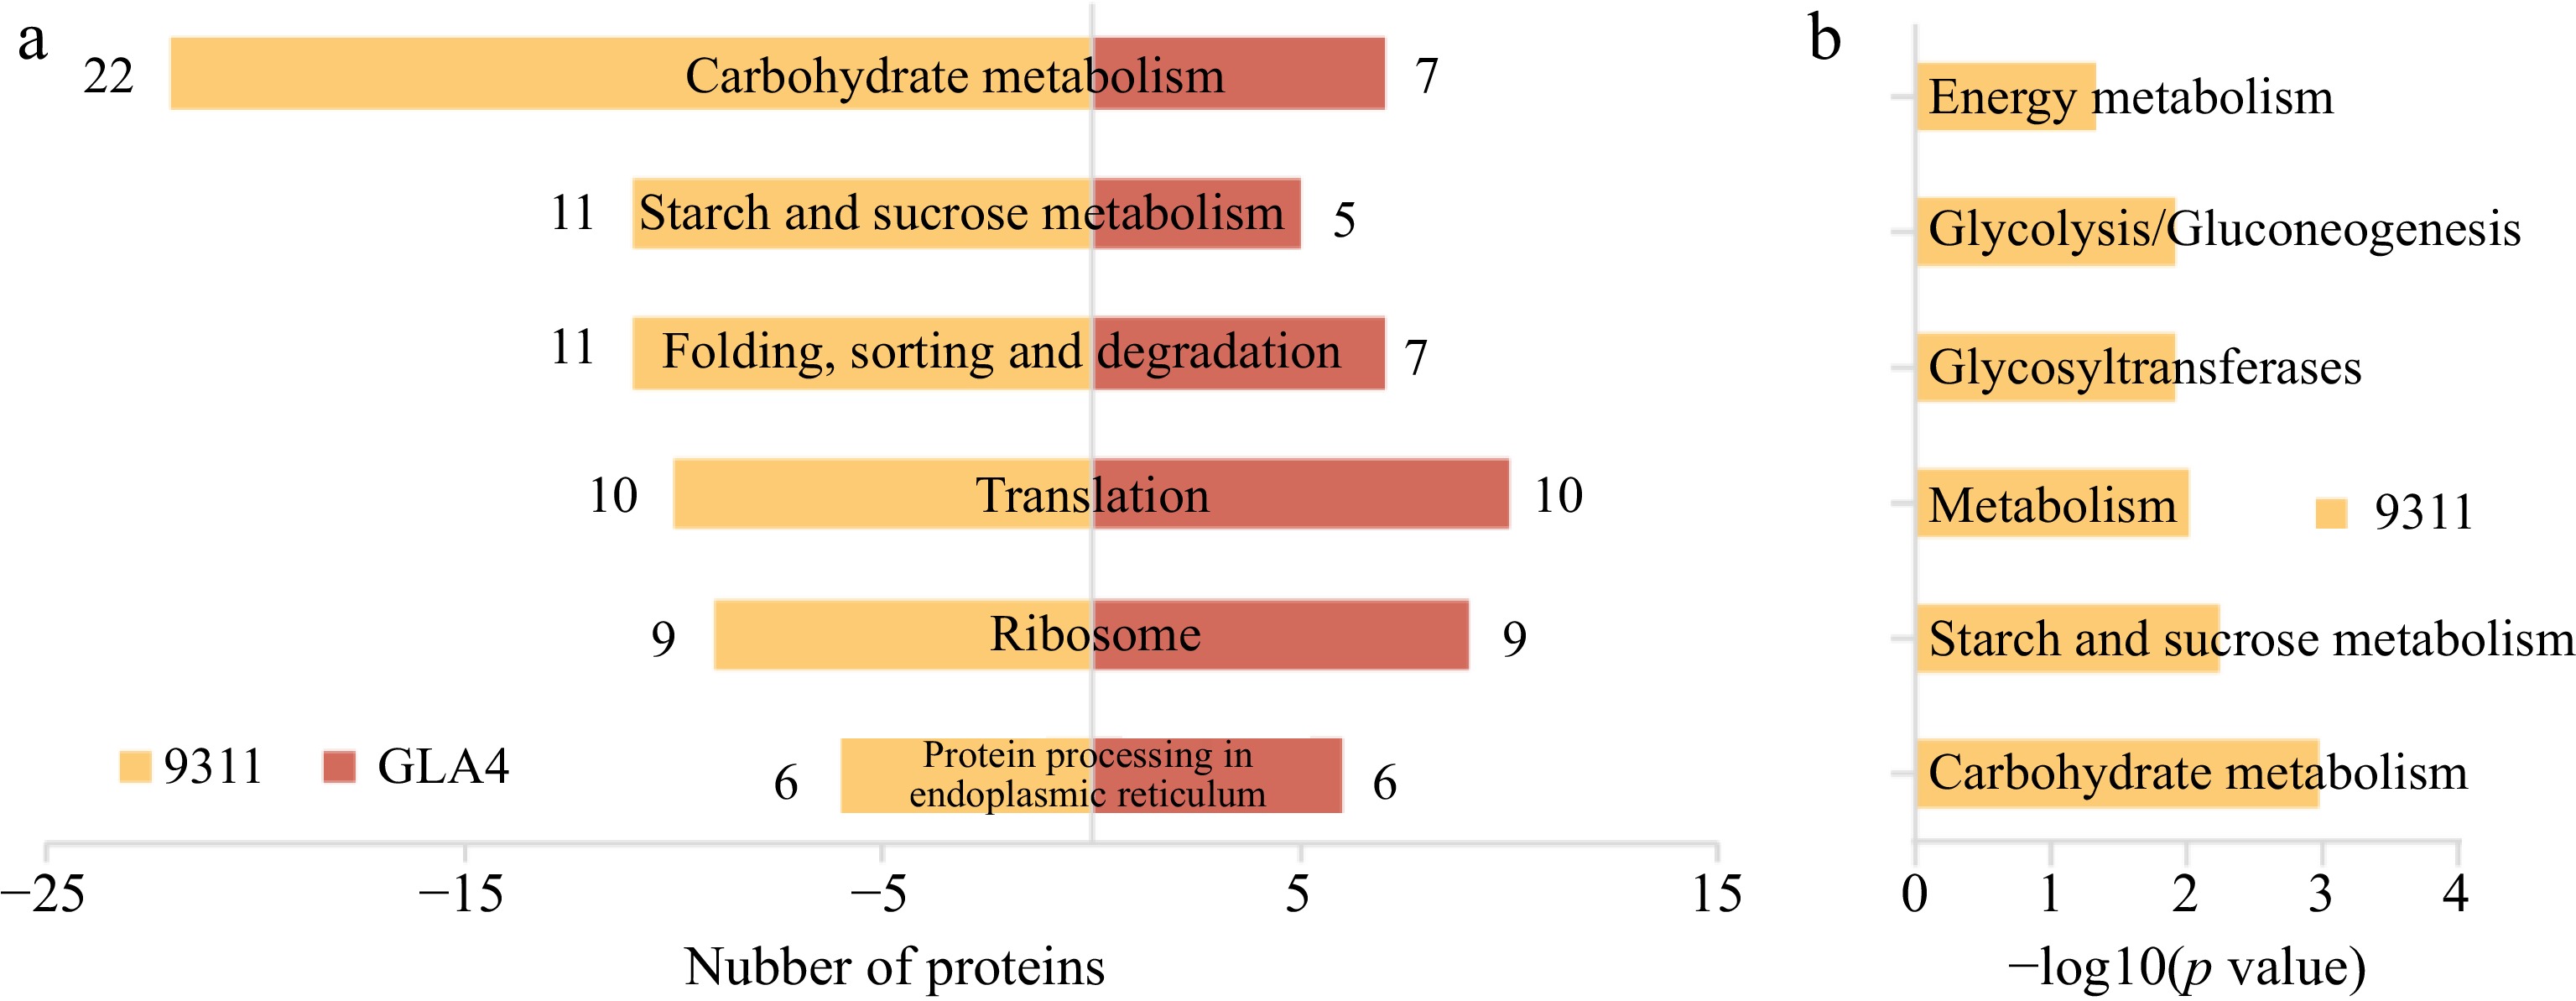
Figure 6.
KEGG classification and enrichment analysis of differentially ubiquitinated proteins. (a) Number of differentially ubiquitinated proteins based on KEGG classification in 9311 and GLA4. (b) KEGG enrichment analysis of differentially ubiquitinated proteins in 9311.
-
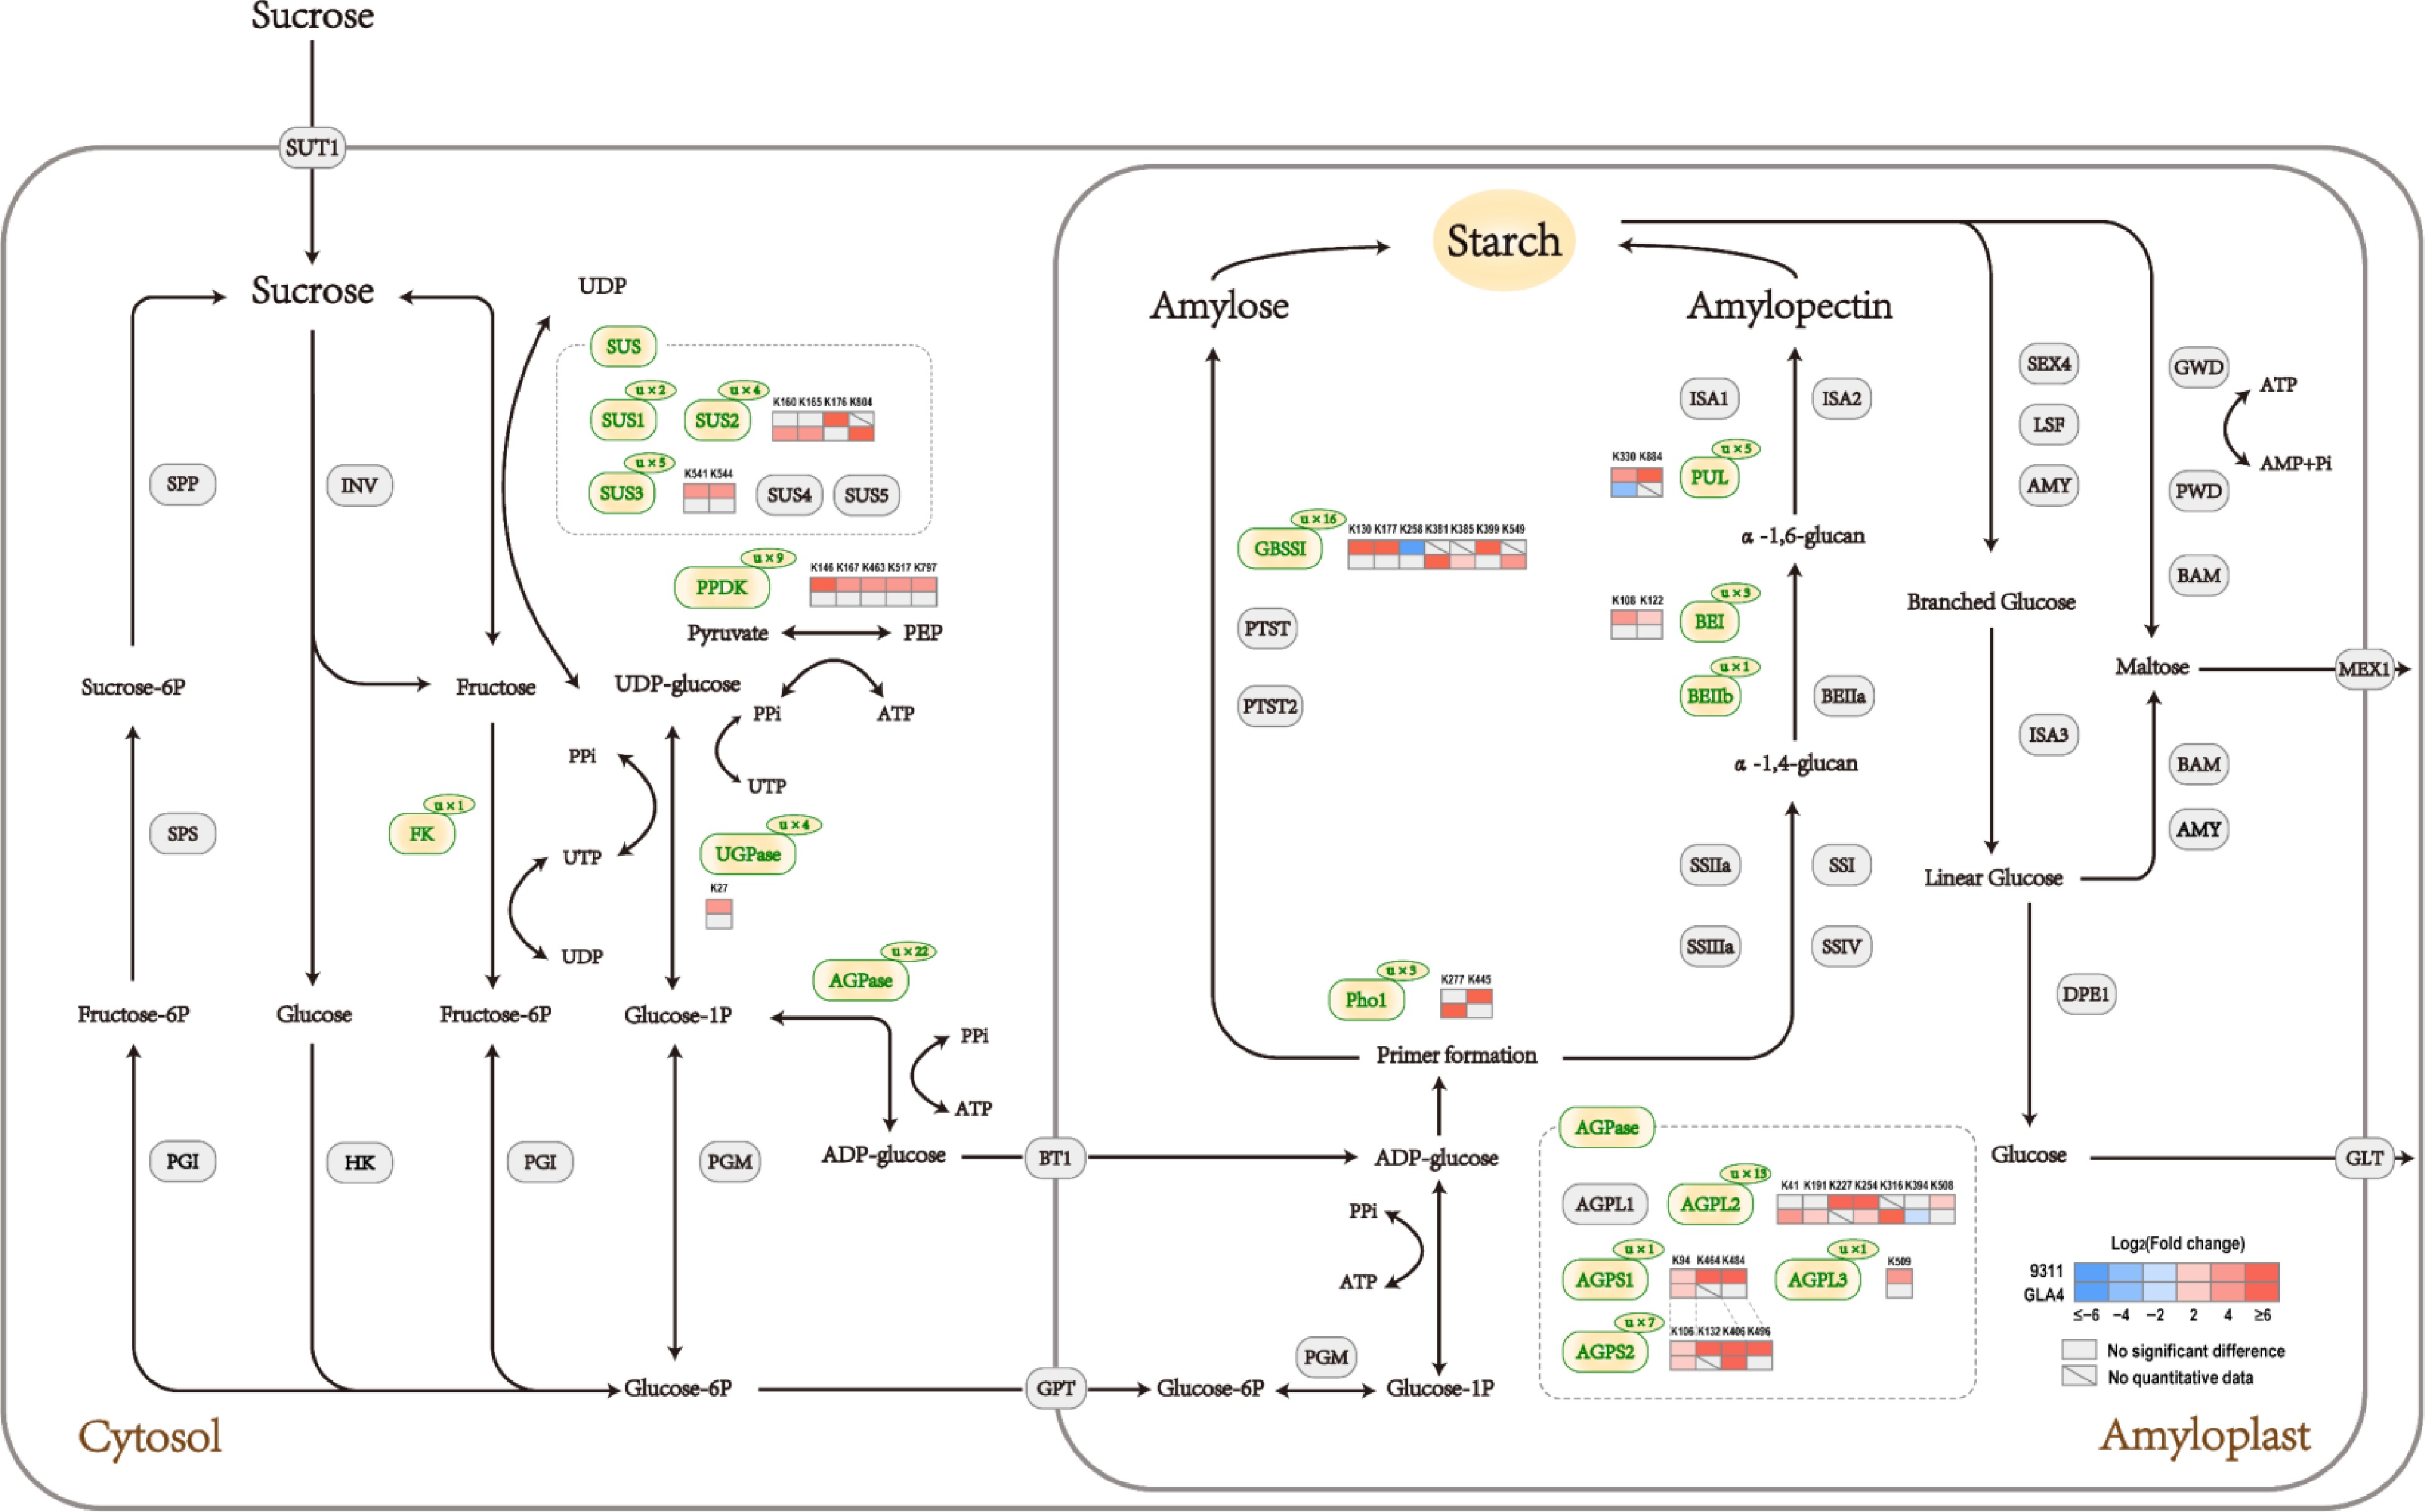
Figure 7.
Sucrose and starch pathway at the ubiquitination levels in rice endosperm under high-temperature stress.
-
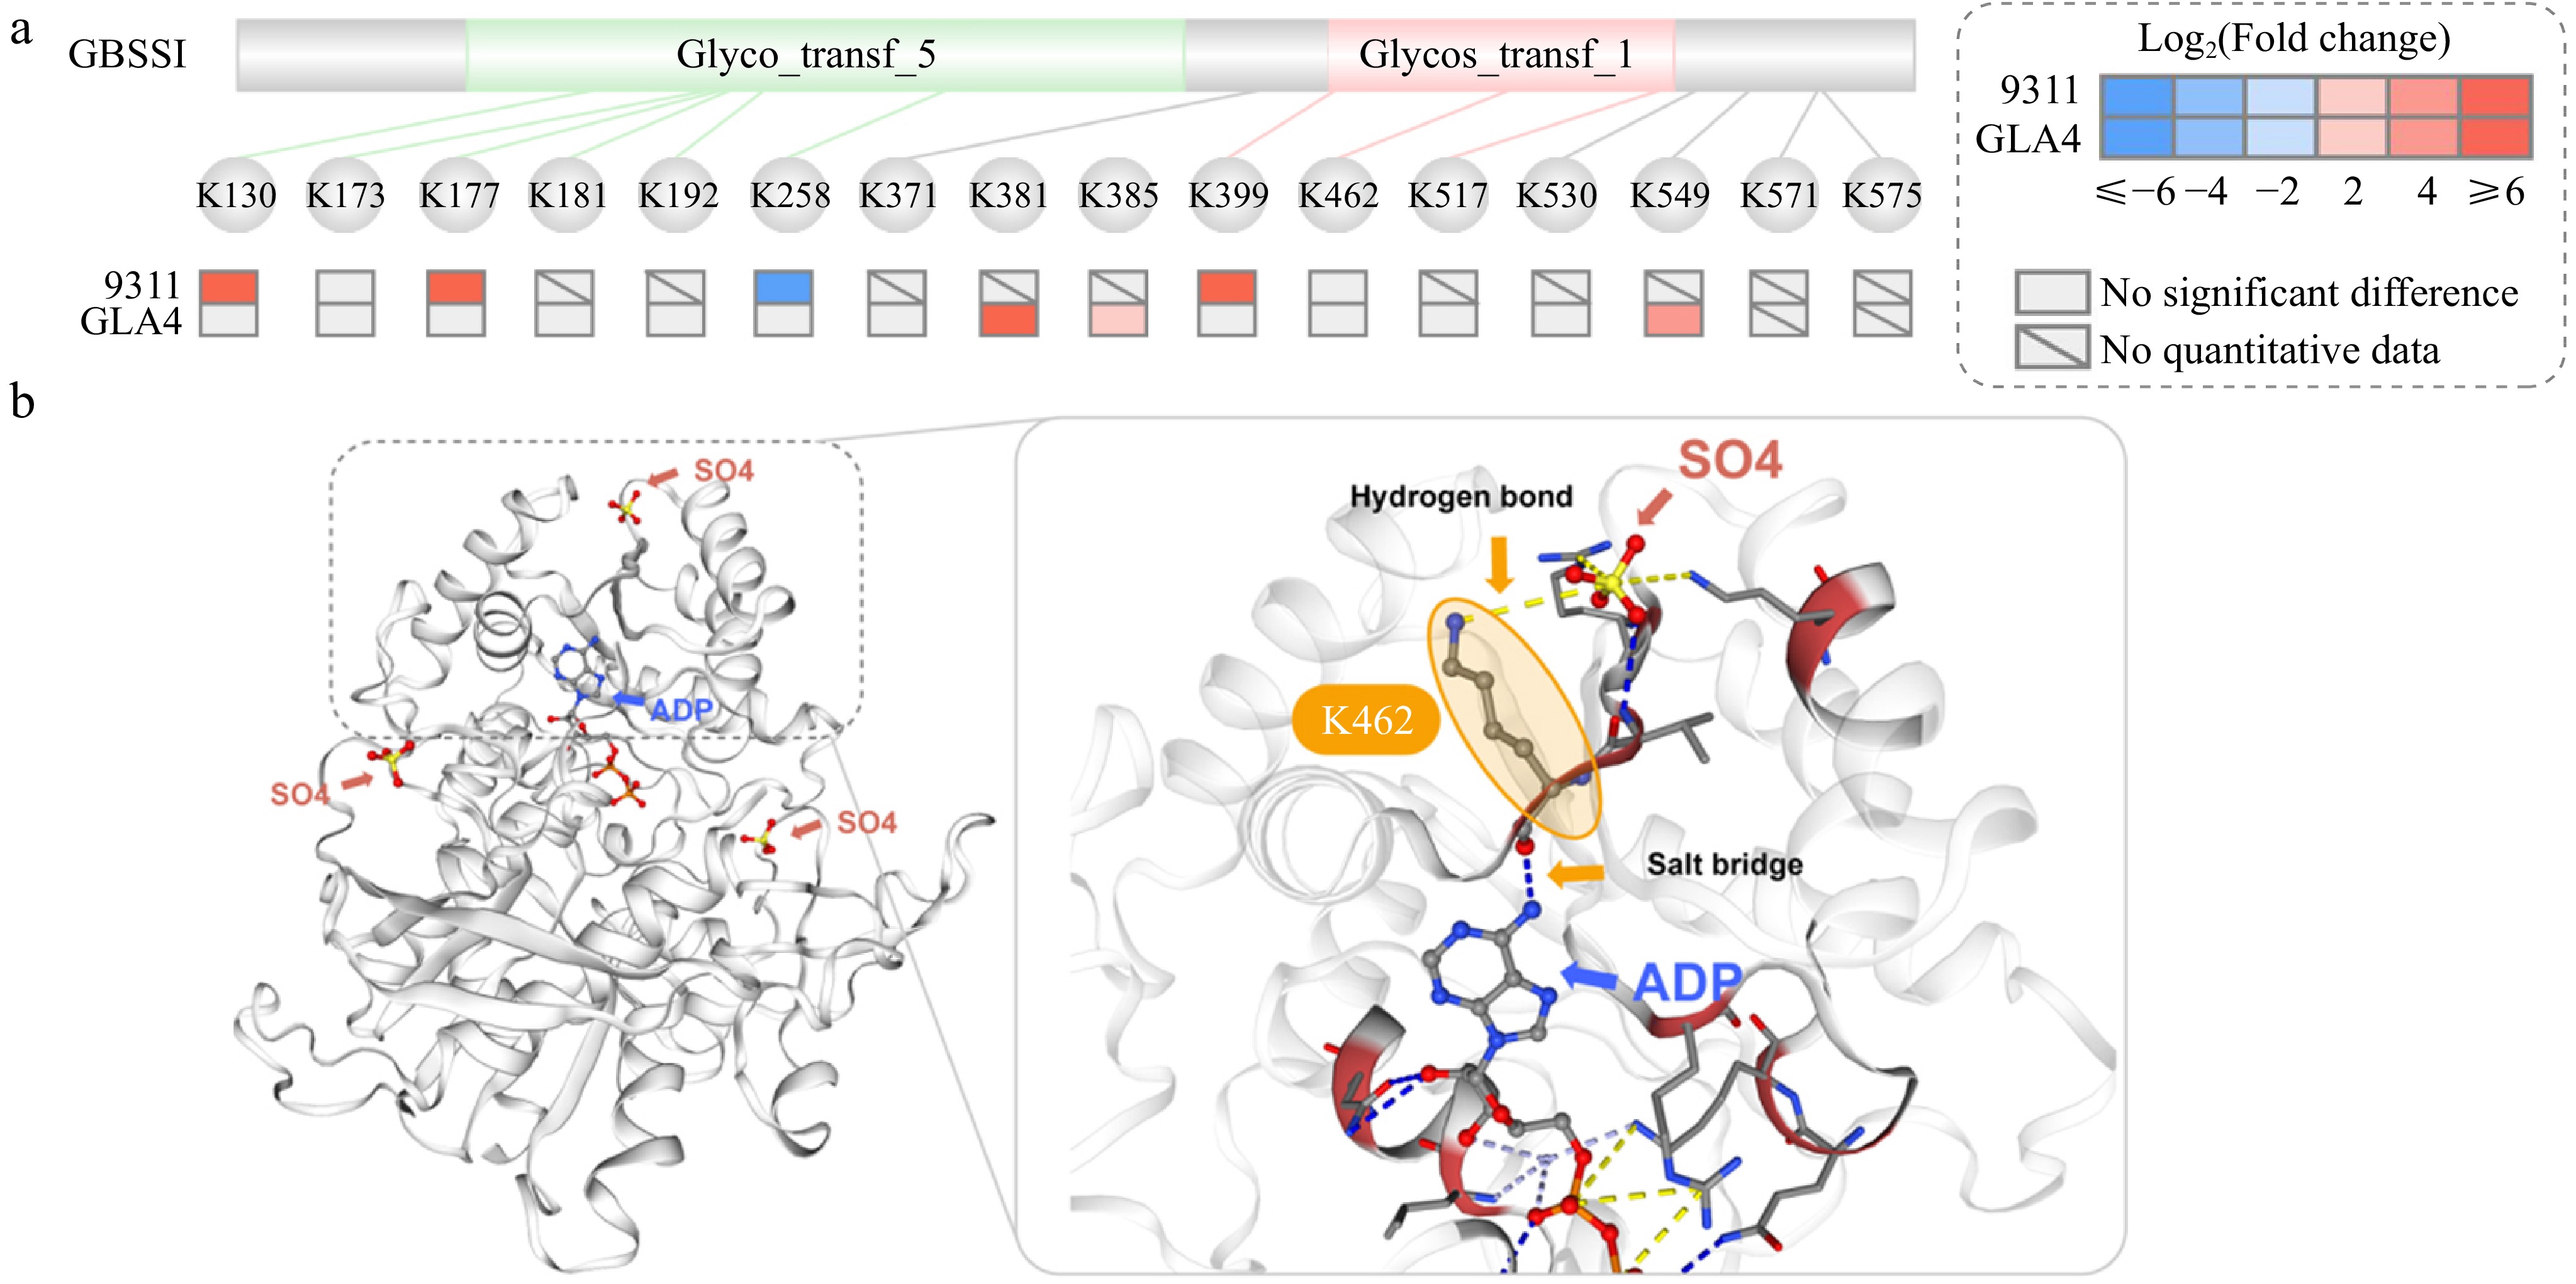
Figure 8.
Structure of GBSSI. (a) Domain structure of GBSSI and ubiquitination sites with significant differences in response to high-temperature stress. (b) 3D model of GBSSI and the relationship between ubiquitination sites K462 and ADP, SO4 (salt bridge or hydrogen bond).
-

Figure 9.
Domain structure of (a) BEs, (b) PUL and (c) Pho1 as well as their ubiquitination sites with significant differences in response to heat stress. Residues in red indicate the ubiquitination site. Non-ubiquitinated residues are shown in dark grey.
-
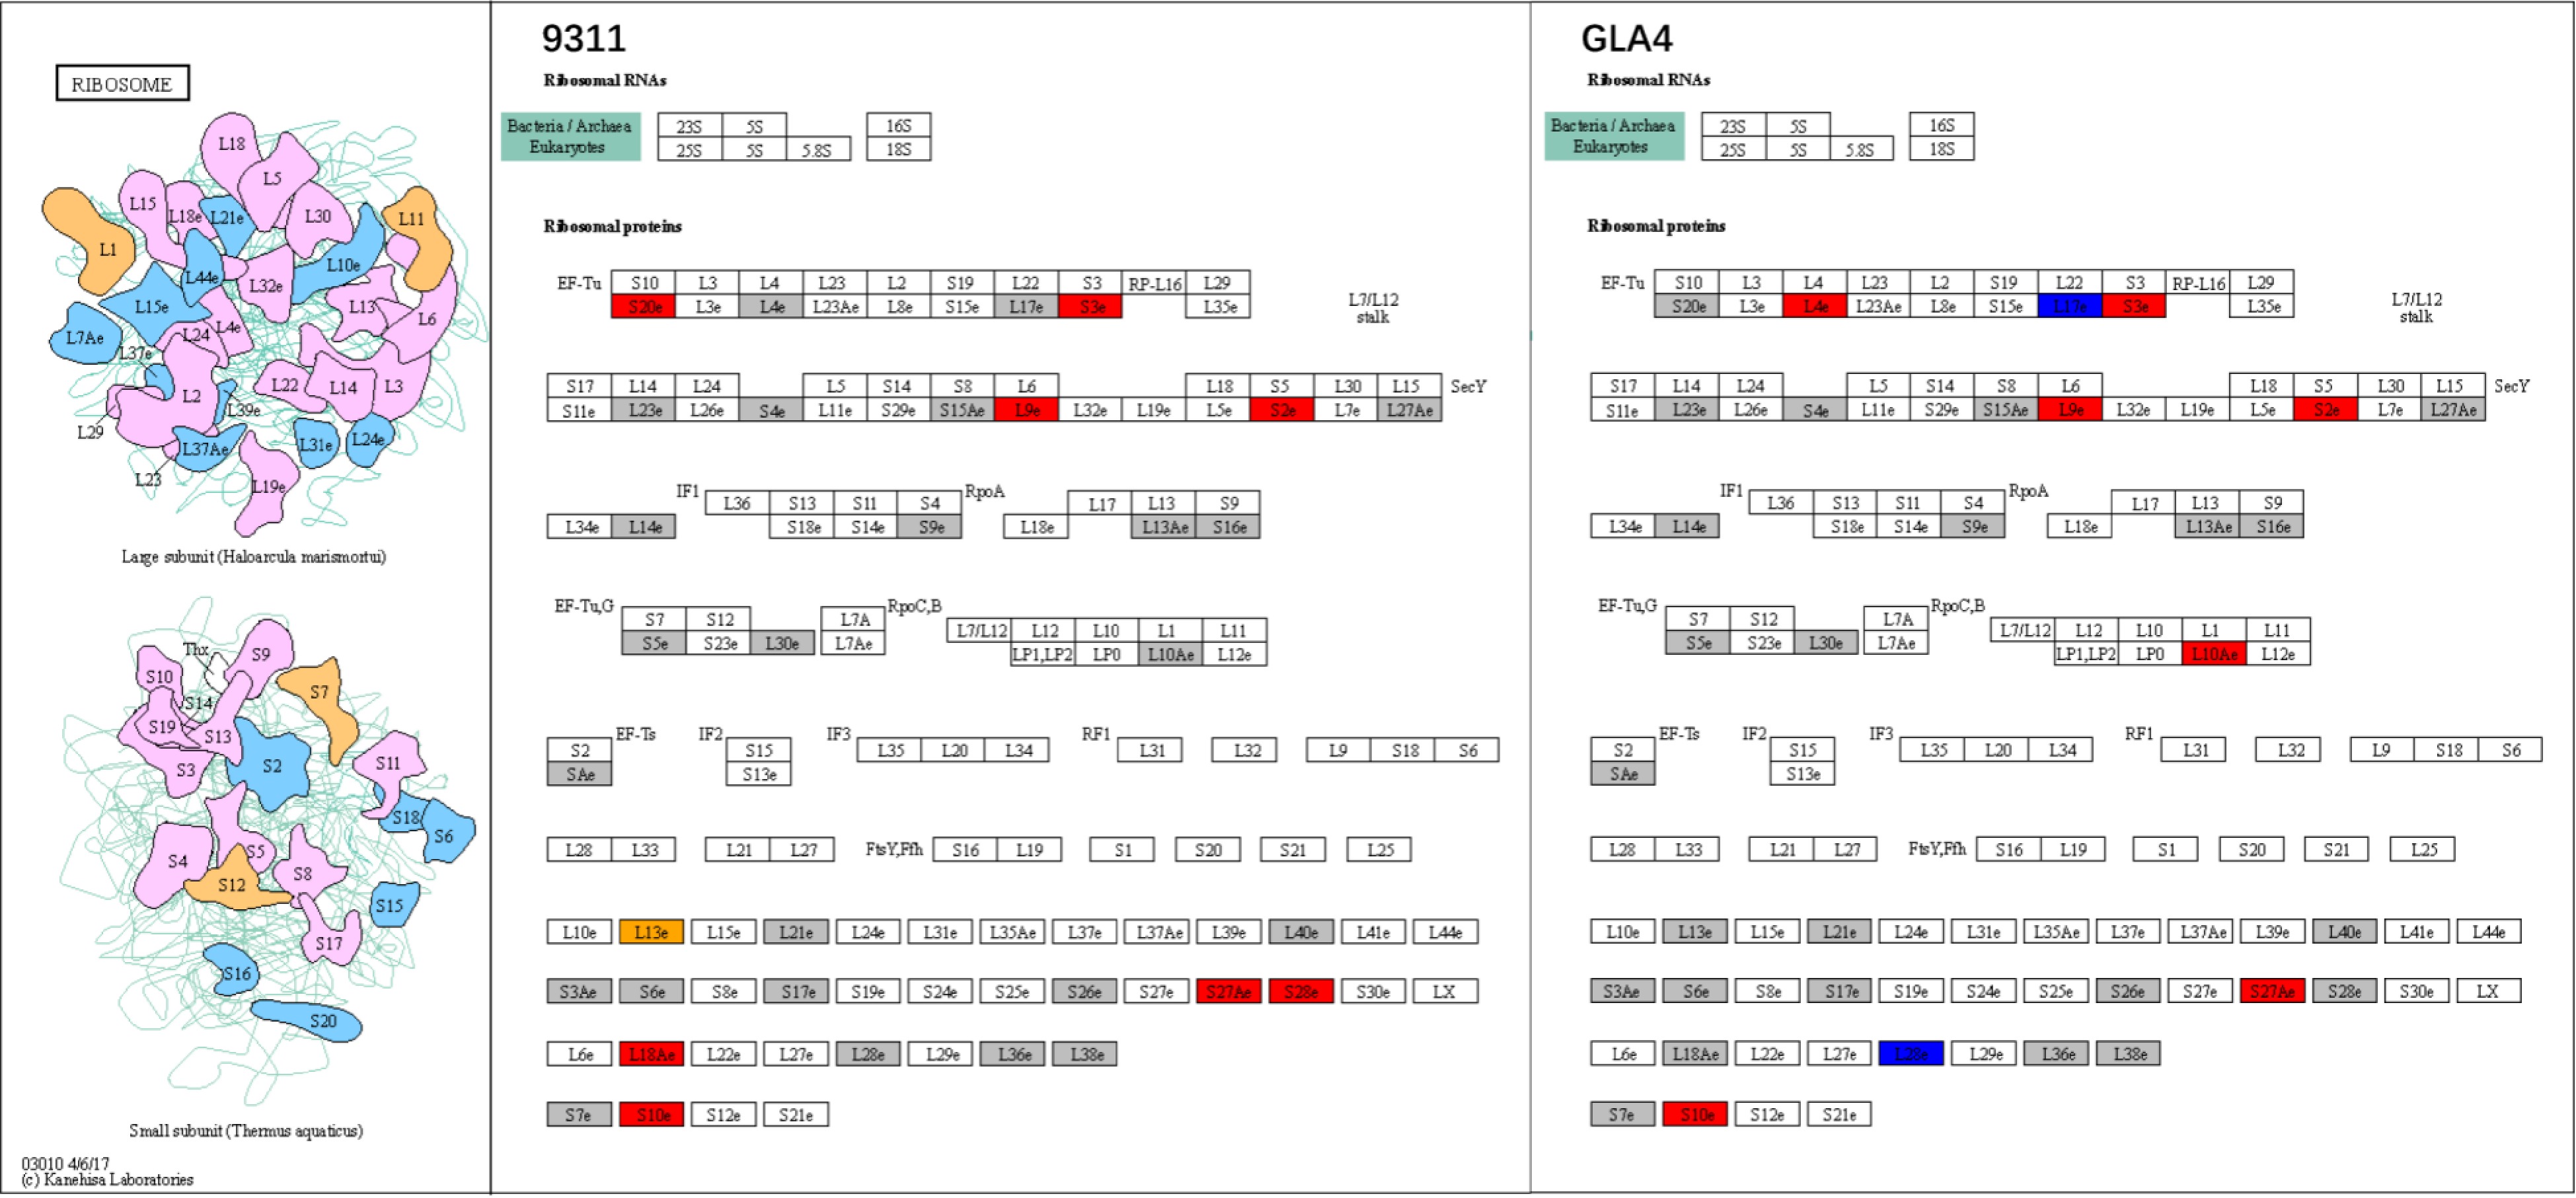
Figure 10.
Ribosome system at the ubiquitination levels in rice endosperm under high-temperature stress. Grey shadings represent ubiquitinated proteins with no significant differences under heat stress. Red and blue shadings indicate up-regulated and down-regulated ubiquitinated proteins, respectively. Orange shading displays a combination of up- and down-regulated ubiquitinated sites in the same ubiquitinated protein.
-
Gene name Annotation Protein entry Modification site(s) SUS1 Sucrose synthase 1 BGIOSGA010570 K172, K177 SUS2 Sucrose synthase 2 BGIOSGA021739 K160, K165, K176, K804 SUS3 Sucrose synthase 3 BGIOSGA026140 K172, K177, K541, K544, K588 FK Fructokinase BGIOSGA027875 K143 UGPase UDP-glucose pyrophosphorylase BGIOSGA031231 K27, K150, K303, K306 AGPS1 ADP-glucose pyrophosphorylase small subunit 1 BGIOSGA030039 K94, K464, K484 AGPS2 ADP-glucose pyrophosphorylase small subunit 2 BGIOSGA027135 K106, K132, K385, K403, K406, K476, K496 AGPL2 ADP-glucose pyrophosphorylase large subunit 2 BGIOSGA004052 K41, K78, K134, K191, K227, K254, K316, K338, K394, K396, K463, K508, K513 AGPL3 ADP-glucose pyrophosphorylase large subunit 3 BGIOSGA017490 K509 GBSSI Granule bound starch synthase I BGIOSGA022241 K130, K173, K177, K181, K192, K258, K371, K381, K385, K399, K462, K517, K530, K549, K571, K575 BEI Starch branching enzyme I BGIOSGA020506 K103, K108, K122 BEIIb Starch branching enzyme IIb BGIOSGA006344 K134 PUL Starch debranching enzyme:Pullulanase BGIOSGA015875 K230, K330, K431, K736, K884 PHO1 Plastidial phosphorylase BGIOSGA009780 K277, K445, K941 Table 1.
Ubiquitination sites related to sucrose and starch metabolism in rice endosperm.
Figures
(10)
Tables
(1)