-
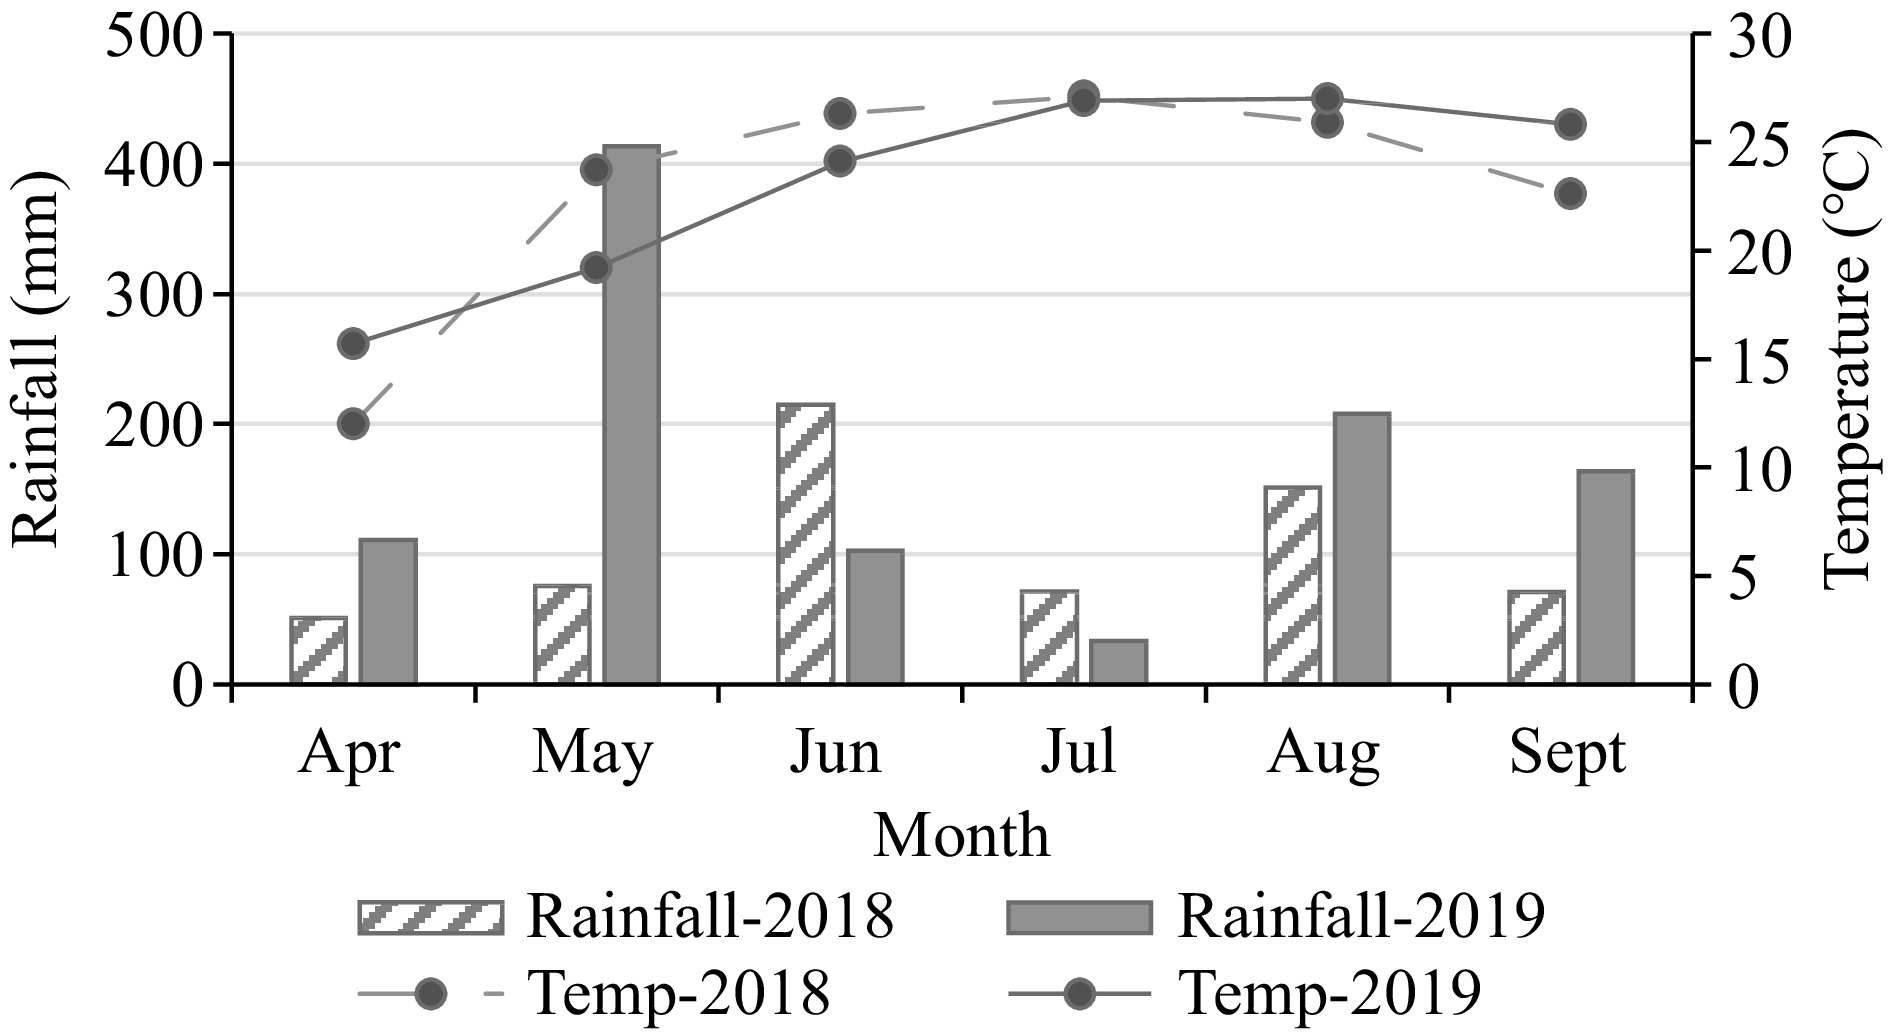
Figure 1.
Average daily air temperature and total monthly rainfall (April, May, June, July, August, and September) in 2018 and 2019 at Lake Carl Blackwell (LCB), OK, USA.
-
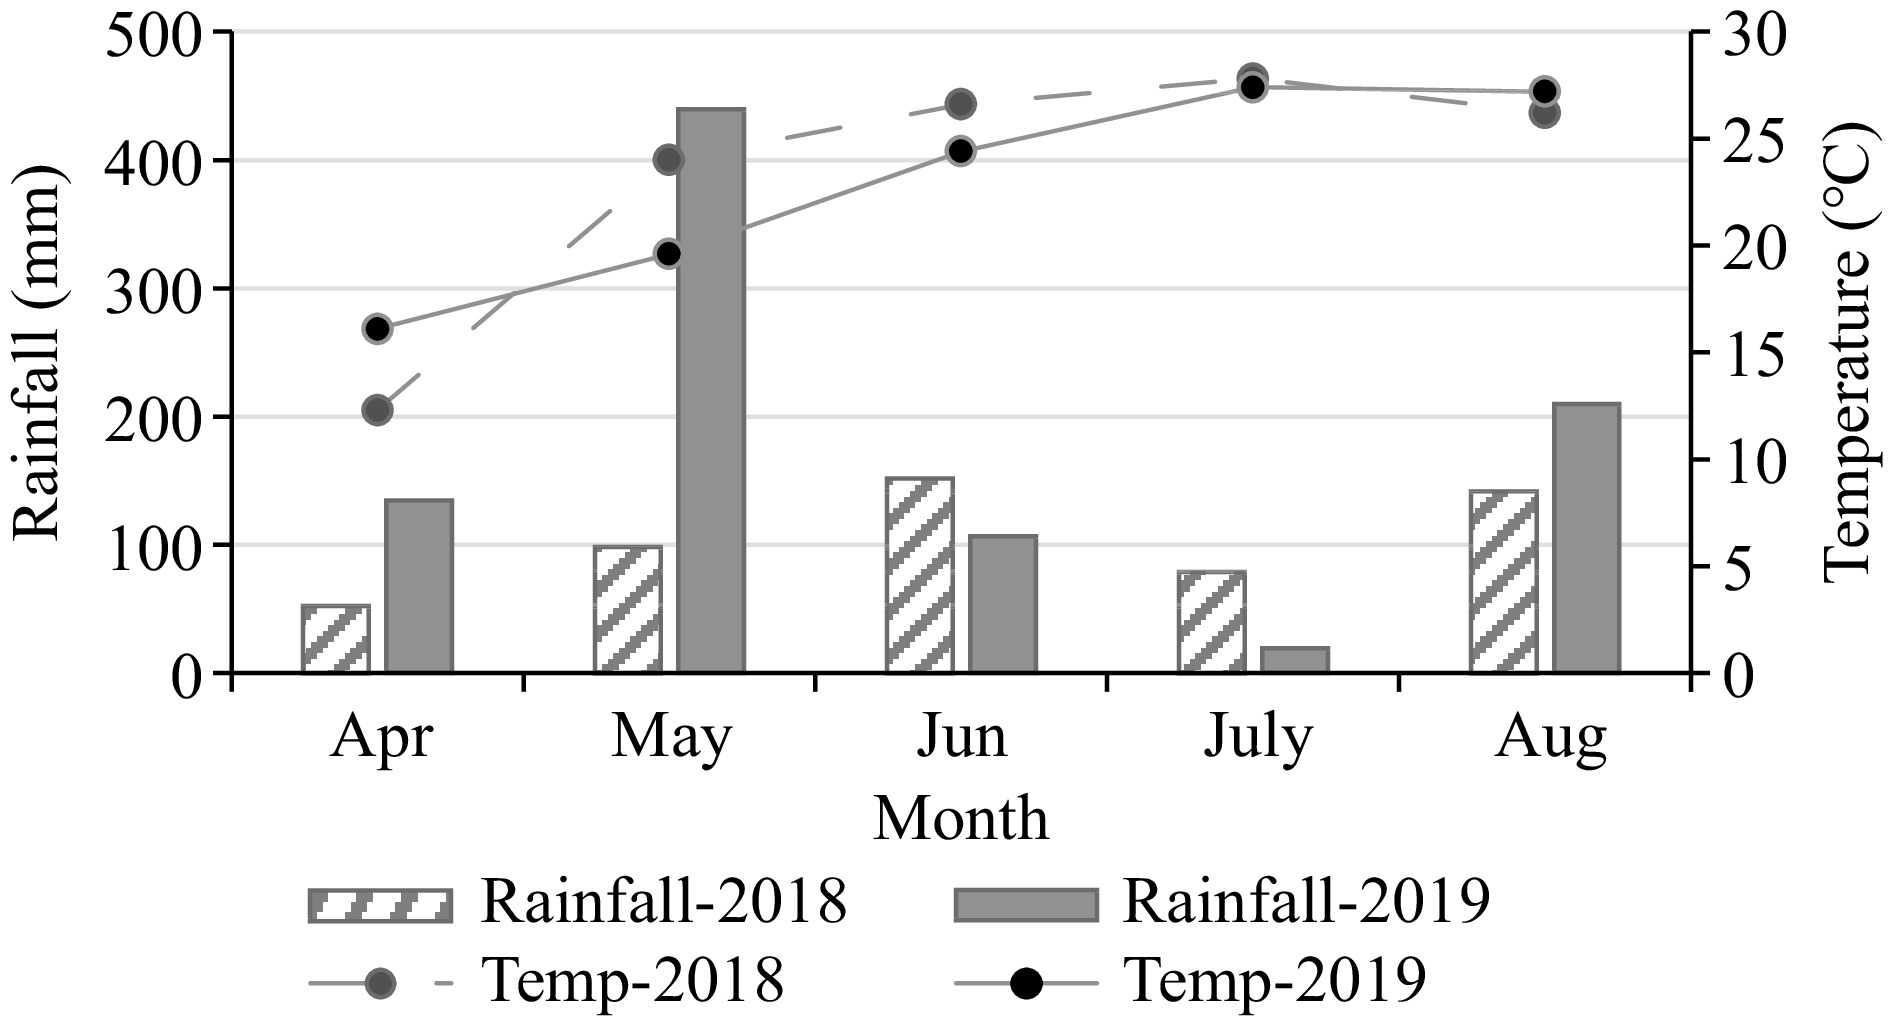
Figure 2.
Average daily air temperature and total monthly rainfall (April, May, June, July, and August) in 2018 and 2019 at Efaw Research station OK, USA.
-
Biochar/Site pH K
mg·kg−1Ca
mg·kg−1Mg
mg·kg−1Mn
mg·kg−1Fe
mg·kg−1BD
g·cm−1TP
mg·kg−1TN
g·kg−1TOC
g·kg−1Biochar 7.4 612 4128 1225 234 595 0.48 4.53 5.9 876.7 LCB 5.7 349 804 207 x x x 12 0.8 9.1 Efaw 5.6 153 1466 354 x x x 13 0.7 6.8 TP, Total phosphate; TN, Total nitrogen; TOC, Total organic carbon; BD, Bulk density; x, values not determined. Initial soil properties were determined before the first year of biochar application. Table 1.
Physical and chemical properties of soft wood (Southern Yellow Pine) biochar (supplied by Wakefield Biochar, Columbia, MO, USA). The initial soil chemical properties at Lake Carl Blackwell (LCB) and Efaw research sites (Stillwater, OK, USA).
-
Exp. Trt. N rate
(kg·ha−1)Biochar
(t·ha−1)CEC (meq/100 g ) at Efaw CEC (meq/100 g ) at LCB 2018 2019 2018 2019 Mean ± S.E. Mean ± S.E. Mean ± S.E. Mean ± S.E. 1 0 0 11.08 0.4 11.52 0.51 6.7 0.76 8.47 0.61 2 50 0 10.3 0.35 11.17 0.59 6.71 0.91 8.66 1.09 3 100 0 11.18 0.51 12.3 0.44 6.21 0.37 7.87 0.27 4 150 0 10.64 0.21 11.31 0.33 6.27 0.52 7.93 0.64 5 0 5 11.27 0.35 11.94 0.51 7.46 0.54 9.68 0.53 6 0 10 10.99 0.34 11.96 0.66 6.99 1.56 9.66 2.16 7 0 15 11.54 0.98 11.01 0.42 7.07 0.45 9.33 0.74 8 50 5 10.95 0.42 11.38 0.24 7.01 0.86 8.55 0.55 9 100 10 11.45 0.62 12.38 0.36 8.2 0.23 10.23 0.18 10 150 15 11.49 0.25 12.28 0.4 7.78 0.36 10.16 0.5 Pr > F 0.7552 0.3372 0.7021 0.5131 C.V., % 7.7 6.8 18.5 17.2 Contrasts F Pr > F F Pr > F F Pr > F F Pr > F 2 vs 8 1.17 0.3014 0.14 0.7138 0.13 0.7253 0.2 0.6641 3 vs 9 0.21 0.6579 0.02 0.8813 5.91 0.0317 5.49 0.0372 4 vs 10 2.04 0.1782 2.77 0.1222 5.03 0.0446 6.7 0.0237 2, 3 and 4 vs 8, 9 and 10 2.93 0.1127 1.6 0.2299 8.44 0.0132 9.64 0.0091 Exp. Trt., Experimental treatment; C.V., Coefficient of variation; S.E., standard error (± S.E., n = 3); Urea ammonium N (28:0:0) was used as N source. Biochar was applied after urea ammonium N and mixed within a 15 cm soil layer. Table 2.
Treatment means for cation exchange capacity (CEC) and contrasts between fertilizer N (NF) and biochar plus fertilizer N (NB) at Efaw and Lake Carl Blackwell (LCB), OK, USA, 2018 and 2019.
-
N rate
(kg·ha−1)Biochar
(t ha−1)pH at Efaw pH at LCB 2018 2019 2018 2019 Mean ± S.E. Mean ± S.E. Mean ± S.E. Mean ± S.E. 0 0 5.74 0.06 5.65 0.22 5.82 0.08 5.79 0.03 50 0 5.7 0.02 5.75 0.11 5.76 0.06 5.83 0.09 100 0 5.87 0.06 5.76 0.1 5.88 0.08 5.75 0.06 150 0 5.64 0.03 5.6 0.01 5.72 0.04 5.7 0.03 0 5 5.83 0.02 5.8 0.11 5.85 0.07 5.89 0.01 0 10 5.93 0.07 5.97 0.17 5.92 0.15 5.85 0.05 0 15 5.98 0.12 5.83 0.1 5.87 0.11 5.95 0.05 50 5 5.8 0.1 5.83 0.03 5.93 0.11 5.91 0.07 100 10 5.98 0.09 5.99 0.05 5.91 0.02 5.95 0.08 150 15 6.1 0.07 5.95 0.13 6.18 0.02 5.96 0.02 0.0063 0.0641 0.0761 0.0498 2.2 2.5 2.5 1.8 F Pr > F F Pr > F F Pr > F F Pr > F 1.04 0.329 0.45 0.5134 3.54 0.0842 1.02 0.3332 1.3 0.2756 3.75 0.0768 0.09 0.765 5.41 0.0383 21.81 0.0005 8.52 0.0129 25.66 0.0003 8.69 0.0122 2, 3 & 4 vs 8, 9 & 10 15.55 0.002 10.19 0.0078 17.54 0.0013 13.15 0.0035 Exp. Trt., Experimental treatment; C.V., Coefficient of variation; S.E., standard error (± SE, n = 3); Urea ammonium N (28:0:0) was used as N source. Biochar was applied after urea ammonium N and mixed within a 15 cm layer. Table 3.
Treatment means for pH and contrasts between fertilizer N (NF) and biochar plus fertilizer N (NB) at Efaw and Lake Carl Blackwell (LCB), OK, USA, 2018 and 2019.
-
Exp. Trt. N rate
(kg·ha−1)Biochar
(t·ha−1)EC (µS·cm−1) at Efaw EC (µS·cm−1) at LCB 2018 2019 2018 2019 Mean ± S.E. Mean ± S.E. Mean ± S.E. Mean ± S.E. 1 0 0 184.37 14.84 161.6 47.32 171.6 21.44 106.4 6.31 2 50 0 196.13 10.2 118.63 10.42 175.73 30.66 105.57 7.95 3 100 0 199.67 21.14 125.63 4.36 170.07 21.93 108.13 9.17 4 150 0 220.67 8.97 103.3 5.06 160.6 11.6 110.07 6.88 5 0 5 213.37 11.79 106.27 7.55 186.3 10.07 128.67 2.38 6 0 10 246.57 54.98 118.73 5.12 186.3 32.66 119.8 5.25 7 0 15 185.23 6.87 109.47 1.38 182.33 16.12 119.73 1.87 8 50 5 200.67 15.37 112.97 12.99 176.03 4.42 108.43 5.64 9 100 10 200.87 18.93 123.37 4.57 196.73 12.94 118.27 5.84 10 150 15 224.47 18.16 82.83 22.53 164.83 7.17 123.53 5.12 Pr > F 0.6668 0.1856 0.9552 0.4464 C.V., % 18.7 18.6 18.8 10.7 Contrasts F Pr > F F Pr > F F Pr > F F Pr > F 2 vs 8 0.04 0.8455 0.11 0.7423 0 0.9904 0.09 0.7743 3 vs 9 0 0.9588 0.02 0.8951 1.19 0.2969 1.07 0.3203 4 vs 10 0.03 0.8702 1.48 0.2475 0.03 0.8654 1.9 0.1934 2, 3 & 4 vs 8, 9 & 10 0.06 0.8131 0.95 0.3494 0.54 0.4755 2.44 0.1439 Exp. Trt., Experimental treatment; C.V., Coefficient of variation; S.E., standard error (± S.E., n = 3); Urea ammonium N (28:0:0) was used as a source of N. Biochar was applied after urea ammonium N and mixed within a 15 cm layer. Table 4.
Treatment means for soil electrical conductivity (EC) and contrasts between fertilizer N (NF) and fertilizer N plus biochar (NB) at Efaw and Lake Carl Blackwell (LCB), OK, USA, 2018 and 2019.
Figures
(2)
Tables
(4)