-
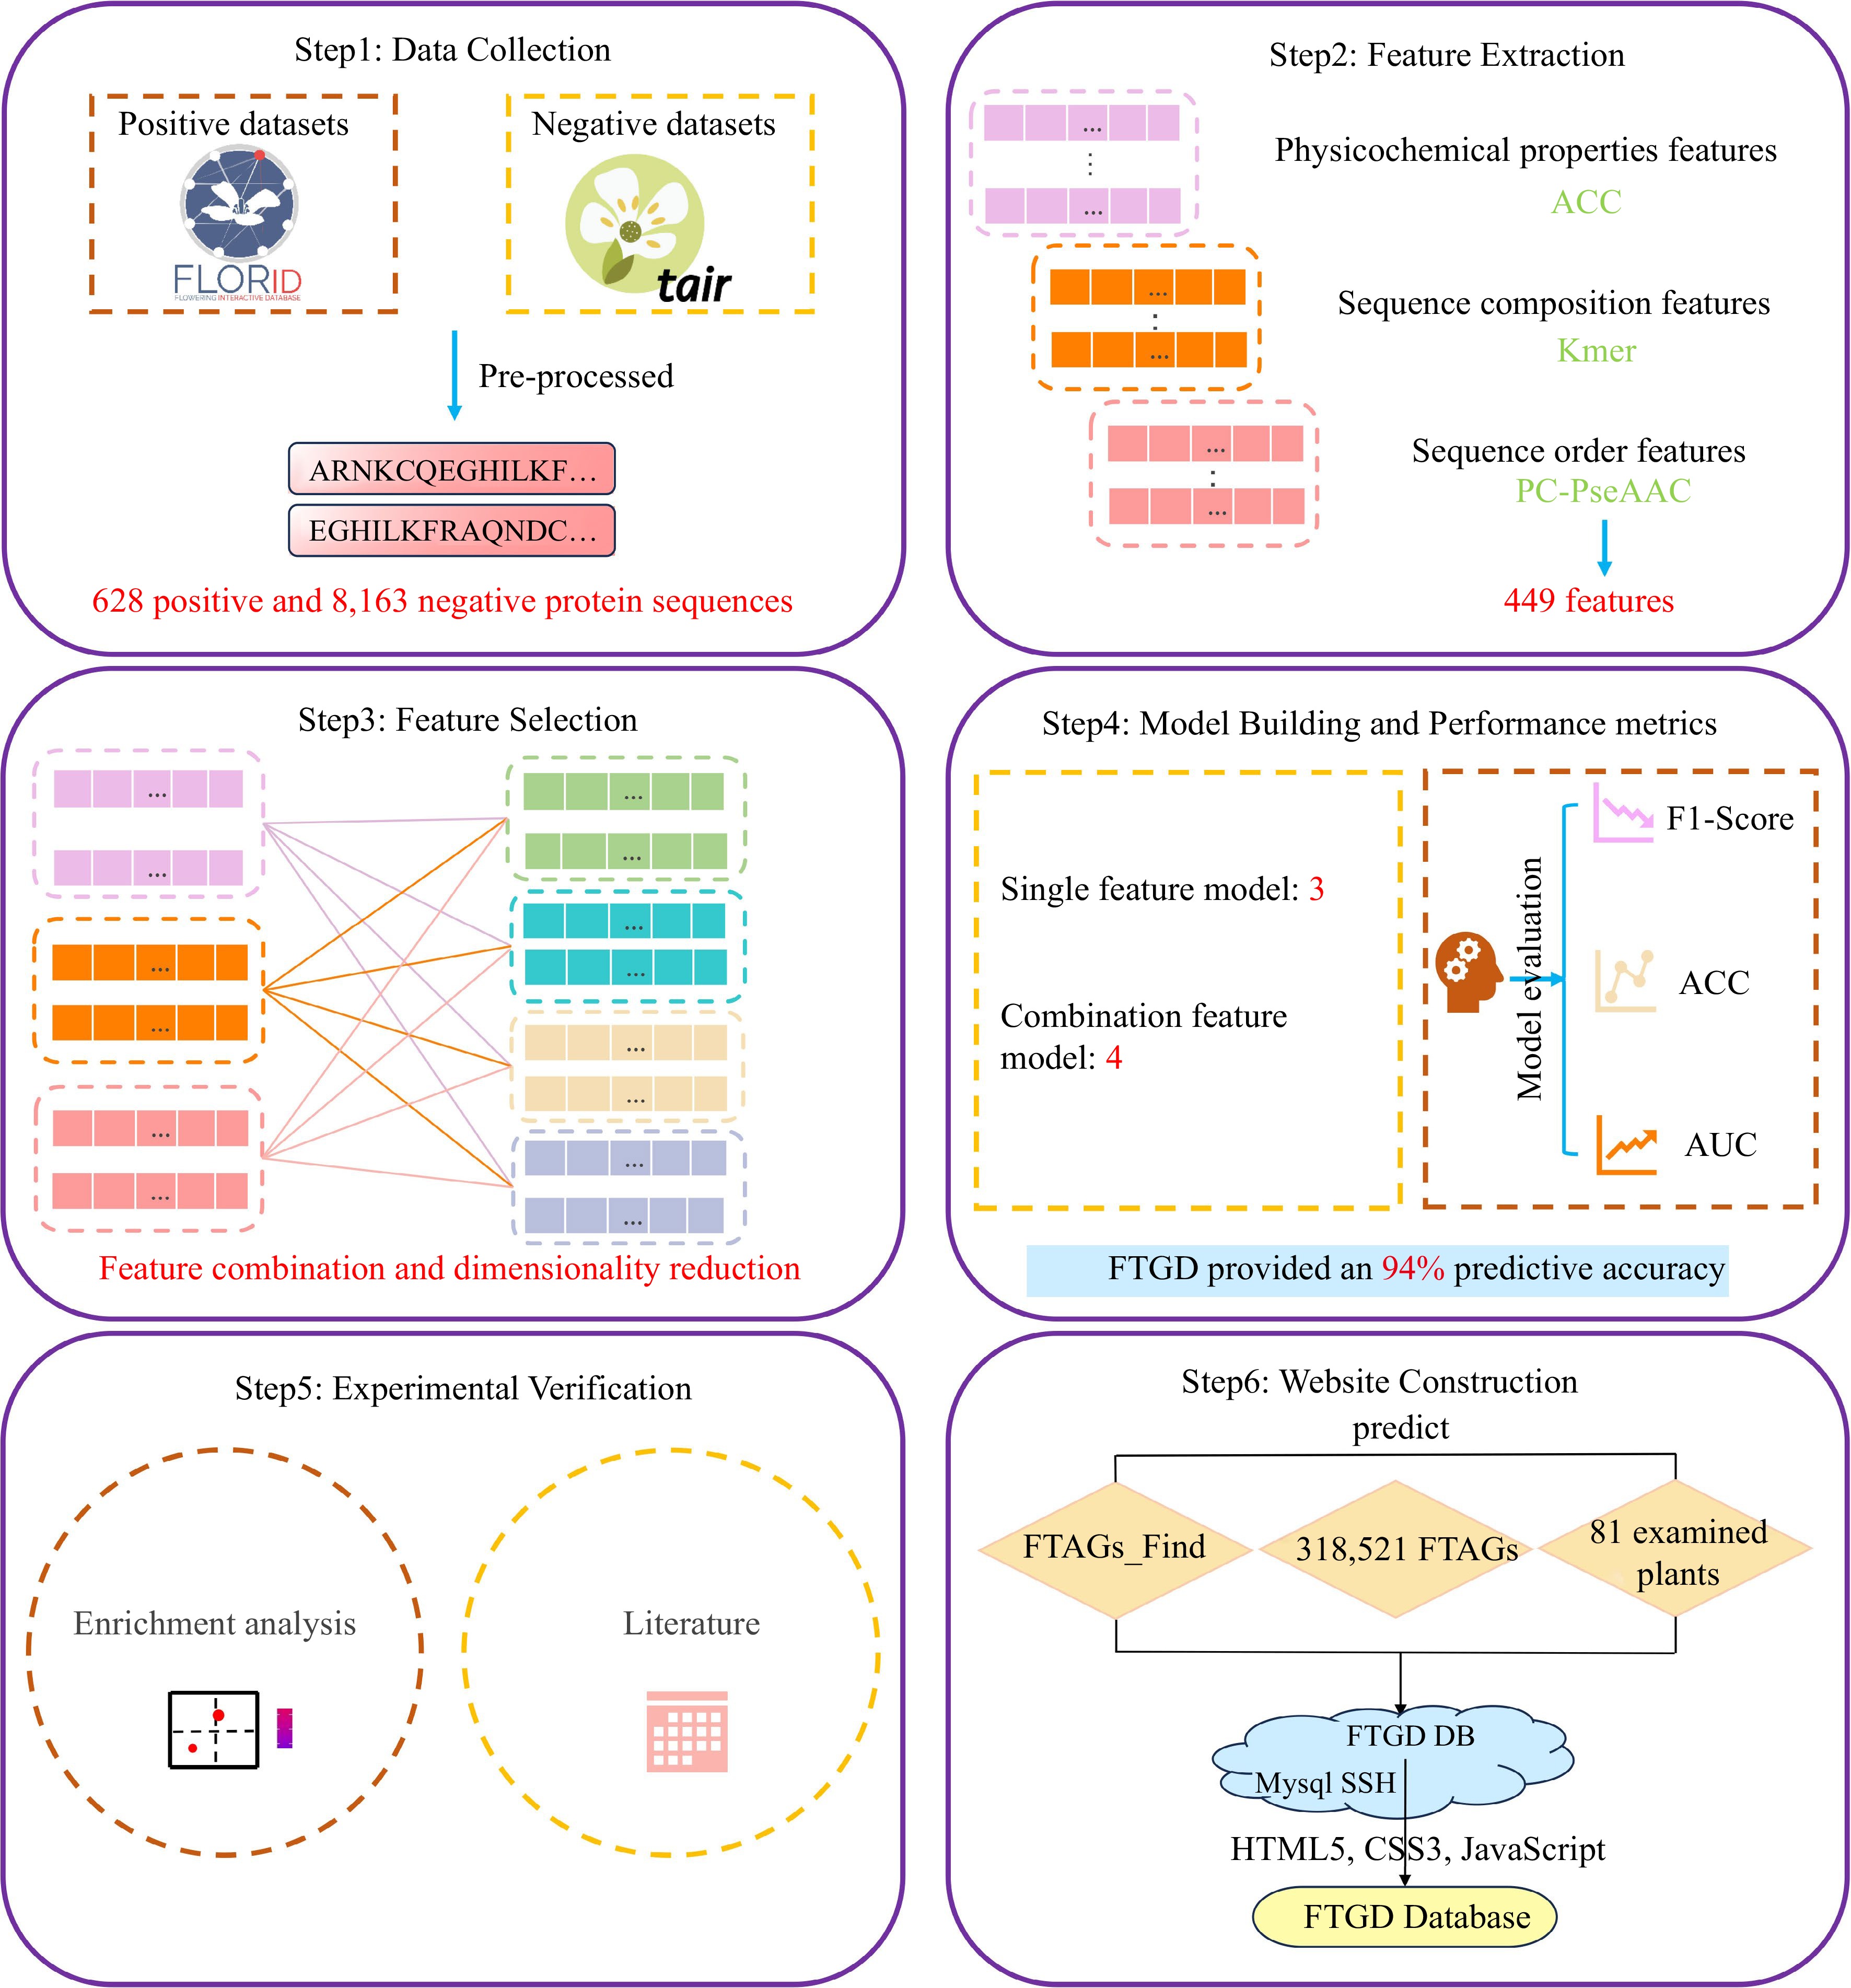
Figure 1.
FTGD platform build flowchart. To develop FTGD, we first collected plant flowering gene datasets from two databases. Second, we extracted features, including physicochemical properties, sequence composition, and sequence order features. Third, we performed feature selection through a combination of features and dimensionality reduction. Fourth, we built seven machine learning models, consisting of three single-feature models and four combination feature models. Fifth, we conducted experimental validation through enrichment analysis and literature review. Finally, we established the FTGD database and provided online prediction capabilities.
-
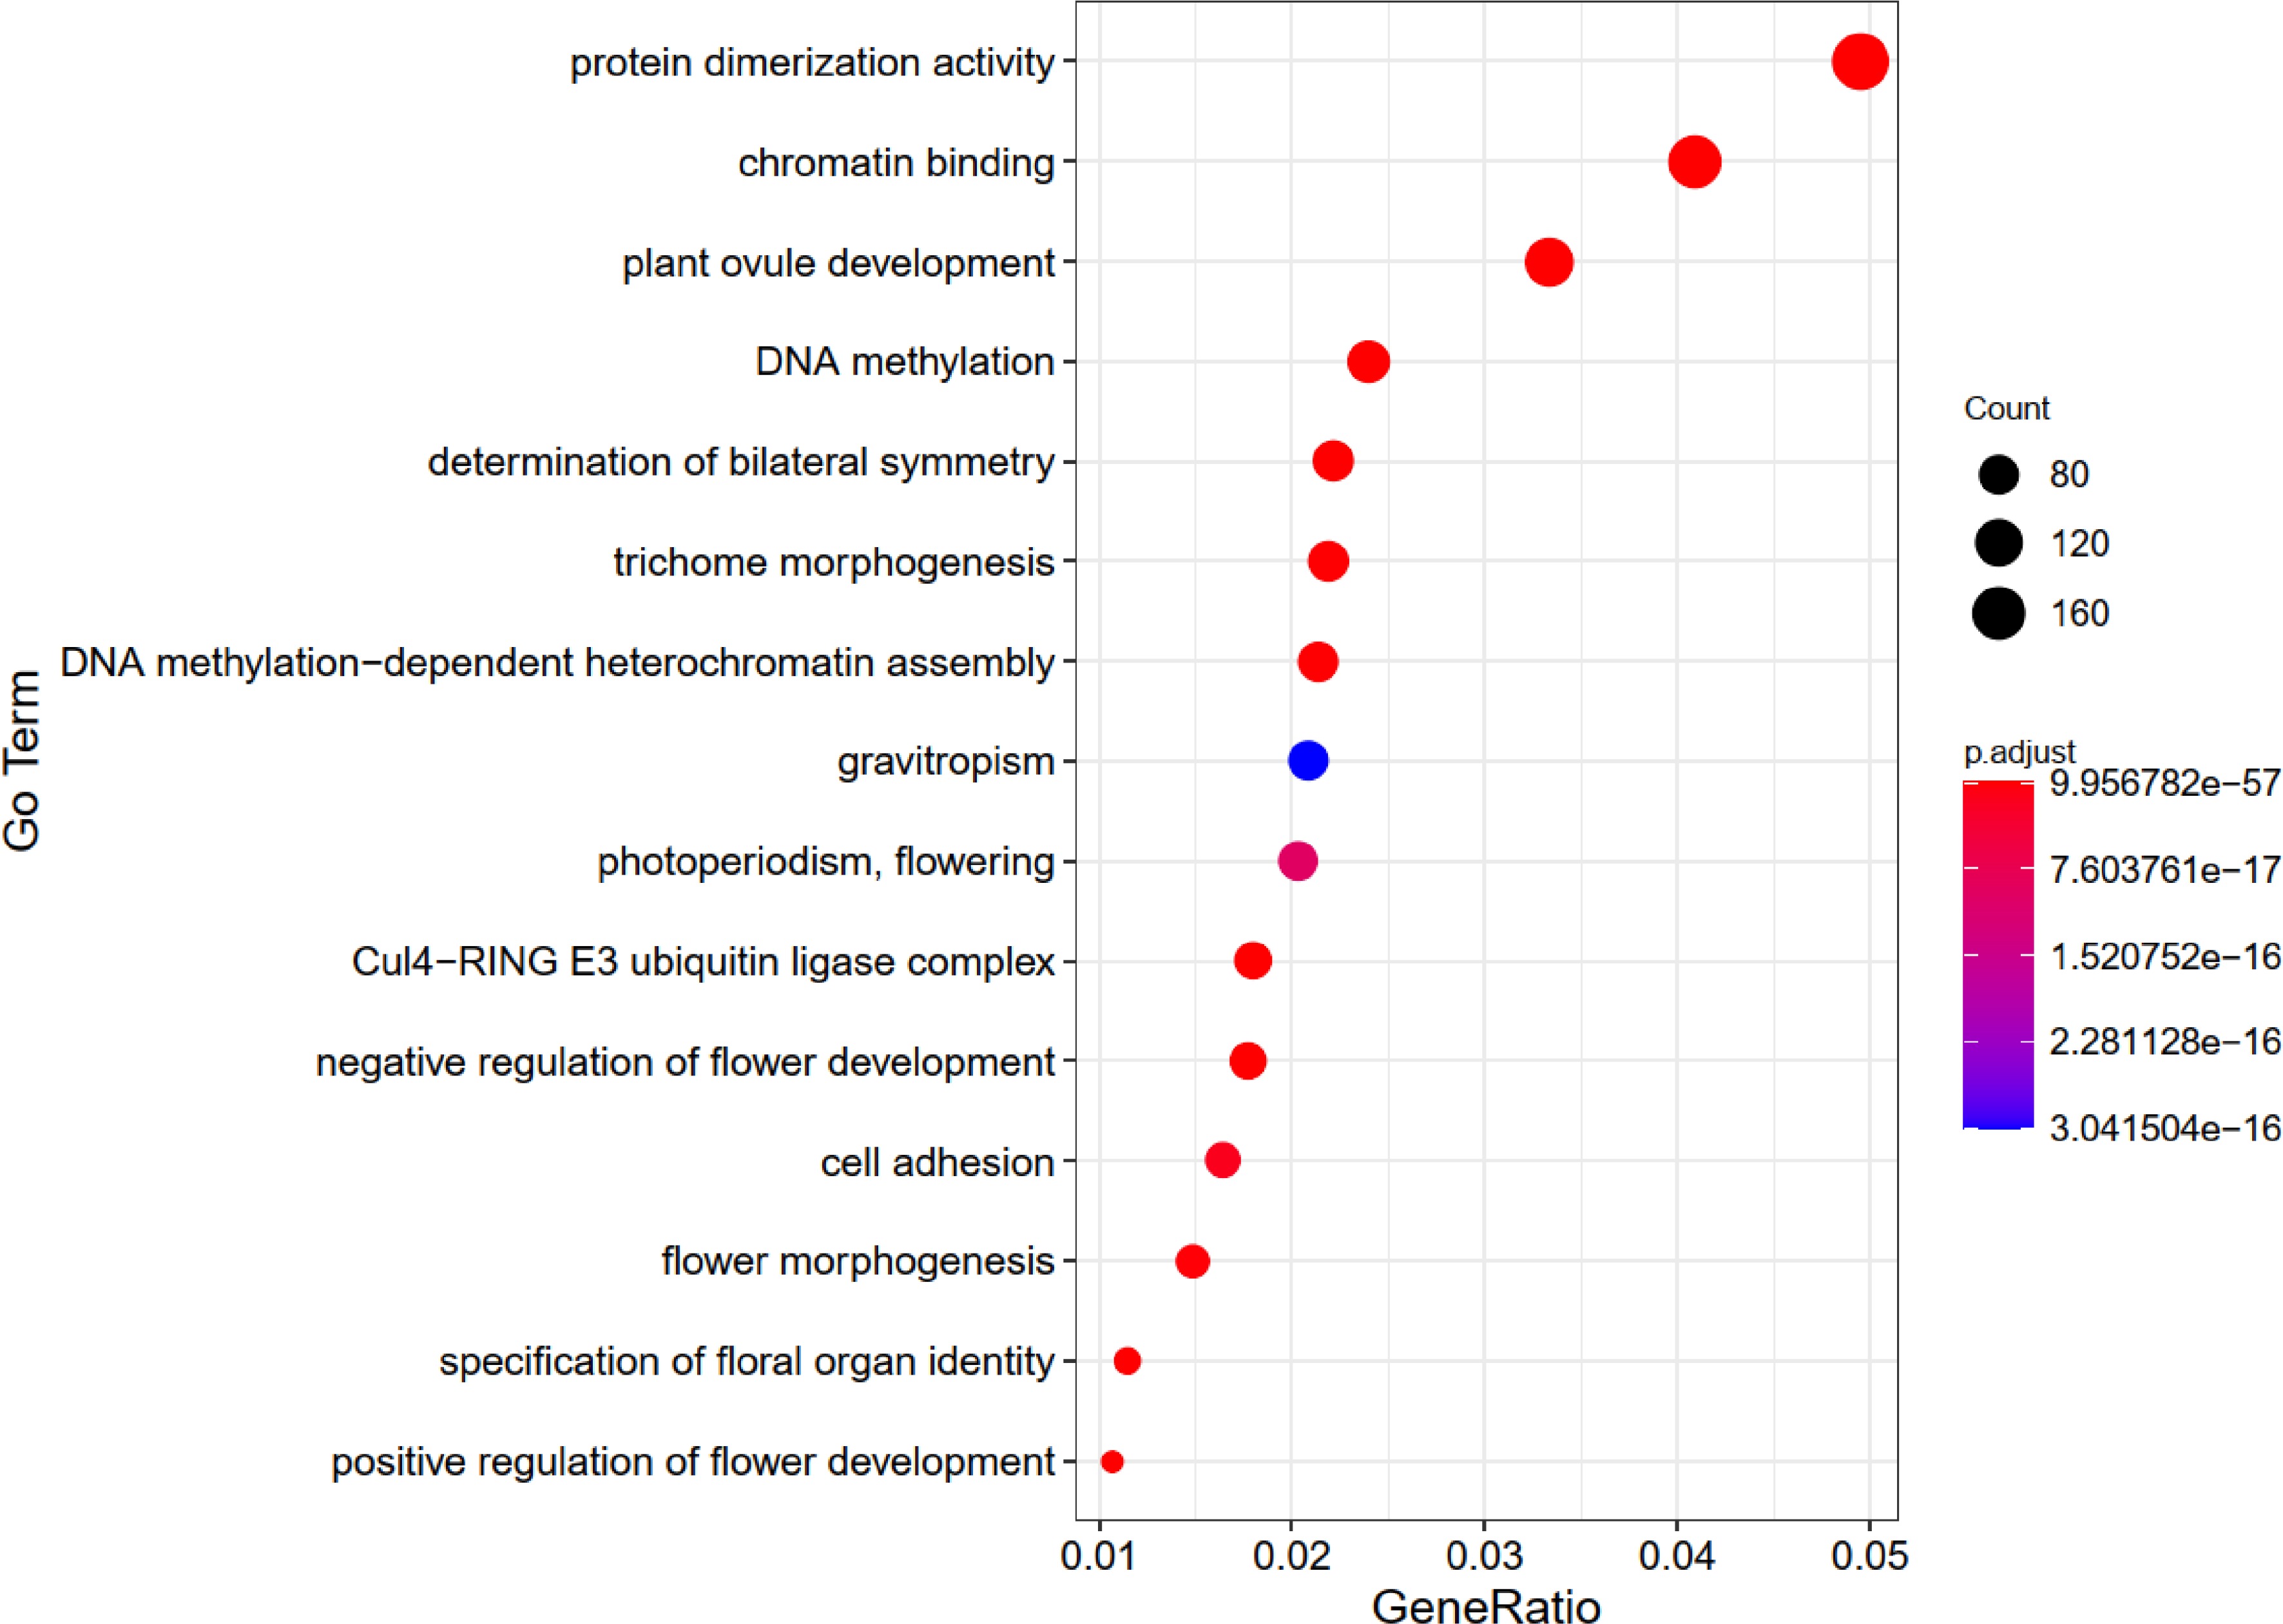
Figure 2.
The top 15 GO enrichment charts for genes related to flowering-time in Brassica rapa.
-
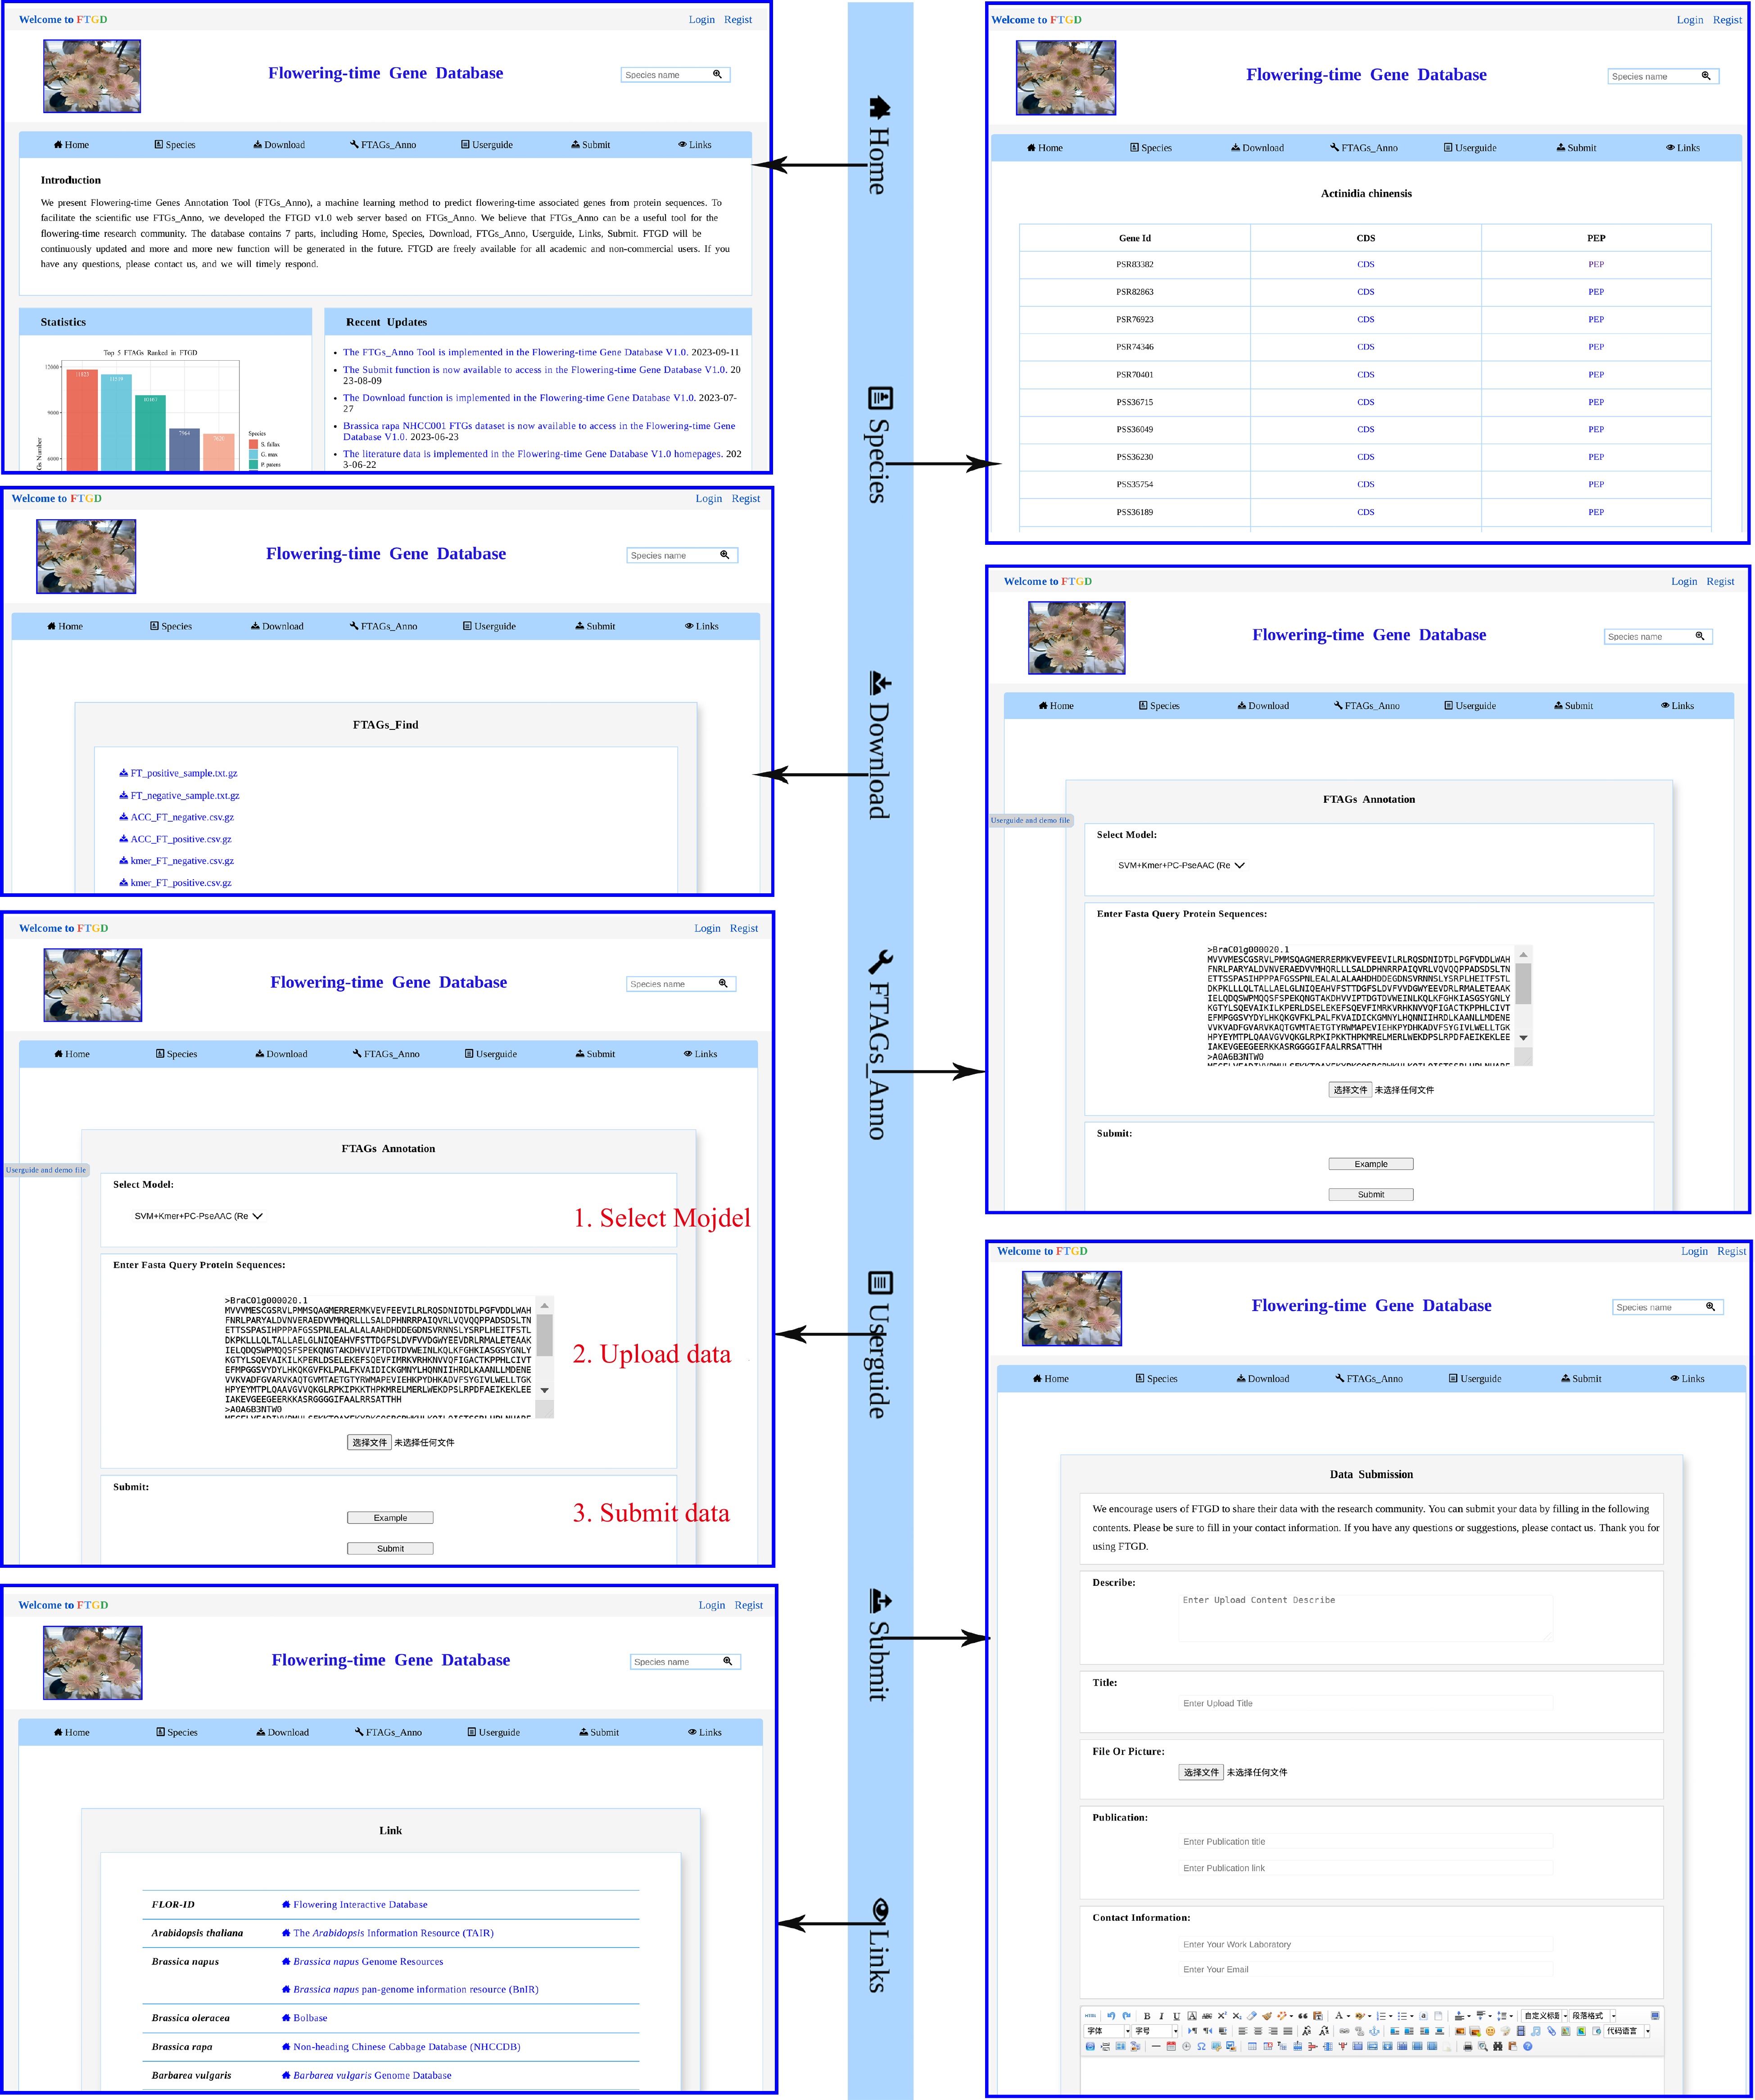
Figure 3.
FTGD website. An overview of the FTGD database, highlighting its key interfaces and internal features, which encompass Home, Species, Download, FTAGs_Anno, Userguide, Submit, and Links interfaces.
-
Methods Number of
featureF1-score ACC AUC SVM-ACC 27 0.769 0.811 0.849 SVM-Kmer 400 0.872 0.890 0.929 SVM-PC-PseAAC 22 0.766 0.810 0.915 SVM-Kmer-ACC 427 0.919 0.926 0.898 SVM-Kmer-PC-PseAAC 422 0.934 0.939 0.943 SVM-ACC-PC-PseAAC 49 0.792 0.829 0.896 SVM-ACC-Kmer-PC-PseAAC 449 0.887 0.901 0.909 Table 1.
The prediction performance of SVM model.
Figures
(3)
Tables
(1)