-

Figure 1.
Comparison of morphology between two genotypes of Citrus junos. (a), (b) Six year old trees; (c), (d) flowers, fruits and seeds; (e) cumulative number of seedlings; (f) percentage of single seed emergence; (g) MITE insertion in five rootstock germplasms. CjSz: Shuzhen No.1 (Citrus. junos Sieb. Tanaka); CjZy: Ziyang Xiangcheng (C. junos Sieb. Tanaka); Cp: citrange (C. sinensis Osbeck. × Poncirus trifoliate Raf.); Pt: trifoliate orange (P. trifoliate [L.] Raf) and Ct: Red tangerine (C. tangerine Hort. Ex Tanaka). Scale bars = 1 cm.
-
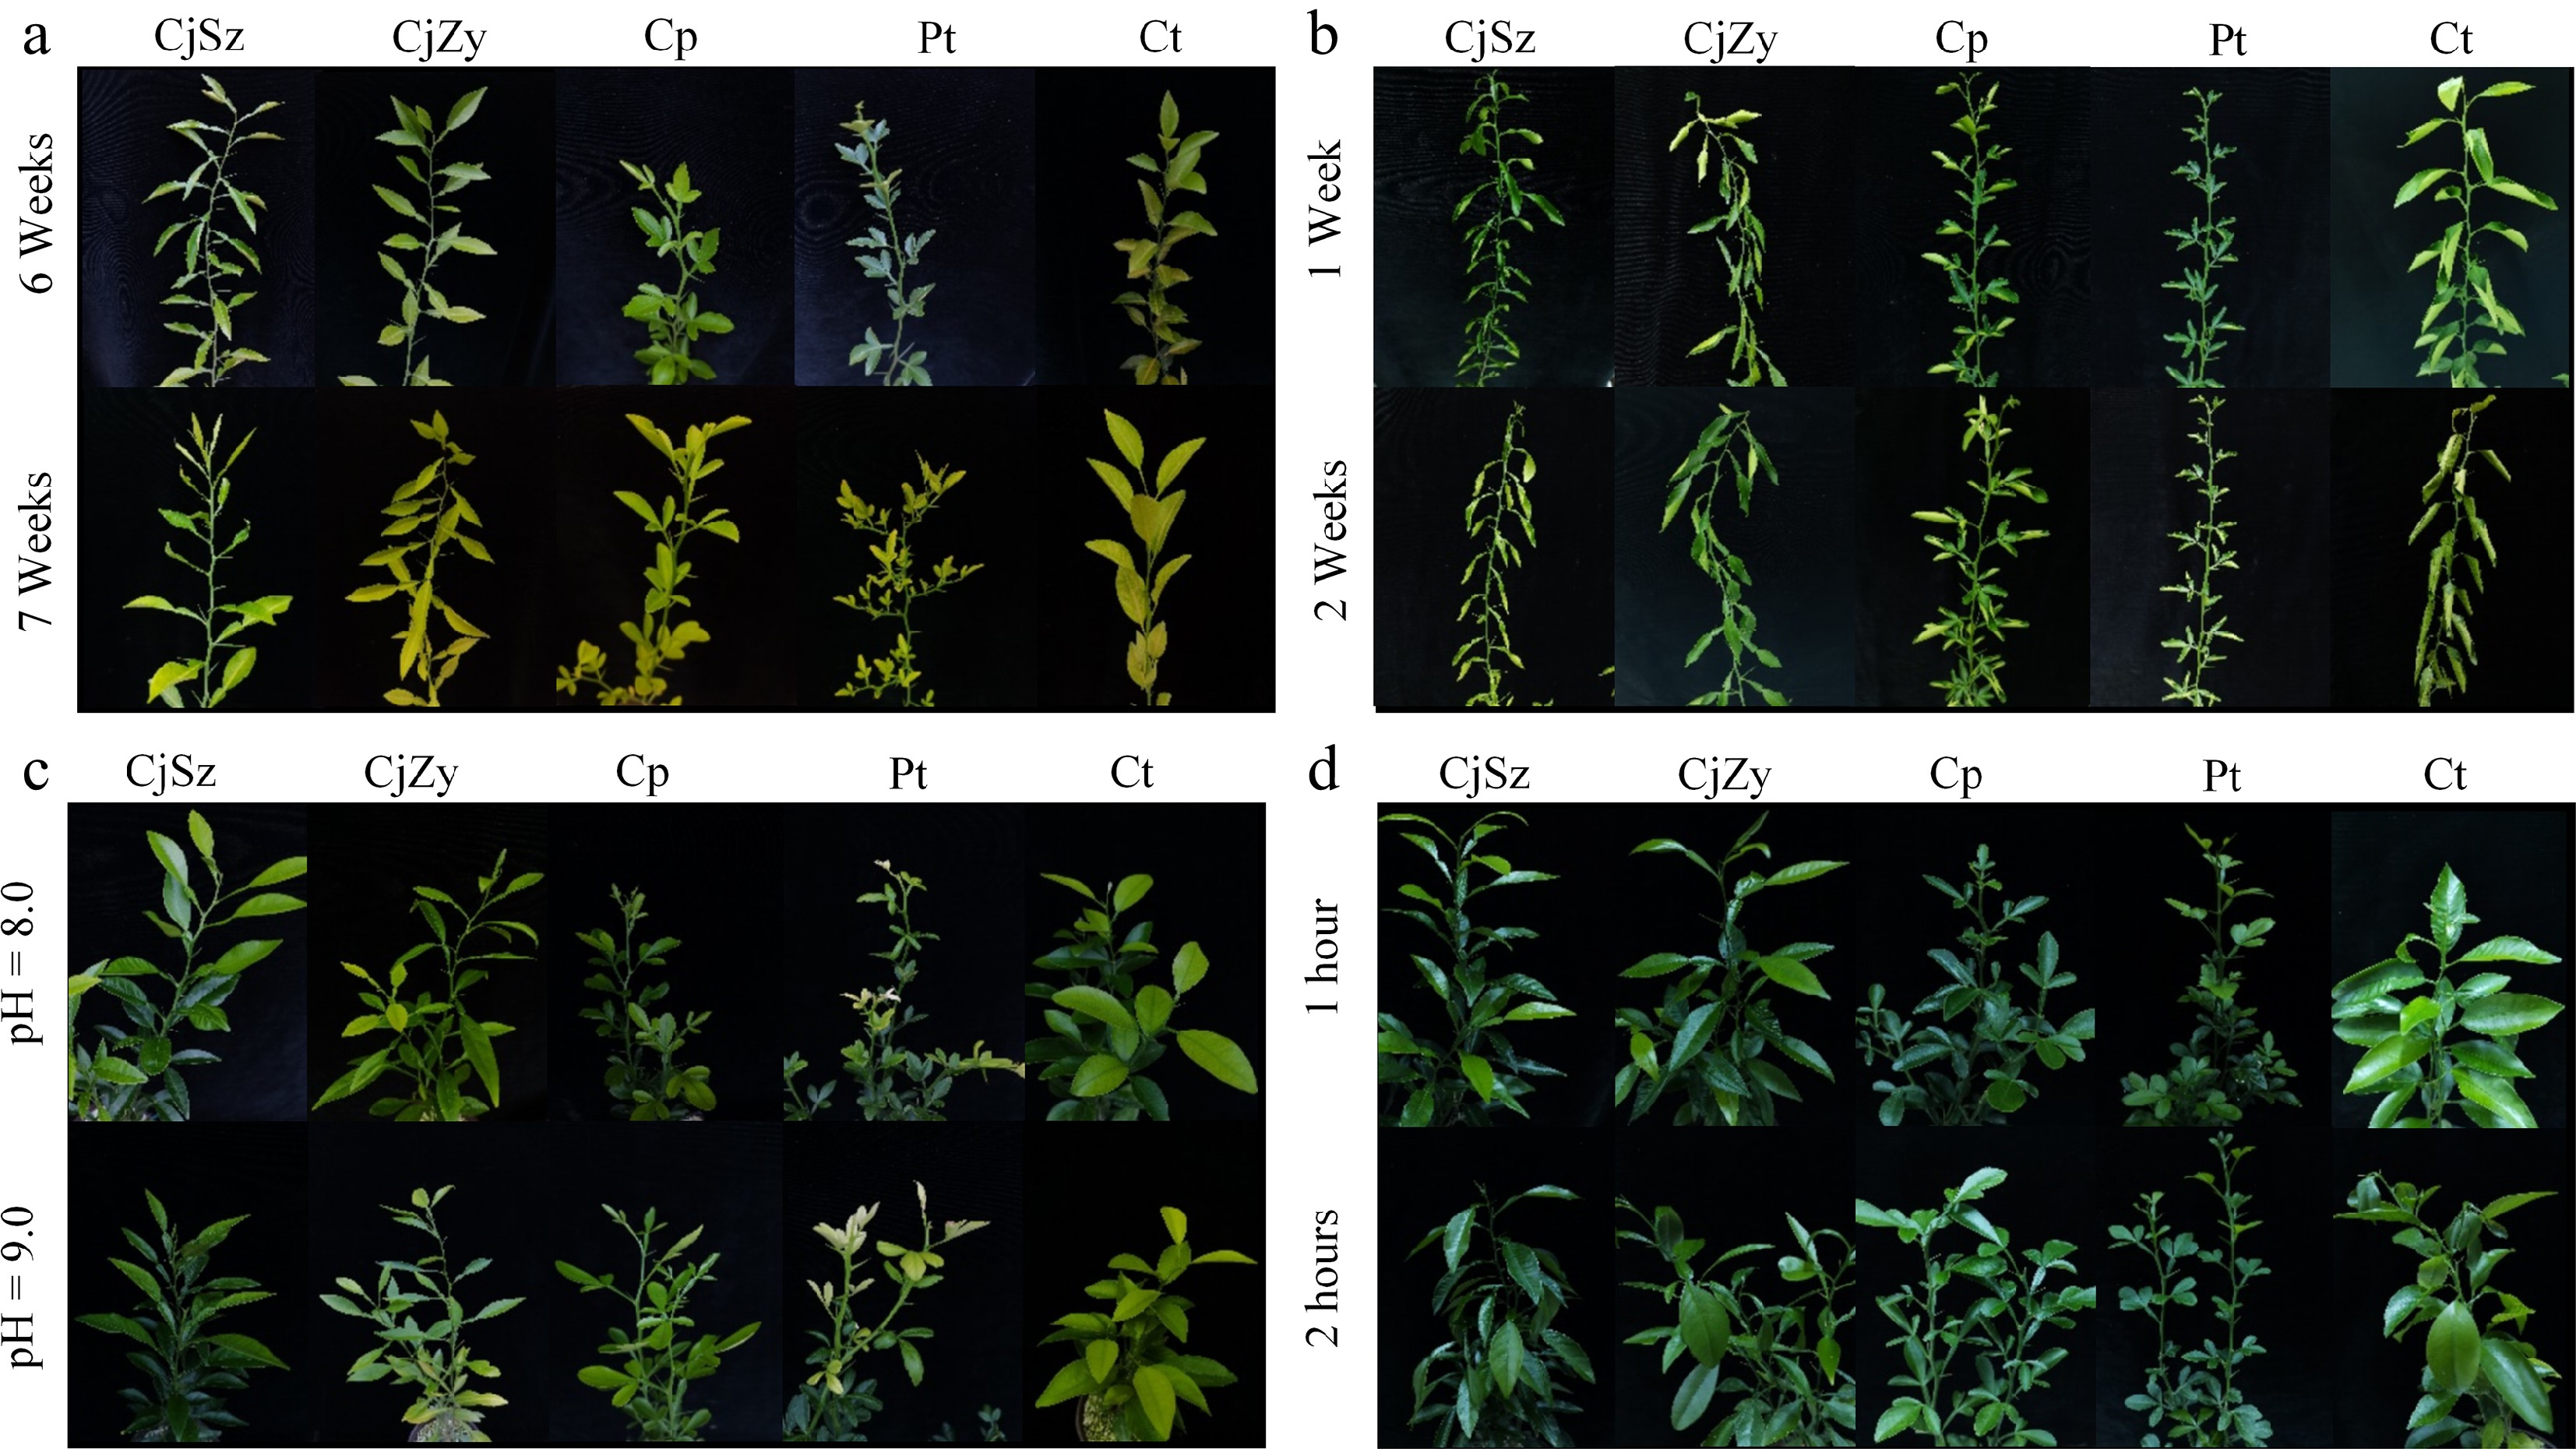
Figure 2.
Growth state of five rootstocks under abiotic stresses. (a) Flooding stress; (b) drought stress; (c) alkaline stress (pH = 8.0 and pH = 9.0); (d) freezing stress.
-
Species Flooding stress Drought stress Alkaline stress Freezing stress 6 weeks 7 weeks 1 week 2 weeks pH = 8.0 pH = 9.0 1 h 2 h Chl a CjSz 0.72 ± 0.12a 0.60 ± 0.04a 0.53 ± 0.08a 0.48 ± 0.15a 0.86 ± 0.26a 0.74 ± 0.35ab 0.96 ± 0.24a 0.83 ± 0.11a CjZy 0.67 ± 0.22a 0.68 ± 0.09a 0.59 ± 0.16a 0.45 ± 0.22a 0.79 ± 0.14a 0.69 ± 0.19ab 0.85 ± 0.17a 0.79 ± 0.19a Cp 0.77 ± 0.26a 0.69 ± 0.26a 0.66 ± 0.28a 0.61 ± 0.16a 0.83 ± 0.26a 0.77 ± 0.20a 0.88 ± 0.12a 0.85 ± 0.18a Pt 0.63 ± 0.06ab 0.63 ± 0.19a 0.63 ± 0.03a 0.60 ± 0.08a 0.72 ± 0.03ab 0.68 ± 0.07ab 0.91 ± 0.20a 0.88 ± 0.05a Ct 0.44 ± 0.10b 0.38 ± 0.09b 0.28 ± 0.05b 0.23 ± 0.07b 0.48 ± 0.04b 0.47 ± 0.07b 0.92 ± 0.06a 0.69 ± 0.15a Chl b CjSz 0.78 ± 0.12a 0.70 ± 0.08a 0.67 ± 0.14a 0.64 ± 0.15a 0.87 ± 0.26a 0.77 ± 0.31a 1.05 ± 0.22a 1.00 ± 0.12a CjZy 0.70 ± 0.20a 0.65 ± 0.09a 0.72 ± 0.09a 0.52 ± 0.20a 0.76 ± 0.11a 0.74 ± 0.13a 0.86 ± 0.11ab 0.92 ± 0.17ab Cp 0.76 ± 0.24a 0.68 ± 0.25a 0.71 ± 0.25a 0.68 ± 0.15a 0.85 ± 0.18a 0.78 ± 0.16a 0.82 ± 0.09b 0.83 ± 0.11b Pt 0.71 ± 0.13a 0.66 ± 0.20a 0.66 ± 0.05a 0.68 ± 0.11a 0.69 ± 0.09ab 0.66 ± 0.08ab 0.86 ± 0.19ab 0.87 ± 0.11ab Ct 0.47 ± 0.09b 0.50 ± 0.12a 0.39 ± 0.04b 0.33 ± 0.06b 0.51 ± 0.04b 0.47 ± 0.05b 1.00 ± 0.10ab 0.64 ± 0.12c Total CjSz 0.74 ± 0.12a 0.63 ± 0.05ab 0.57 ± 0.10a 0.53 ± 0.15a 0.86 ± 0.26a 0.75 ± 0.33a 0.99 ± 0.23a 0.89 ± 0.12a Chl CjZy 0.68 ± 0.21a 0.67 ± 0.09a 0.63 ± 0.14a 0.47 ± 0.21a 0.78 ± 0.13a 0.71 ± 0.17ab 0.85 ± 0.15a 0.84 ± 0.19ab Cp 0.76 ± 0.25a 0.68 ± 0.26a 0.67 ± 0.27a 0.63 ± 0.16a 0.84 ± 0.23a 0.77 ± 0.19a 0.86 ± 0.11a 0.84 ± 0.15ab Pt 0.65 ± 0.08ab 0.64 ± 0.19a 0.63 ± 0.03a 0.63 ± 0.09a 0.71 ± 0.05ab 0.67 ± 0.07ab 0.89 ± 0.19a 0.87 ± 0.07a Ct 0.45 ± 0.10b 0.42 ± 0.10b 0.32 ± 0.04b 0.27 ± 0.07b 0.49 ± 0.03b 0.47 ± 0.06b 0.95 ± 0.08a 0.67 ± 0.14b Total CjSz 0.83 ± 0.12a 0.65 ± 0.10a 0.68 ± 0.11a 0.55 ± 0.18ab 0.96 ± 0.30a 0.71 ± 0.27a 0.96 ± 0.20a 0.95 ± 0.13a Car CjZy 0.62 ± 0.15bc 0.65 ± 0.08a 0.56 ± 0.14a 0.51 ± 0.25ab 0.68 ± 0.11bc 0.69 ± 0.12ab 0.77 ± 0.14a 0.76 ± 0.12bc Cp 0.76 ± 0.24ab 0.67 ± 0.23a 0.63 ± 0.19a 0.69 ± 0.13a 0.79 ± 0.15ab 0.75 ± 0.17a 0.92 ± 0.06a 0.86 ± 0.14ab Pt 0.69 ± 0.08ab 0.62 ± 0.16ab 0.64 ± 0.04a 0.65 ± 0.09a 0.73 ± 0.04b 0.63 ± 0.05ab 0.91 ± 0.23a 0.95 ± 0.05a Ct 0.45 ± 0.12c 0.43 ± 0.13b 0.38 ± 0.05b 0.37 ± 0.10b 0.47 ± 0.03c 0.49 ± 0.05b 0.89 ± 0.14a 0.67 ± 0.14c Note: Chl: chlorophyll, Car: carotenoids. Data shown in the table are expressed as ratios relative to the values obtained on control seedlings. Three biological replicates (five seedlings per replicate) were set randomly for each treatment. Significance was tested for indicators of different rootstocks in the same treatment, and different lowercase letters indicate significant differences at p < 0.05. Table 1.
Statistics for chlorophyll a, chlorophyll b, total chlorophyll and total carotenoid compared with controls.
-
Species Flooding stress Drought stress Alkaline stress Freezing stress 6 weeks 7 weeks 1 week 2 weeks pH = 8.0 pH = 9.0 1 h 2 h MDA CjSz 1.42 ± 0.30bc 2.02 ± 0.16ab 1.07 ± 0.11d 1.90 ± 0.26b 1.11 ± 0.11b 1.50 ± 0.13c 1.02 ± 0.22b 1.24 ± 0.39b CjZy 1.45 ± 0.17bc 1.81 ± 0.30b 1.79 ± 0.22b 2.10 ± 0.14a 1.47 ± 0.30ab 1.75 ± 0.28bc 1.02 ± 0.13b 1.15 ± 0.27b Cp 1.67 ± 0.20ab 1.84 ± 0.41b 1.31 ± 0.23cd 2.25 ± 0.61a 1.33 ± 0.39ab 1.36 ± 0.20c 1.49 ± 0.29a 1.92 ± 0.63a Pt 1.26 ± 0.16c 1.48 ± 0.34b 1.45 ± 0.31bc 2.03 ± 0.43a 1.84 ± 0.40a 2.41 ± 0.42a 0.91 ± 0.34b 1.01 ± 0.54b Ct 1.75 ± 0.25a 2.42 ± 0.66a 2.30 ± 0.36a 2.29 ± 0.37a 1.36 ± 0.10ab 1.92 ± 0.36b 1.00 ± 0.17b 1.46 ± 0.26ab SOD CjSz 1.60 ± 0.26a 1.71 ± 0.03a 1.53 ± 0.02ab 1.63 ± 0.11a 1.25 ± 0.08a 1.31 ± 0.15ab 1.31 ± 0.06ab 1.35 ± 0.16a CjZy 1.65 ± 0.10a 1.70 ± 0.07a 1.62 ± 0.07a 1.71 ± 0.06a 1.31 ± 0.29a 1.36 ± 0.29a 1.12 ± 0.27b 1.54 ± 0.21a Cp 1.25 ± 0.18c 1.19 ± 0.18b 1.18 ± 0.16c 1.15 ± 0.15b 1.12 ± 0.05ab 1.26 ± 0.02ab 1.25 ± 0.17ab 1.05 ± 0.23b Pt 1.56 ± 0.10ab 1.50 ± 0.46ab 1.69 ± 0.16a 1.51 ± 0.28a 0.94 ± 0.30b 0.94 ± 0.39c 1.39 ± 0.19a 1.56 ± 0.11a Ct 1.36 ± 0.10bc 1.61 ± 0.18a 1.35 ± 0.17bc 1.23 ± 0.18b 1.08 ± 0.07ab 1.04 ± 0.09bc 1.18 ± 0.24ab 1.07 ± 0.08b POD CjSz 1.40 ± 0.31a 1.50 ± 0.10ab 1.25 ± 0.38c 1.45 ± 0.61b 1.37 ± 0.49a 1.46 ± 0.22a 1.62 ± 0.32ab 1.62 ± 0.37a CjZy 1.61 ± 0.33a 1.62 ± 0.38ab 2.23 ± 0.68ab 2.69 ± 0.72a 1.29 ± 0.24a 1.38 ± 0.54a 1.25 ± 0.66b 1.55 ± 0.59a Cp 1.45 ± 0.16a 2.16 ± 0.86a 2.59 ± 1.09a 2.90 ± 0.70a 1.27 ± 0.28a 1.31 ± 0.32a 1.28 ± 0.44b 1.46 ± 0.49a Pt 0.85 ± 0.17b 1.25 ± 0.21b 1.40 ± 0.41bc 1.57 ± 0.50b 0.83 ± 0.22b 1.17 ± 0.32a 1.85 ± 0.28a 1.83 ± 0.23a Ct 1.00 ± 0.26b 1.99 ± 0.65a 2.64 ± 0.67a 2.25 ± 1.20ab 0.80 ± 0.24b 1.06 ± 0.32a 1.21 ± 0.21b 1.25 ± 0.48a CAT CjSz 0.98 ± 0.20ab 0.77 ± 0.10a 1.14 ± 0.14ab 1.00 ± 0.10ab 0.91 ± 0.30a 0.67 ± 0.09c 0.87 ± 0.14a 0.67 ± 0.10c CjZy 0.74 ± 0.03b 0.91 ± 0.09a 1.52 ± 0.28a 0.93 ± 0.08b 0.57 ± 0.17a 1.08 ± 0.17b 0.71 ± 0.09ab 1.56 ± 0.24a Cp 0.90 ± 0.06ab 0.79 ± 0.18a 0.91 ± 0.04b 1.08 ± 0.14ab 0.70 ± 0.14a 1.59 ± 0.10a 0.90 ± 0.08a 0.61 ± 0.03c Pt 1.08 ± 0.11a 0.72 ± 0.02a 0.47 ± 0.06c 1.28 ± 0.08a 1.04 ± 0.14a 0.84 ± 0.15bc 0.53 ± 0.14b 0.85 ± 0.10bc Ct 0.77 ± 0.10 ab 0.66 ± 0.12 a 1.33 ± 0.44 a 1.15 ± 0.15 ab 0.79 ± 0.11 a 0.88 ± 0.11 bc 0.70 ± 0.13 ab 1.09 ± 0.19 b Note: Data showed in the table are expressed as ratios relative to the values obtained on control seedling. Different lowercase letters indicate significant differences at p < 0.05. Table 2.
Mean comparison of malondialdehyde (MDA), superoxide dismutase (SOD), catalase (CAT) and peroxidase (POD).
-
Species Flooding stress Drought stress Alkaline stress Freezing stress 6 weeks 7 weeks 1 week 2 weeks pH = 8.0 pH = 9.0 1 h 2 h Soluble proteins CjSz 1.11 ± 0.17bc 1.10 ± 0.26d 1.35 ± 0.36a 1.52 ± 0.08ab 1.86 ± 0.18a 2.04 ± 0.17a 2.15 ± 0.18a 2.16 ± 0.17a CjZy 1.01 ± 0.17c 1.46 ± 0.28bc 1.19 ± 0.19a 1.17 ± 0.28b 1.81 ± 0.06a 1.82 ± 0.31a 1.58 ± 0.09c 1.77 ± 0.32b Cp 1.59 ± 0.19a 1.88 ± 0.19a 1.29 ± 0.32a 1.67 ± 0.28a 1.62 ± 0.10b 1.83 ± 0.18a 1.74 ± 0.17bc 1.77 ± 0.17b Pt 1.09 ± 0.07bc 1.24 ± 0.17cd 1.13 ± 0.19a 1.11 ± 0.17b 1.13 ± 0.13c 1.19 ± 0.26b 1.84 ± 0.09b 1.93 ± 0.10ab Ct 1.26 ± 0.02b 1.54 ± 0.12b 1.21 ± 0.55a 1.35 ± 0.51ab 1.23 ± 0.15c 1.30 ± 0.15b 1.28 ± 0.23d 1.36 ± 0.17c Soluble sugars CjSz 2.78 ± 0.48a 3.24 ± 0.40a 2.50 ± 0.62a 1.87 ± 0.71bc 1.77 ± 0.23ab 2.08 ± 0.51b 1.37 ± 0.20a 1.25 ± 0.21b CjZy 1.52 ± 0.45c 1.79 ± 0.10b 1.36 ± 0.37b 1.62 ± 0.13bc 1.42 ± 0.37bc 2.32 ± 0.44ab 1.29 ± 0.13a 1.53 ± 0.23ab Cp 2.80 ± 0.15a 2.83 ± 0.53a 1.96 ± 0.30ab 2.76 ± 0.92a 2.22 ± 0.63a 2.77 ± 0.37a 1.14 ± 0.41a 1.74 ± 0.22a Pt 2.12 ± 0.49b 2.13 ± 0.33b 1.86 ± 0.13ab 1.26 ± 0.43c 0.98 ± 0.16c 1.15 ± 0.16c 1.23 ± 0.28a 1.41 ± 0.32ab Ct 3.06 ± 0.26a 3.16 ± 0.64a 2.44 ± 0.93a 2.25 ± 0.17ab 1.01 ± 0.24c 1.18 ± 0.25c 1.17 ± 0.33a 1.63 ± 0.31a Note: Data shown in the table were expressed as ratios relative to the values obtained on control seedling. Different lowercase letters indicate significant differences at p < 0.05. Table 3.
Mean comparison of soluble proteins and soluble sugars.
-
Treatment Variety Comprehensive evaluation Membership function Comprehensive evaluation value Order F1 F2 F3 U1 U2 U3 Flooding 6 weeks CjSz 2.778 −0.145 0.154 1.000 0.397 0.677 0.710 1 CjZy −0.703 −1.678 0.998 0.130 0.000 1.000 0.229 4 Cp −1.222 0.620 0.569 0.000 0.596 0.836 0.375 3 Pt −0.270 2.180 −0.108 0.238 1.000 0.577 0.592 2 Ct −0.582 −0.978 −1.614 0.160 0.181 0.000 0.141 5 Weights 0.440 0.388 0.172 Flooding 7 weeks CjSz 2.261 1.481 0.119 1.000 1.000 0.621 0.966 1 CjZy 0.985 −1.106 0.866 0.715 0.000 1.000 0.565 2 Cp −1.878 −0.464 0.269 0.075 0.248 0.698 0.174 5 Pt −2.215 1.047 −0.146 0.000 0.832 0.487 0.249 4 Ct 0.847 −0.957 −1.108 0.684 0.058 0.000 0.468 3 Weights 0.663 0.246 0.091 Drought 1 week CjSz −0.468 1.581 0.303 0.239 1.000 0.504 0.516 2 CjZy −1.545 0.762 −0.946 0.000 0.755 0.000 0.228 4 Cp 0.003 −1.758 −0.943 0.343 0.000 0.001 0.178 5 Pt 2.964 0.349 0.050 1.000 0.631 0.401 0.781 1 Ct −0.954 −0.934 1.535 0.131 0.247 1.000 0.321 3 Weights 0.519 0.302 0.179 Drought 2 weeks CjSz −0.005 1.386 1.251 0.386 1.000 1.000 0.672 2 CjZy −1.787 0.898 −1.024 0.000 0.864 0.000 0.287 4 Cp 0.005 0.146 −0.150 0.388 0.654 0.384 0.476 3 Pt 2.826 −0.236 −0.492 1.000 0.547 0.234 0.747 1 Ct −1.039 −2.194 0.415 0.162 0.000 0.632 0.171 5 Weights 0.535 0.332 0.133 Alkaline pH = 8.0 CjSz 0.492 1.831 0.873 0.674 1.000 1.000 0.810 1 CjZy 2.056 0.273 −0.941 1.000 0.551 0.000 0.761 2 Cp 1.059 −1.087 0.226 0.792 0.160 0.643 0.574 3 Pt −2.749 0.626 −0.598 0.000 0.653 0.189 0.229 5 Ct −0.859 −1.643 0.440 0.393 0.000 0.761 0.301 4 Weights 0.582 0.323 0.094 Alkaline pH = 9.0 CjSz 0.178 1.765 −0.992 0.681 1.000 0.000 0.699 2 CjZy 1.244 0.969 0.689 0.941 0.770 0.990 0.885 1 Cp 1.484 −1.154 0.590 1.000 0.156 0.932 0.676 3 Pt −2.614 0.115 0.706 0.000 0.523 1.000 0.342 4 Ct −0.292 −1.695 −0.993 0.567 0.000 0.000 0.272 5 Weights 0.481 0.372 0.148 Freezing 1 h CjSz −0.127 0.600 1.842 0.330 0.644 1.000 0.568 2 CjZy −1.364 −1.396 −0.133 0.021 0.000 0.284 0.068 5 Cp 2.549 0.457 −0.447 1.000 0.598 0.170 0.701 1 Pt −1.447 1.702 −0.916 0.000 1.000 0.000 0.324 3 Ct 0.389 −1.364 −0.346 0.459 0.010 0.207 0.263 4 Weights 0.473 0.324 0.203 Freezing 2 h CjSz 1.279 0.579 −0.031 0.907 0.650 0.416 0.749 1 CjZy −1.946 1.708 0.603 0.000 1.000 0.714 0.443 4 Cp 0.900 −1.426 1.209 0.800 0.029 1.000 0.567 3 Pt 1.609 0.661 −0.915 1.000 0.676 0.000 0.746 2 Ct −1.843 −1.521 −0.866 0.029 0.000 0.023 0.018 5 Weights 0.516 0.340 0.144 Table 4.
Comprehensive evaluation of five genotypes citrus rootstocks under different stresses.
-
Graft combination Survival rate (%) Diameter of scion (mm) Diameter of rootstock (mm) Ration of scion to rootstock Rootstock Scion CjSz Chunjian 95.67 18.81 ± 0.35ab 26.52 ± 2.75b 0.70 ± 0.03ab Buzhihuo 100.00 18.31 ± 2.34ab 23.96 ± 2.49c 0.77 ± 0.02a Mingrijian 91.33 17.87 ± 1.95b 28.62 ± 2.88a 0.63 ± 0.06c Dafen 90.67 20.13 ± 2.52a 28.40 ± 3.42ab 0.70 ± 0.06ab Tarocco 95.50 20.10 ± 1.68a 30.12 ± 2.74a 0.67 ± 0.01bc CjZy Chunjian 86.33 11.92 ± 0.94b 16.00 ± 0.46b 0.75 ± 0.05ab Buzhihuo 95.50 12.59 ± 1.87b 16.05 ± 1.39b 0.78 ± 0.06ab Mingrijian 81.67 11.26 ± 1.28b 16.01 ± 1.52b 0.71 ± 0.01b Dafen 95.50 14.78 ± 1.99a 20.48 ± 2.29a 0.74 ± 0.12ab Tarocco 90.67 14.82 ± 2.01a 17.66 ± 2.85ab 0.82 ± 0.05a Ct Chunjian 91.33 15.94 ± 1.64ab 21.17 ± 1.71a 0.75 ± 0.03ab Buzhihuo 95.67 14.77 ± 2.50b 18.83 ± 2.51ac 0.80 ± 0.12ab Mingrijian 90.67 15.02 ± 2.48b 20.91 ± 2.27ab 0.72 ± 0.05b Dafen 100.00 16.44 ± 0.81ab 21.60 ± 3.82a 0.81 ± 0.09a Tarocco 87.33 17.37 ± 1.07a 21.28 ± 1.65a 0.82 ± 0.03a Pt Chunjian 70.67 8.19 ± 0.49bc 14.10 ± 2.02abc 0.58 ± 0.05ab Buzhihuo 95.67 6.66 ± 0.66c 11.80 ± 0.44c 0.57 ± 0.07ab Mingrijian 79.33 6.65 ± 0.76c 12.81 ± 1.13bc 0.52 ± 0.06b Dafen 91.67 10.94 ± 0.97a 17.01 ± 1.67a 0.65 ± 0.07a Tarocco 91.33 10.36 ± 1.84ab 16.55 ± 0.68ab 0.62 ± 0.18a Table 5.
Survival rate and graft union situation of different graft combinations.
-
Graft combination Scion length (cm) Crown breadth Leaf greenness
(SPAD)Rootstock Scion Longitudinal (cm) Horizontal (cm) CjSz Chunjian 97.54 ± 9.53b 87.83 ± 14.42a 89.18 ± 16.32b 82.98 ± 0.74abc Buzhihuo 79.11 ± 10.63d 73.67 ± 5.78b 78.00 ± 17.04c 85.79 ±1.85a Mingrijian 115.78 ± 8.88a 91.33 ± 13.53a 110.38 ± 19.01a 84.97 ± 0.47a Dafen 88.11 ± 5.98c 97.33 ± 20.63a 98.00 ± 18.89ab 81.34 ± 0.14c Tarocco 81.11 ± 12.07cd 61.56 ± 11.59c 65.56 ± 9.19d 84.36 ± 1.55ab CjZy Chunjian 69.67 ± 11.15ab 66.99 ± 4.20a 66.88 ± 15.99a 82.16 ± 2.12b Buzhihuo 55.89 ± 9.71c 52.33 ± 3.71b 61.11 ± 3.20ab 82.93 ± 0.57b Mingrijian 69.67 ± 5.93ab 58.33 ± 14.25ab 71.00 ± 13.91a 79.54 ± 3.83c Dafen 73.56 ± 6.00a 72.17 ± 16.54a 71.33 ± 18.34a 84.93 ± 3.30ab Tarocco 57.56 ± 10.84bc 64.22 ± 11.52a 52.67 ± 20.54b 86.46 ± 0.80a Ct Chunjian 96.11 ± 10.24a 77.44 ± 12.30a 83.33 ± 14.88ab 81.37 ± 1.92ab Buzhihuo 82.44 ± 15.61b 62.56 ± 8.55bc 69.22 ± 14.34b 81.36 ± 1.68abc Mingrijian 97.89 ± 9.34a 76.89 ± 5.43ab 77.67 ± 31.56ab 78.81 ± 1.97bcd Dafen 87.33 ± 5.46ab 89.22 ± 1.26a 92.67 ± 20.85a 83.47 ± 1.70a Tarocco 73.22 ± 13.77c 55.22 ± 12.85c 53.33 ± 16.68c 83.43 ± 1.28a Pt Chunjian 41.18 ± 7.44ab 38.09 ± 12.96ab 42.13 ± 14.27a 75.63 ± 2.67b Buzhihuo 25.56 ± 3.17c 18.89 ± 1.92c 15.56 ± 1.50bc 75.70 ± 2.04b Mingrijian 32.11 ± 7.93bc 20.78 ± 5.23bc 15.11 ± 2.12c 71.43 ± 4.99c Dafen 51.44 ± 4.17a 50.56 ± 10.40a 48.00 ± 6.66a 80.92 ± 4.33a Tarocco 42.13 ± 16.27ab 27.89 ± 10.00bc 33.89 ± 15.79ab 81.71 ± 0.70a Table 6.
The growth situation of different graft combinations.
Figures
(2)
Tables
(6)