-
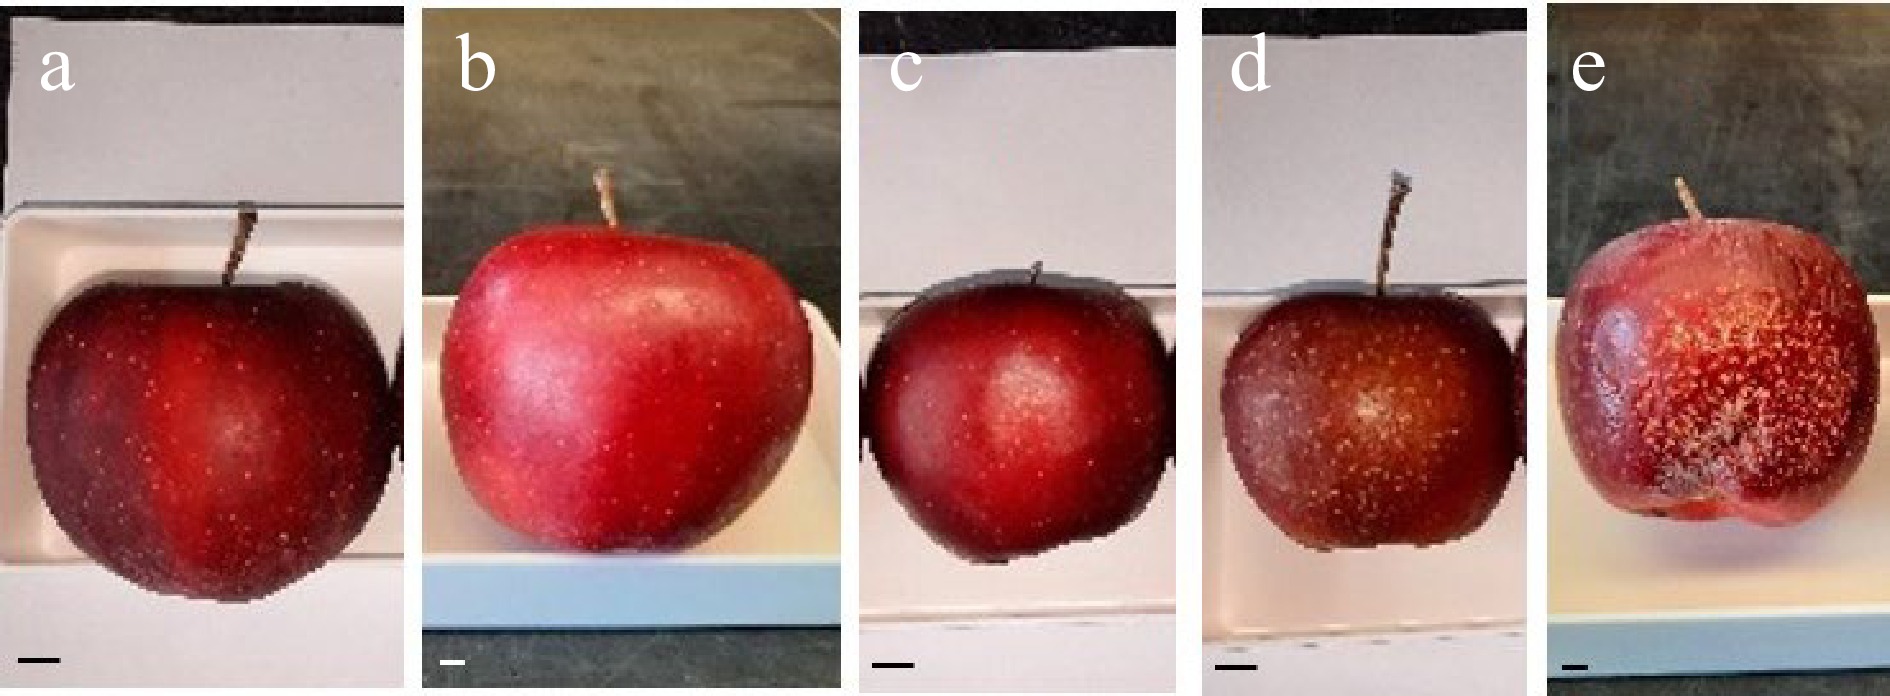
Figure 1.
'Buckeye Gala' apples with normal appearance and different sunburn browning (SB) severities. (a) Normal, (b) Subtle SB, (c) Mild SB, (d) Moderate SB, and (e) Severe SB. The photos were taken after 7 months of 4 °C storage. Scale bar in each subpanel is 10 mm.
-
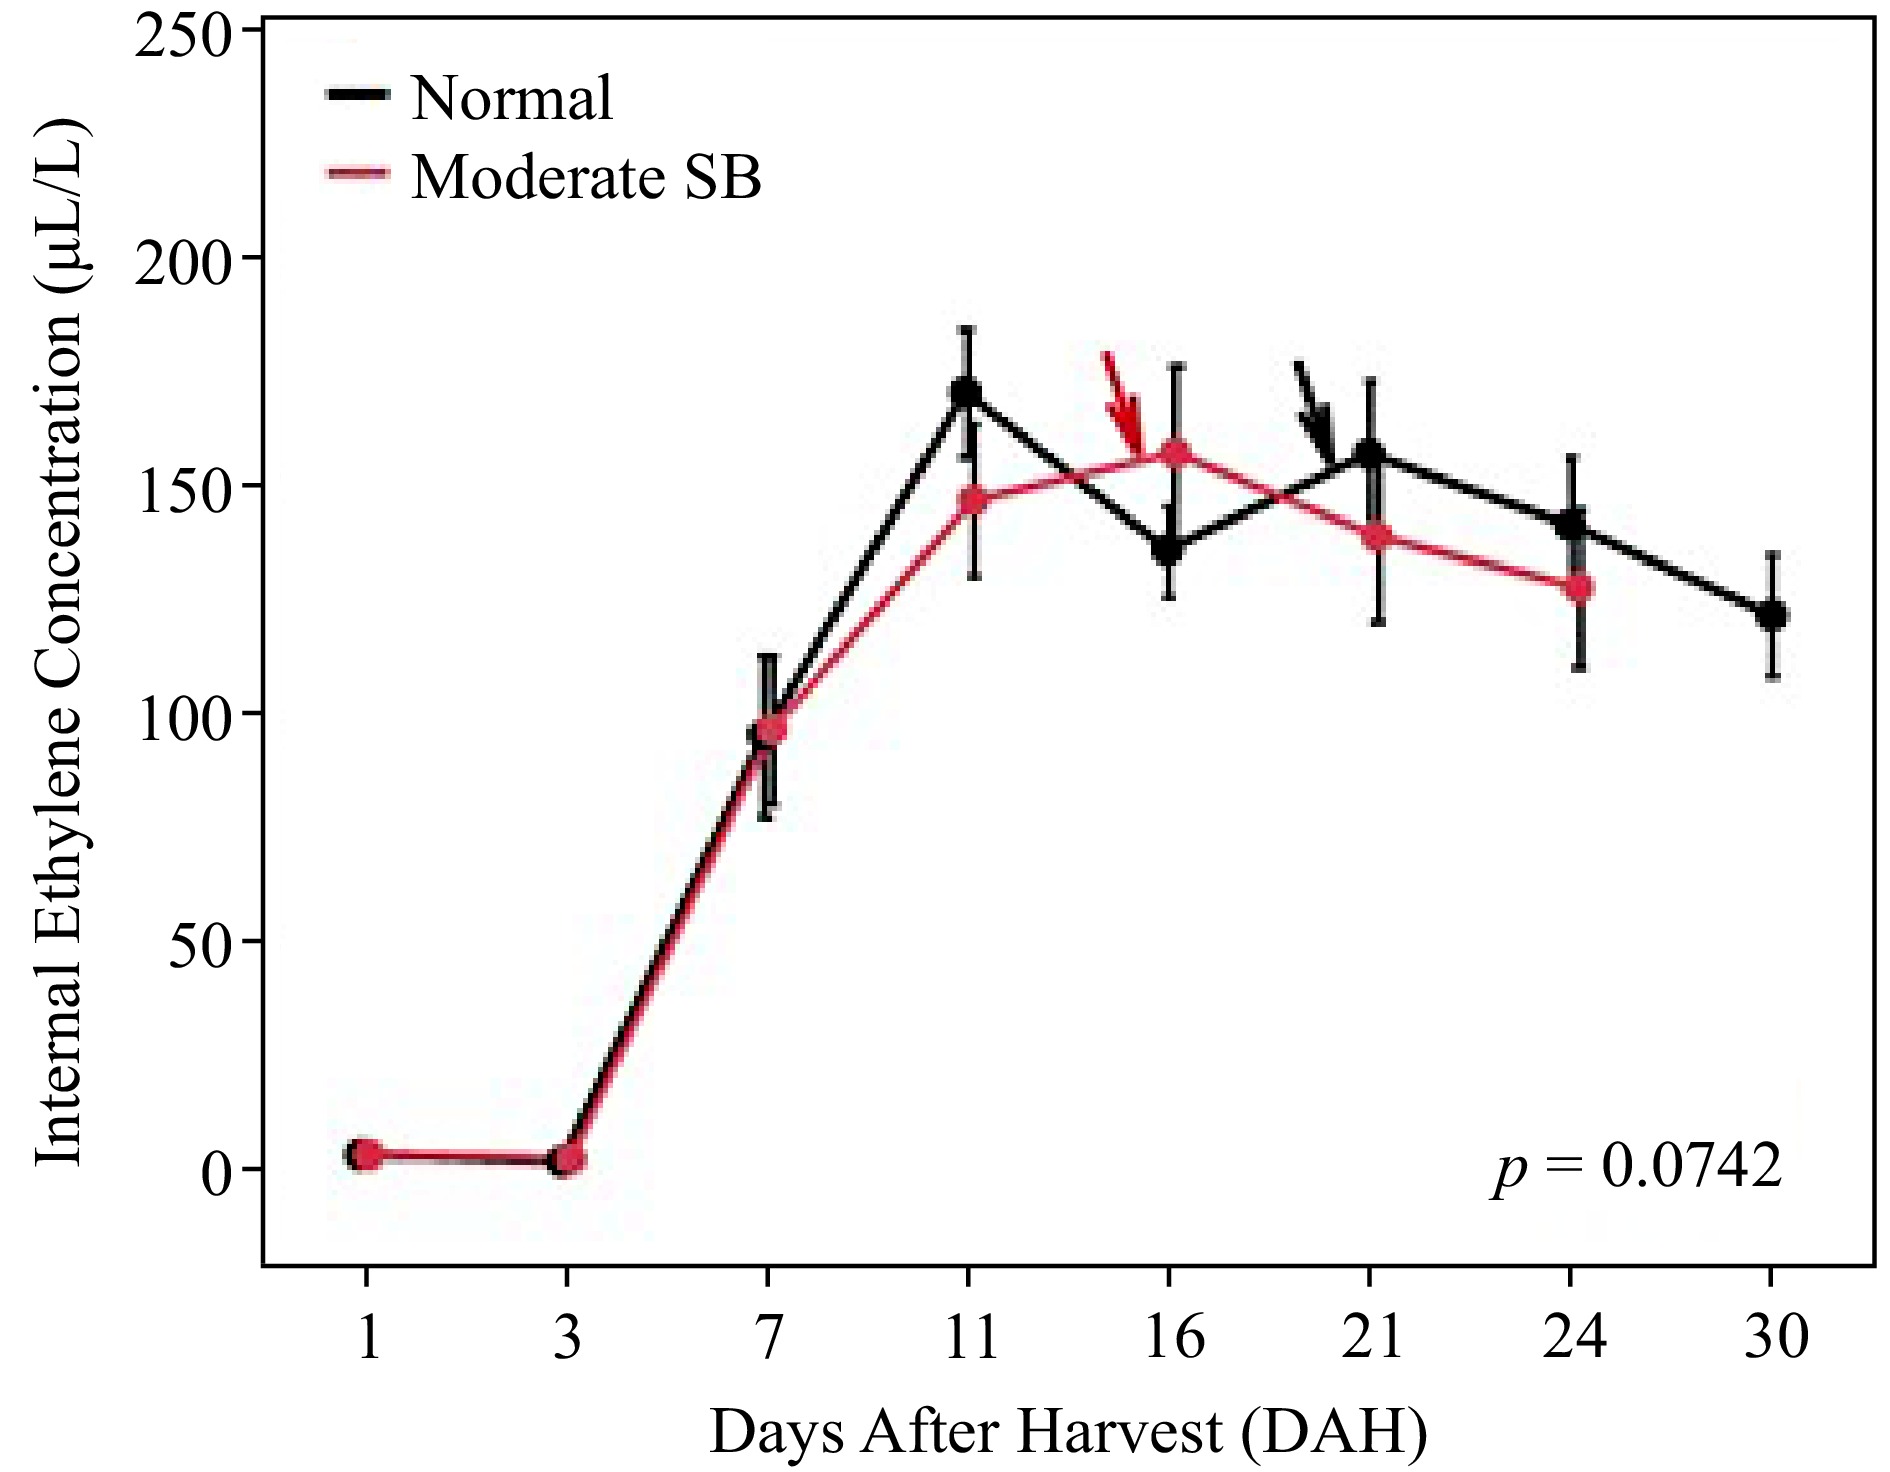
Figure 2.
Ethylene emission of 'Buckeye Gala' apples during air storage at 20 °C. Dots and error bars are mean ± standard error at each sampling point (n = 15). Lines indicate the changes over time. Arrows point out the dates when fruits started shriveling.
-
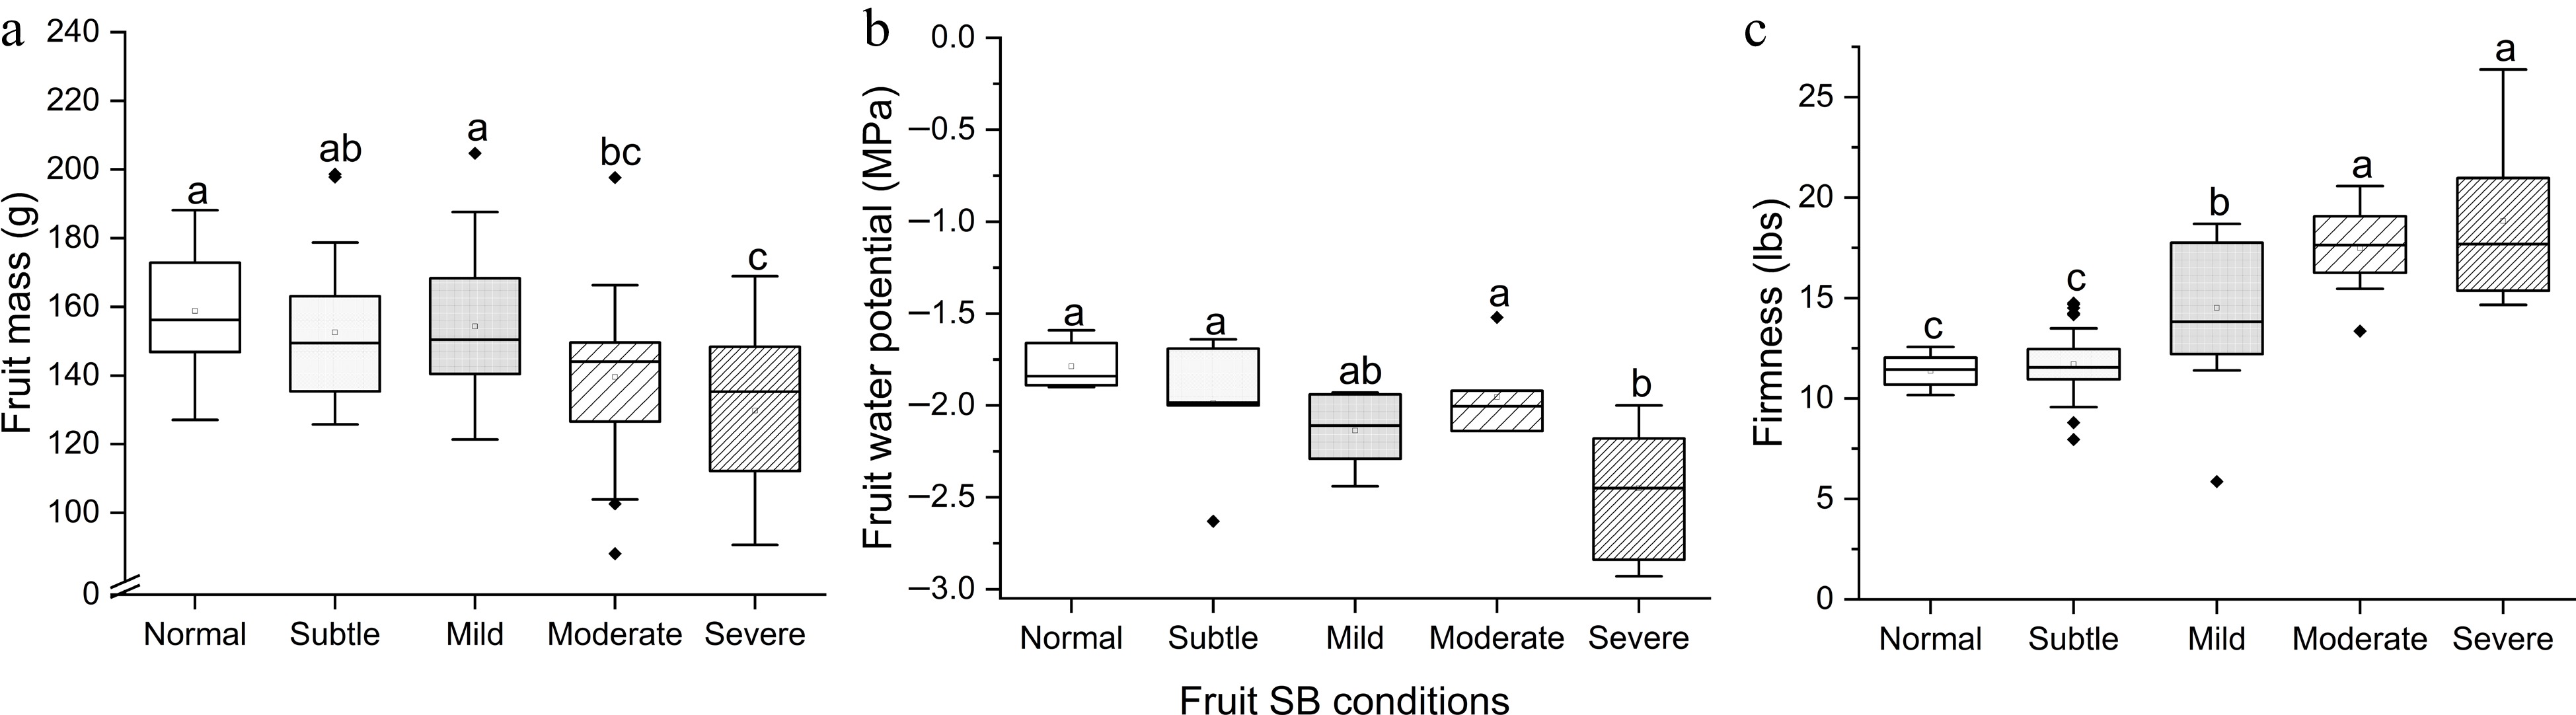
Figure 3.
(a) Fruit mass, (b) flesh water potential Ψ and (c) firmness of 'Buckeye Gala' apples with different severities of sunburn browning (SB) after 7-month air storage at 4 °C. Different letters in each subpanel represent significant difference of SB severity effect (one-way ANOVA, Tukey's test, p ≤ 0.05).
-

Figure 4.
(a) Fruit skin δA bsorbance on the sunlit and shaded sides and (b) differential δA bsorbance between the two sides of 'Buckeye Gala' apples with different severities of sunburn browning (SB) after 7-month air storage at 4 °C. Different letters in each subpanel represent significant difference: (a), fruit side × SB severity interaction effect, two-way ANOVA; (b), SB severity effect, one-way ANOVA; Tukey's test, p ≤ 0.05.
-
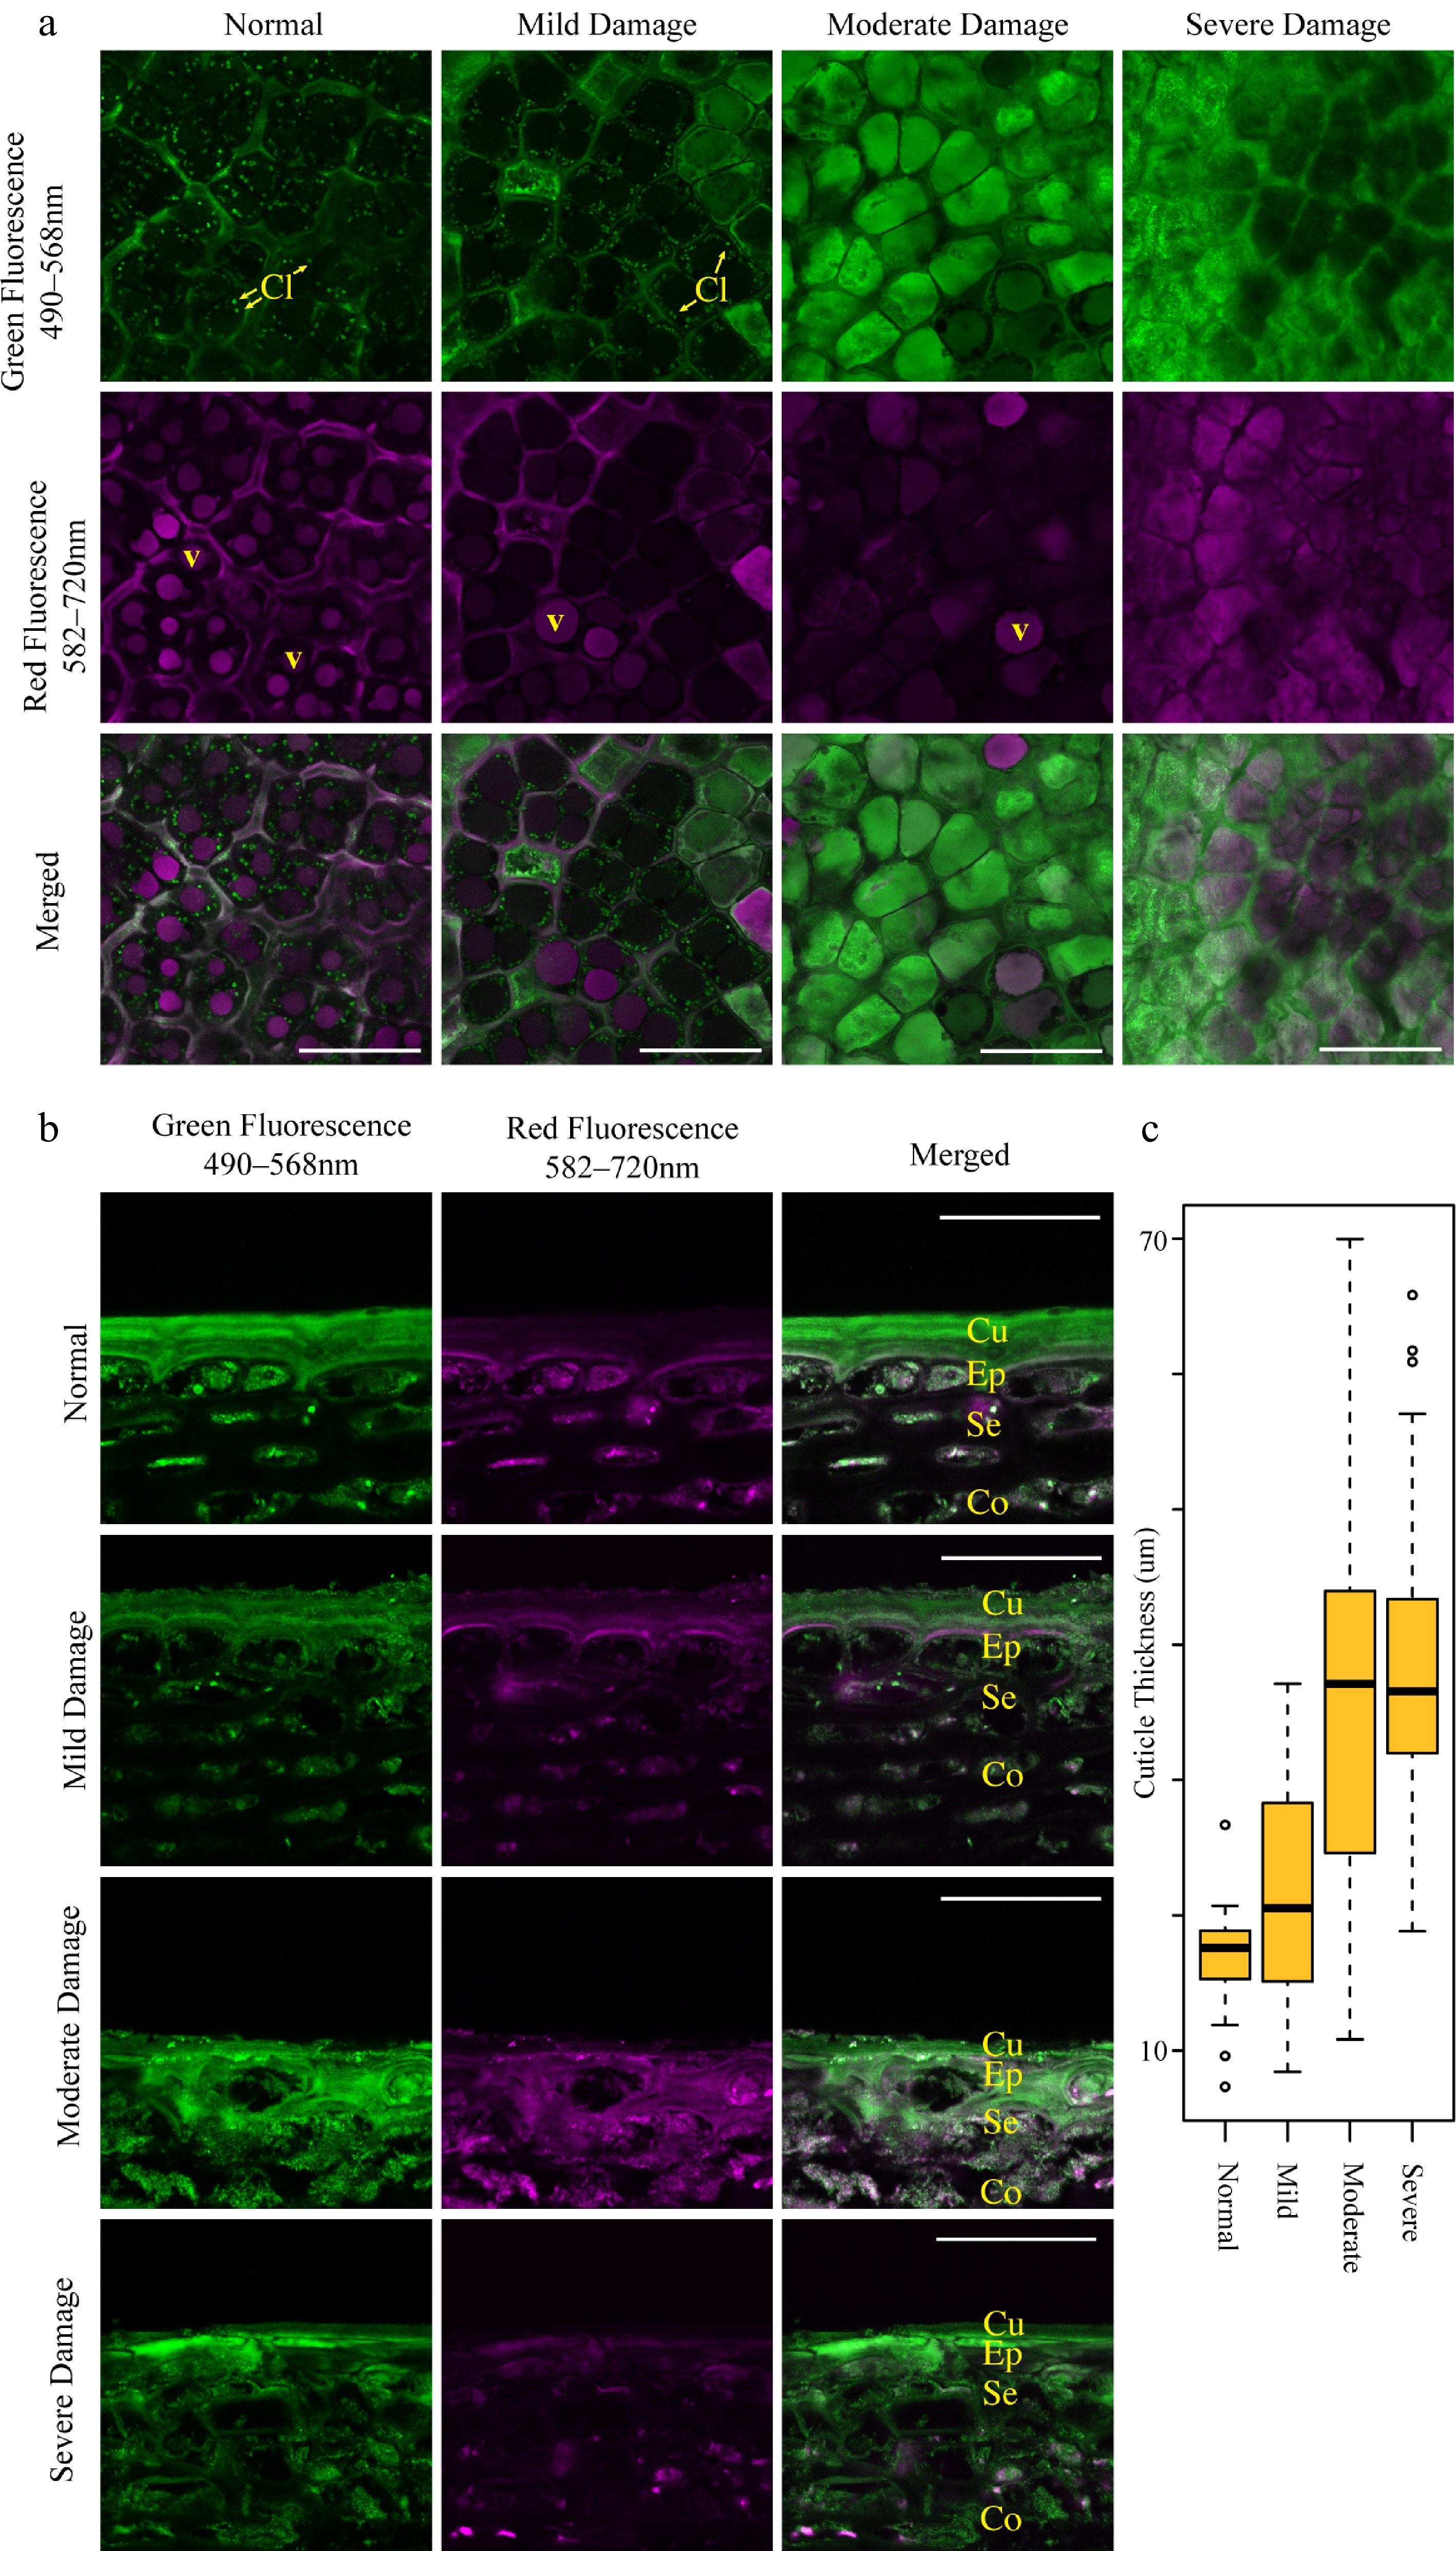
Figure 5.
Sunburn browning (SB) damage results in altered cellular structures including decreased chloroplast and anthocyanin autofluorescence and increased cuticle thickness. Confocal micrographs of (a) tangential sections and (b) transverse sections of 'Buckeye Gala' apple epidermis exhibit no, mild and moderate SB damage. Scale bars = 75 μm in (a) and 50 μm in (b). V, vacuole; Cl, chloroplasts; Cu, cuticle; Ep, epidermal tissue; Se, subepidermal tissue; Co, cortex. (c) Boxplot measurements of cuticular thickness in sun-exposed skin with various degrees of SB damage, as measured from the edge of the cuticle to the first living cell layer. (n = 50 measurements from 10 micrographs each; circles represent outliers).
-
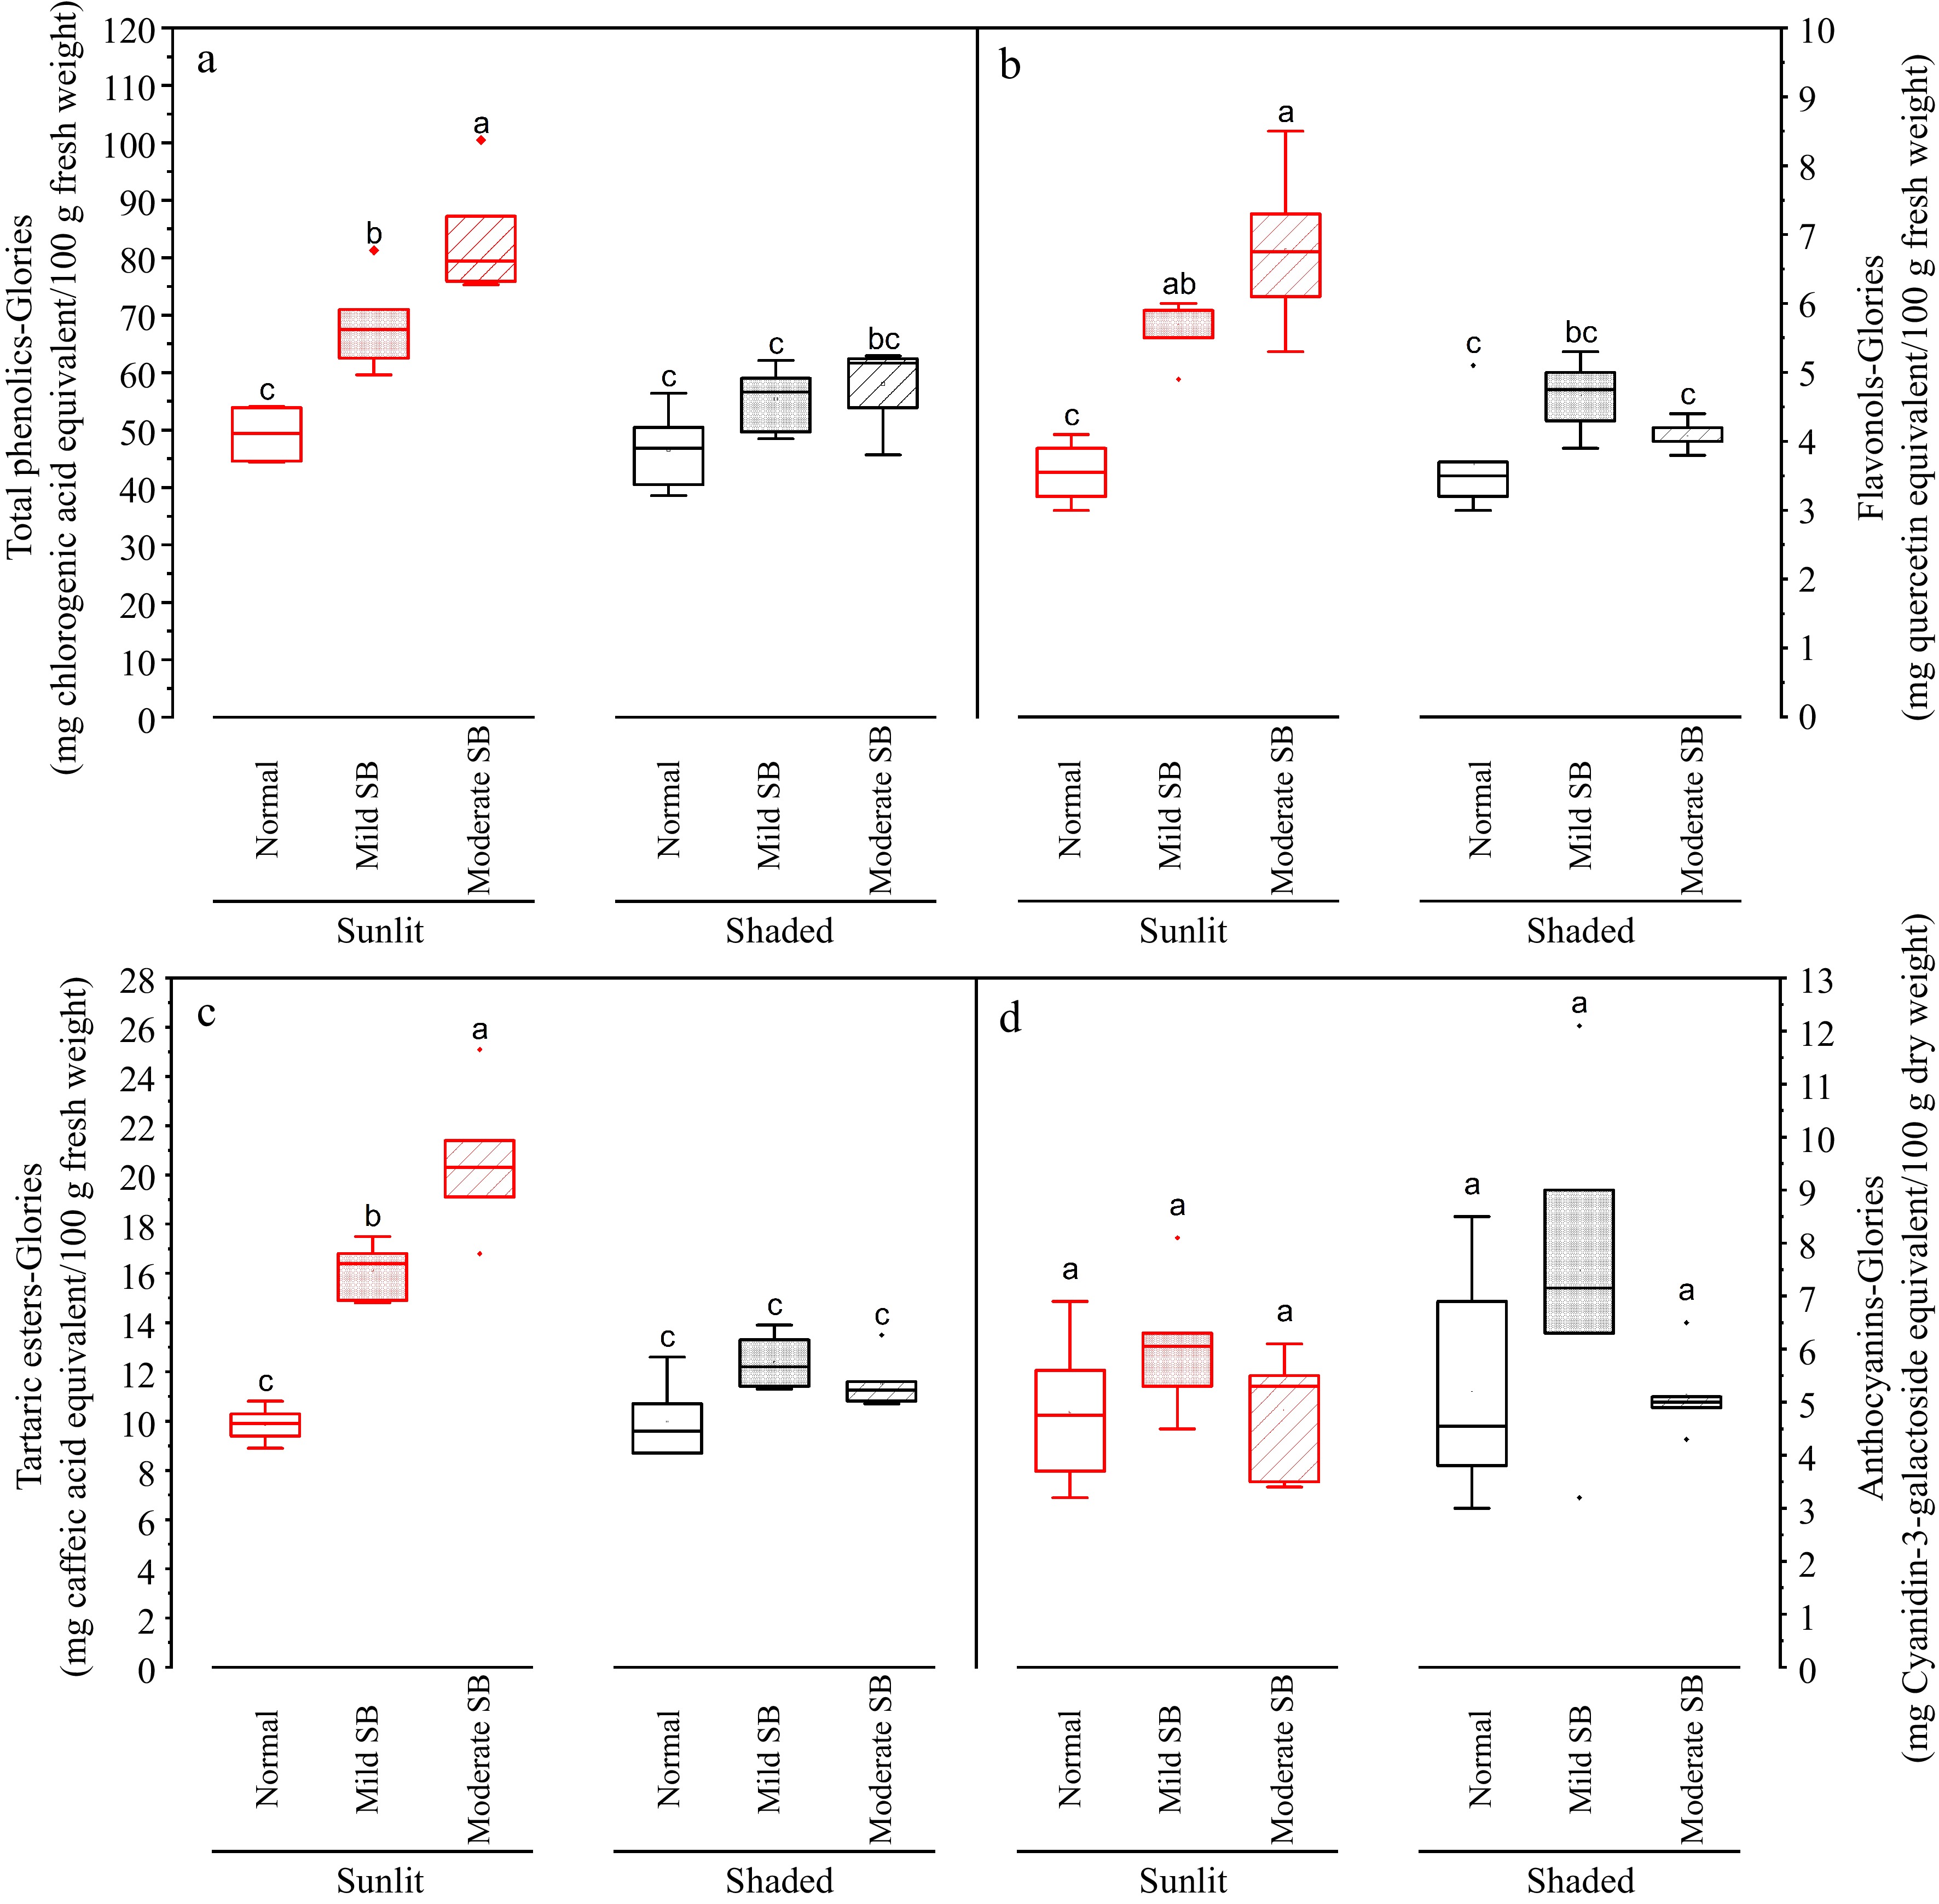
Figure 6.
Total phenolics, flavonols, tartaric esters and anthocyanin in the flesh on sunlit and shaded sides of normal, mild sunburn browning (SB) and moderate SB Buckeye Gala apples. Different letters in each subpanel represent significant difference of fruit side × SB severity interaction effect (two-way ANOVA, Tukey's test, p ≤ 0.05).
-
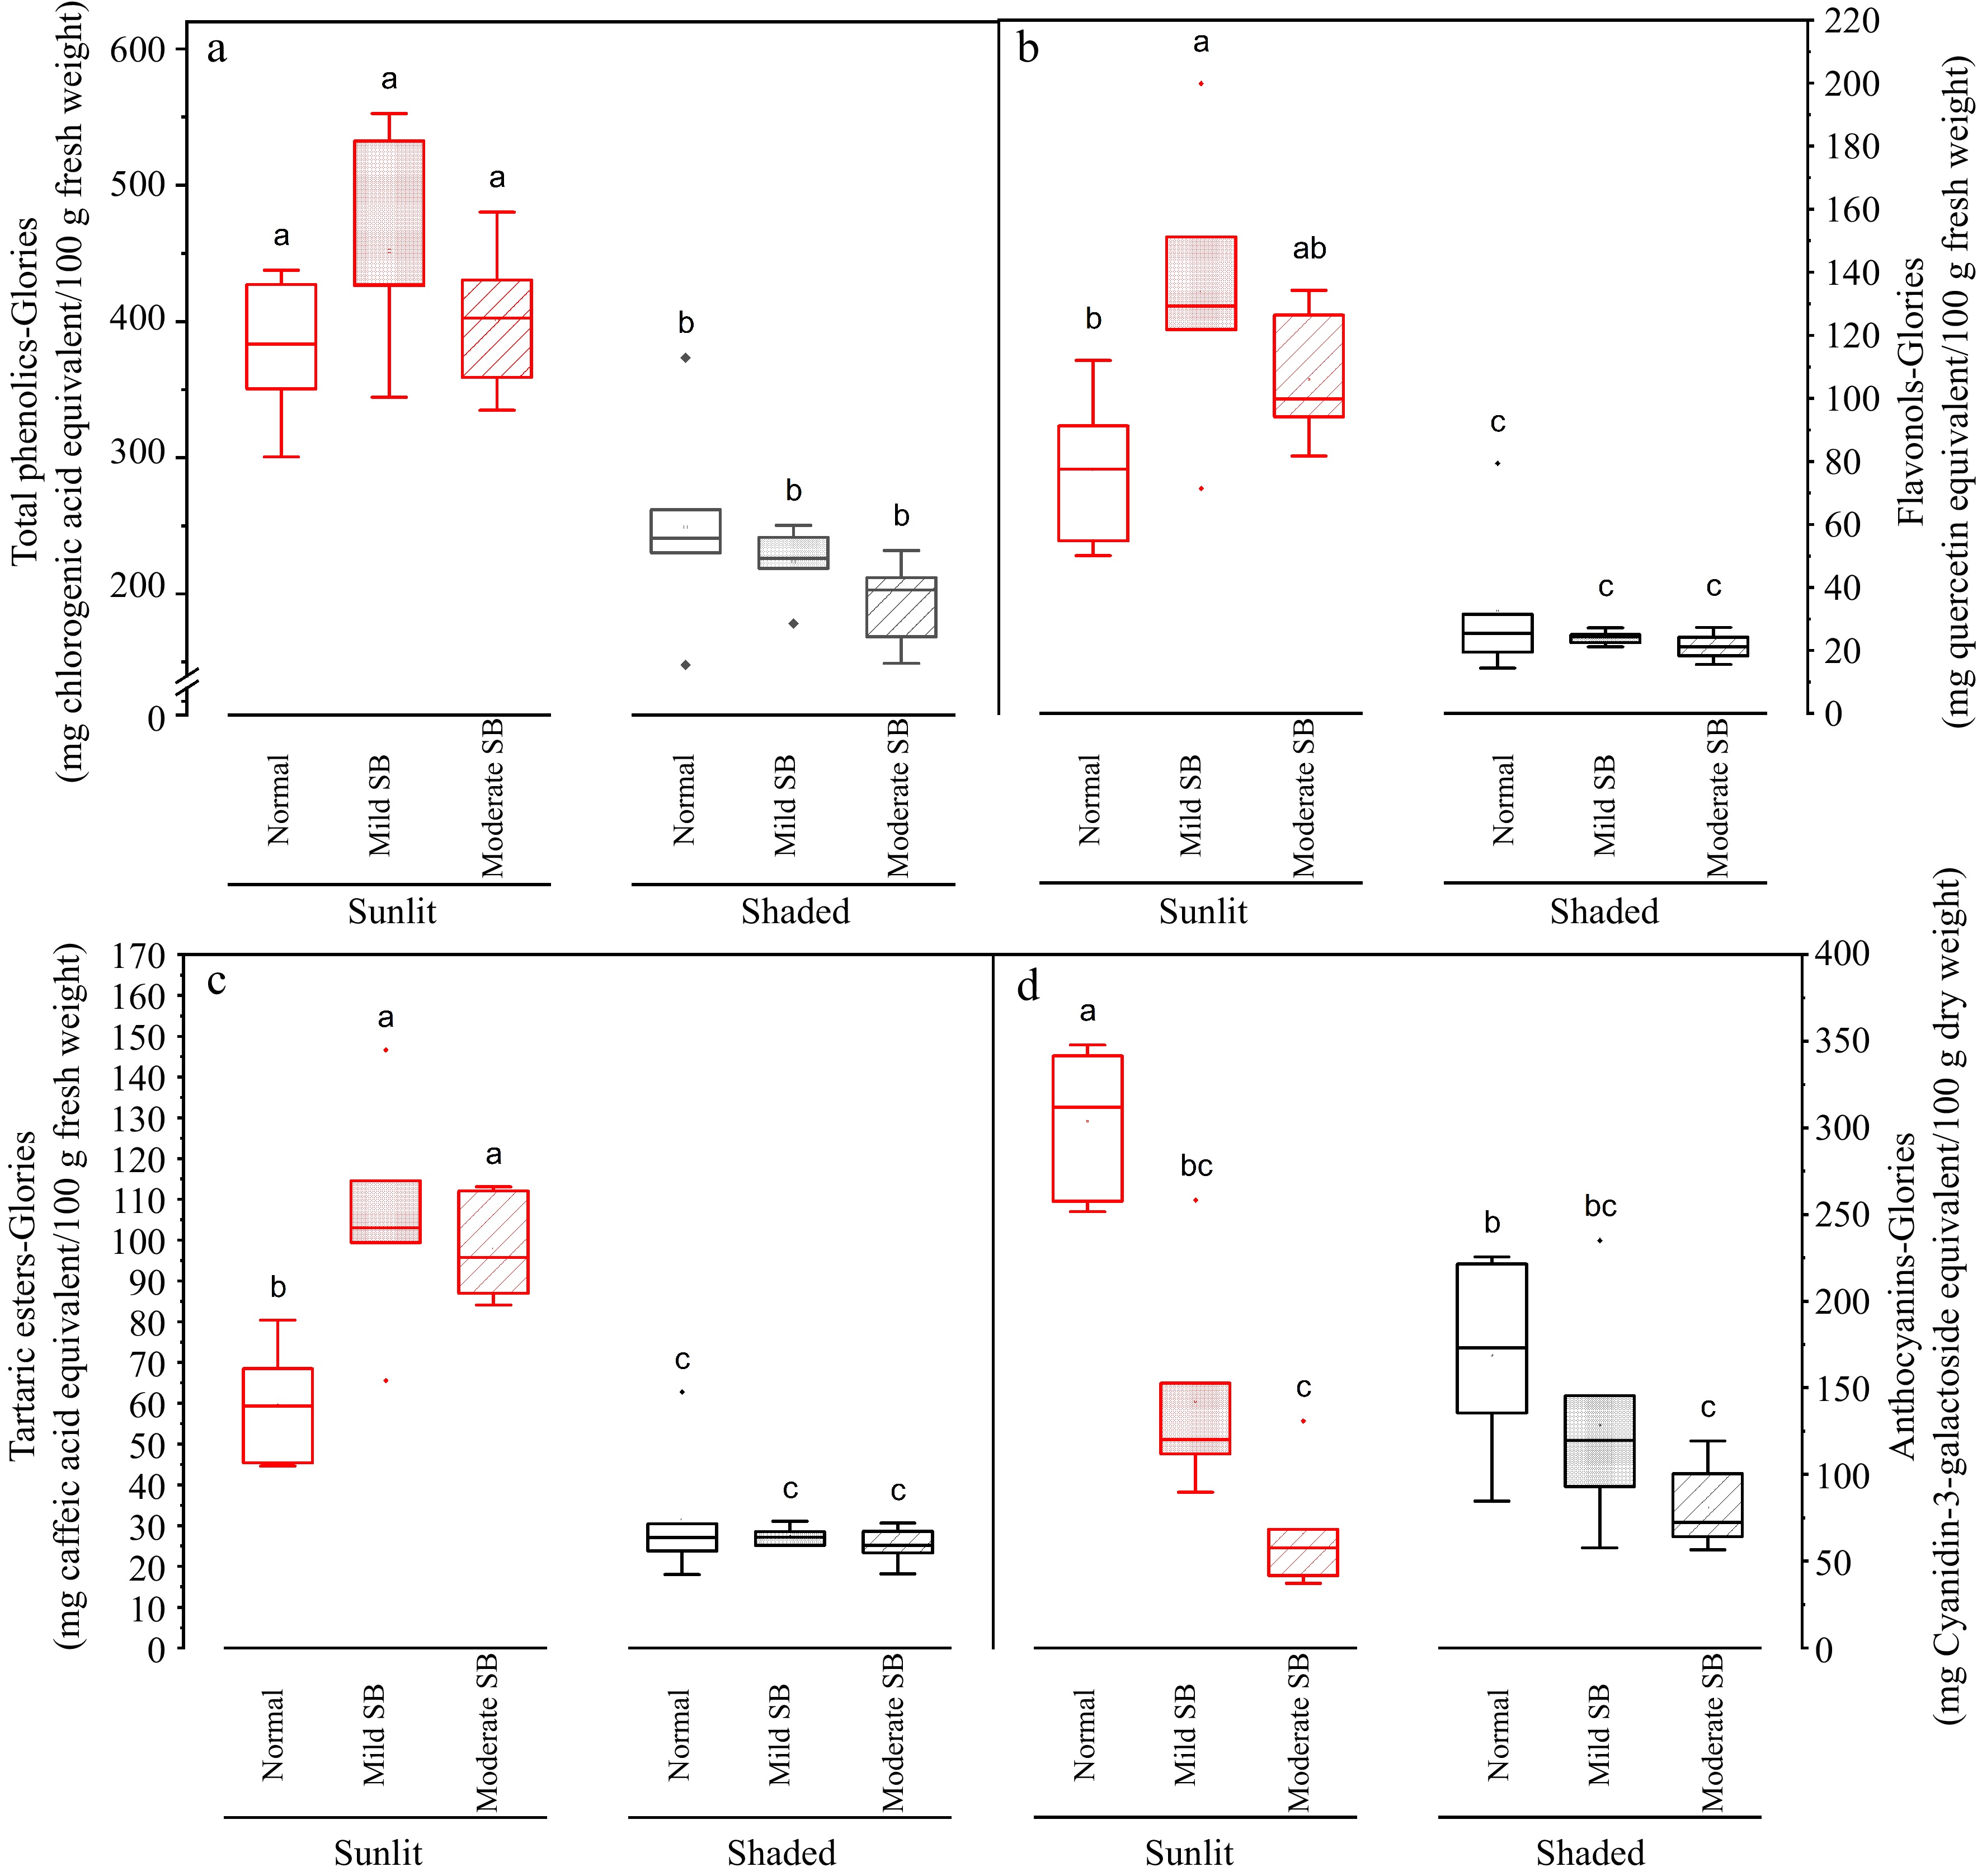
Figure 7.
Total phenolics, flavonols, tartaric esters and anthocyanin in the peel on sunlit and shaded sides of normal, mild sunburn browning (SB) and moderate SB Buckeye Gala apples. Different letters in each subpanel represent significant difference of fruit side × SB severity interaction effect (two-way ANOVA, Tukey's test, p ≤ 0.05).
-

Figure 8.
(a) Principal Component Analysis and (b) correlation matrix of the correlations between fruit skin δA and the contents of total phenolics, flavonols, tartaric esters and anthocyanin in peel and flesh on sunlit and shaded sides of normal, mild sunburn browning (Mild SB) and Moderate SB 'Buckeye Gala' apples (n = 6, N = 72).
-
Fruit condition Normal Mild-Moderate SB d δA At harvest 0.074 ± 0.01a 0.351 ± 0.02b dDMC (%) At harvest 0.74 ± 0.2a 6.00 ± 0.2b d Ψ (MPa) At harvest −0.09 ± 0.07a −0.65 ± 0.07b Fruit mass (g) At harvest 188.5 ± 4.1a, A 158.1 ± 2.5b, A 2 m 163.0 ± 3.2b, B 150.9 ± 2.6b, A 7 m 158.8 ± 2.9b, B 146.9 ± 2.9b, A Firmness (lbs) At harvest 18.26 ± 0.10a, A 21.33 ± 0.41b, A 2 m 11.78 ± 0.19a, B 12.30 ± 0.35b, B 7 m 11.34 ± 0.29a, B 13.26 ± 0.42b, B SSC (%) At harvest 12.89 ± 0.07a, A 14.18 ± 0.18b, B 2 m 13.46 ± 0.58a, A 15.73 ± 0.46b, A 7 m 12.4 ± 0.12a, C 14.05 ± 0.32b, B TA
(g malic acid/L)At harvest 4.69 ± 0.11a, A 4.66 ± 0.25a, A 2 m 4.05 ± 0.14a, B 3.37 ± 0.03b, B 7 m 1.95 ± 0.21a, C 2.93 ± 0.28b, C Values are mean ± standard error. For each parameter, lowercase letters in the same row represent significant difference of SB effect, and uppercase letters in the same column represent significant difference of time effect (one-way ANOVA, Tukey's test, p ≤ 0.05). Table 1.
Differential skin delta Absorbance d δA), differential dry matter content (dDMC) and differential flesh water potential (d Ψ) at harvest, and mass, firmness, soluble solids content (SSC), titratable acids concentration (TA) of Normal and Mild-Moderate sunburn browning (SB) 'Buckeye Gala' apple at harvest, and after 2-month (2 m) and 7-month (7 m) air storage at 4 °C.
Figures
(8)
Tables
(1)