-
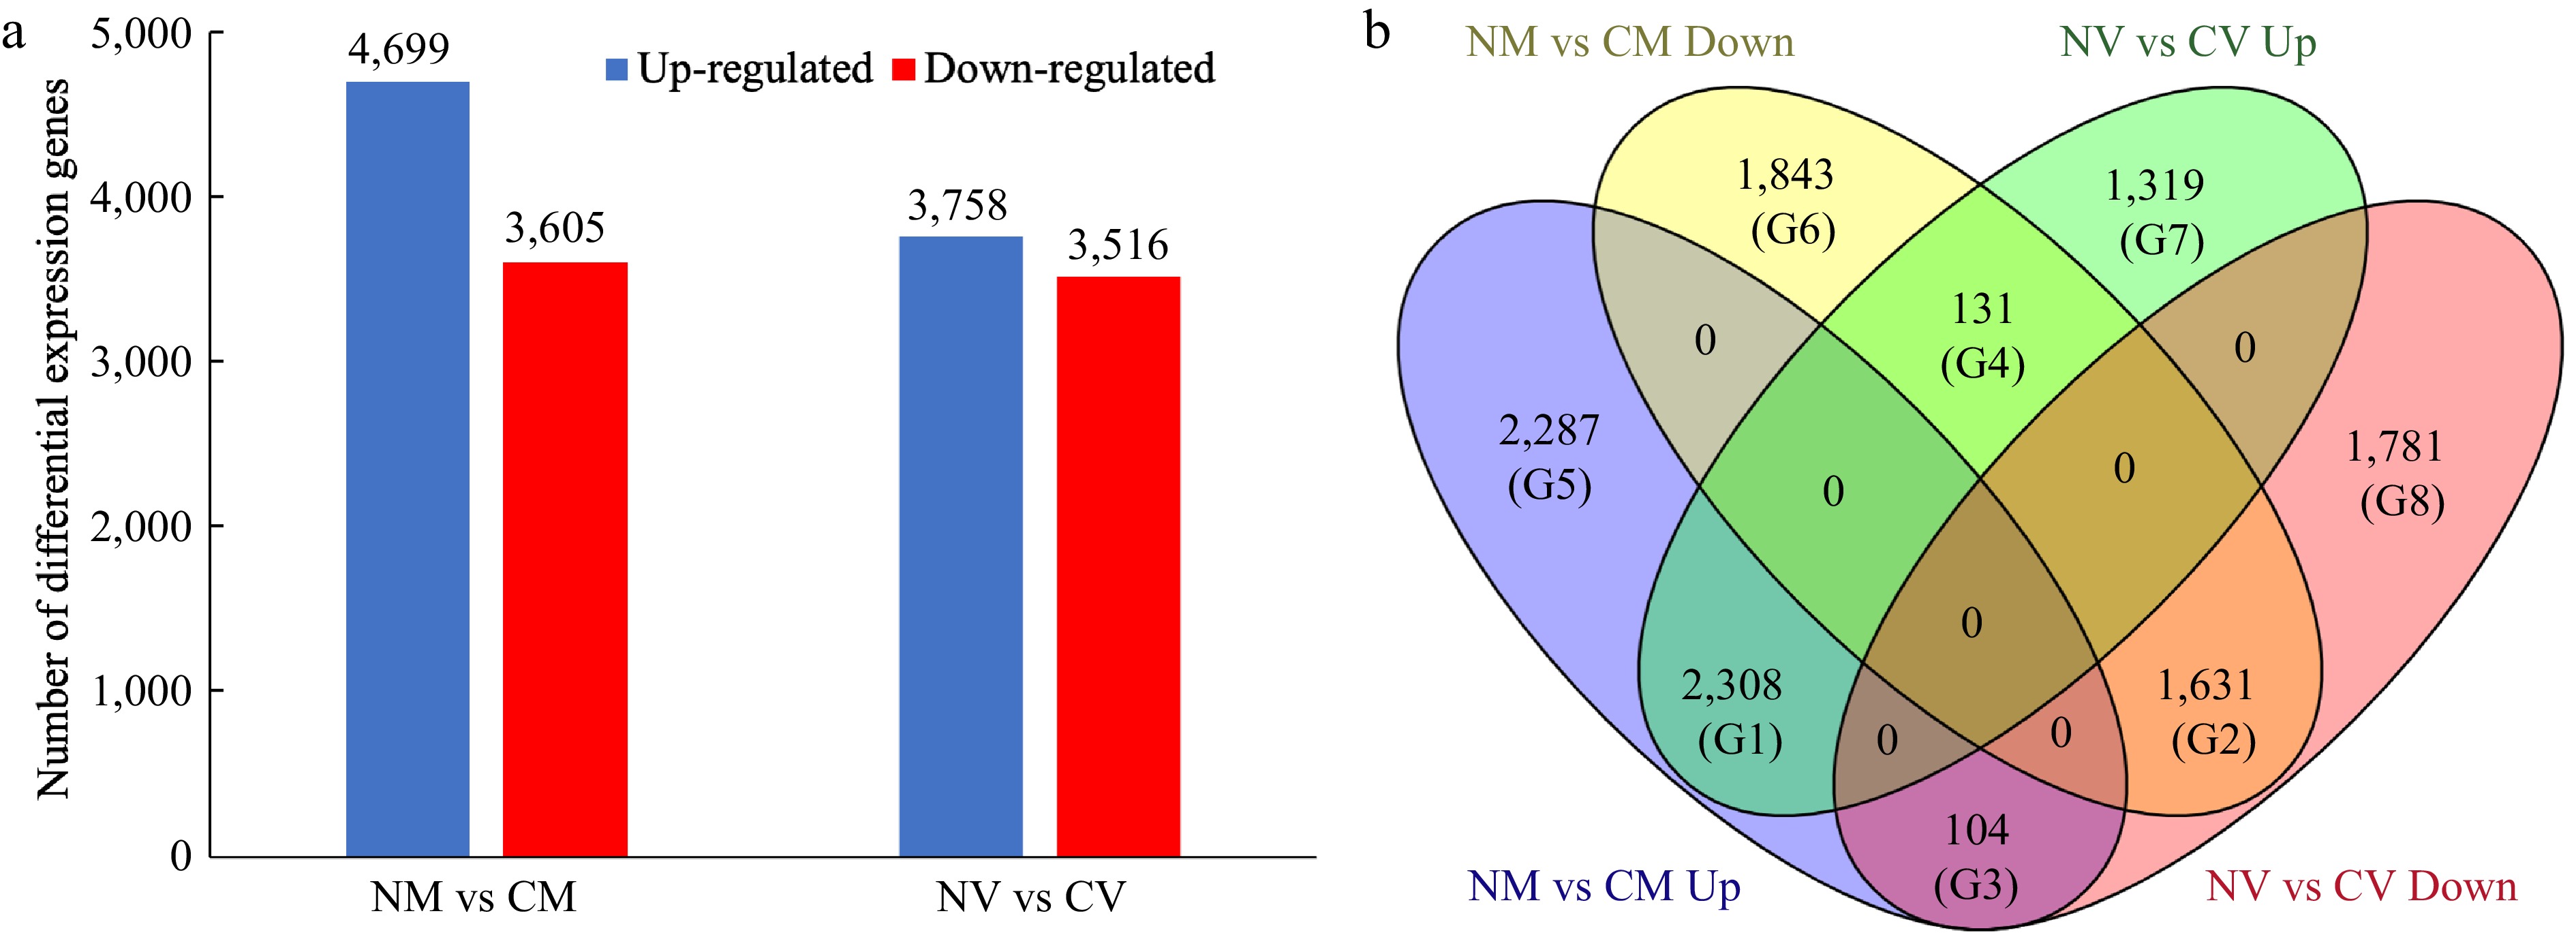
Figure 1.
Differentially expressed genes (DEGs) in Z. japonica in response to cold acclimation. (a) Number of DEGs identified in the 'Meyer' (resistant) and 'Victoria' (susceptible) genotypes. (b) Venn diagram of differentially expressed genes, showing the unique and overlapping genes expressed among comparison groups. NM vs CM: non-cold acclimated 'Meyer' vs cold acclimated 'Meyer' (R genotype); NV vs CV: non-cold acclimated 'Victoria' vs cold acclimated 'Victoria' (S genotype). G1−G8 indicated eight groups.
-
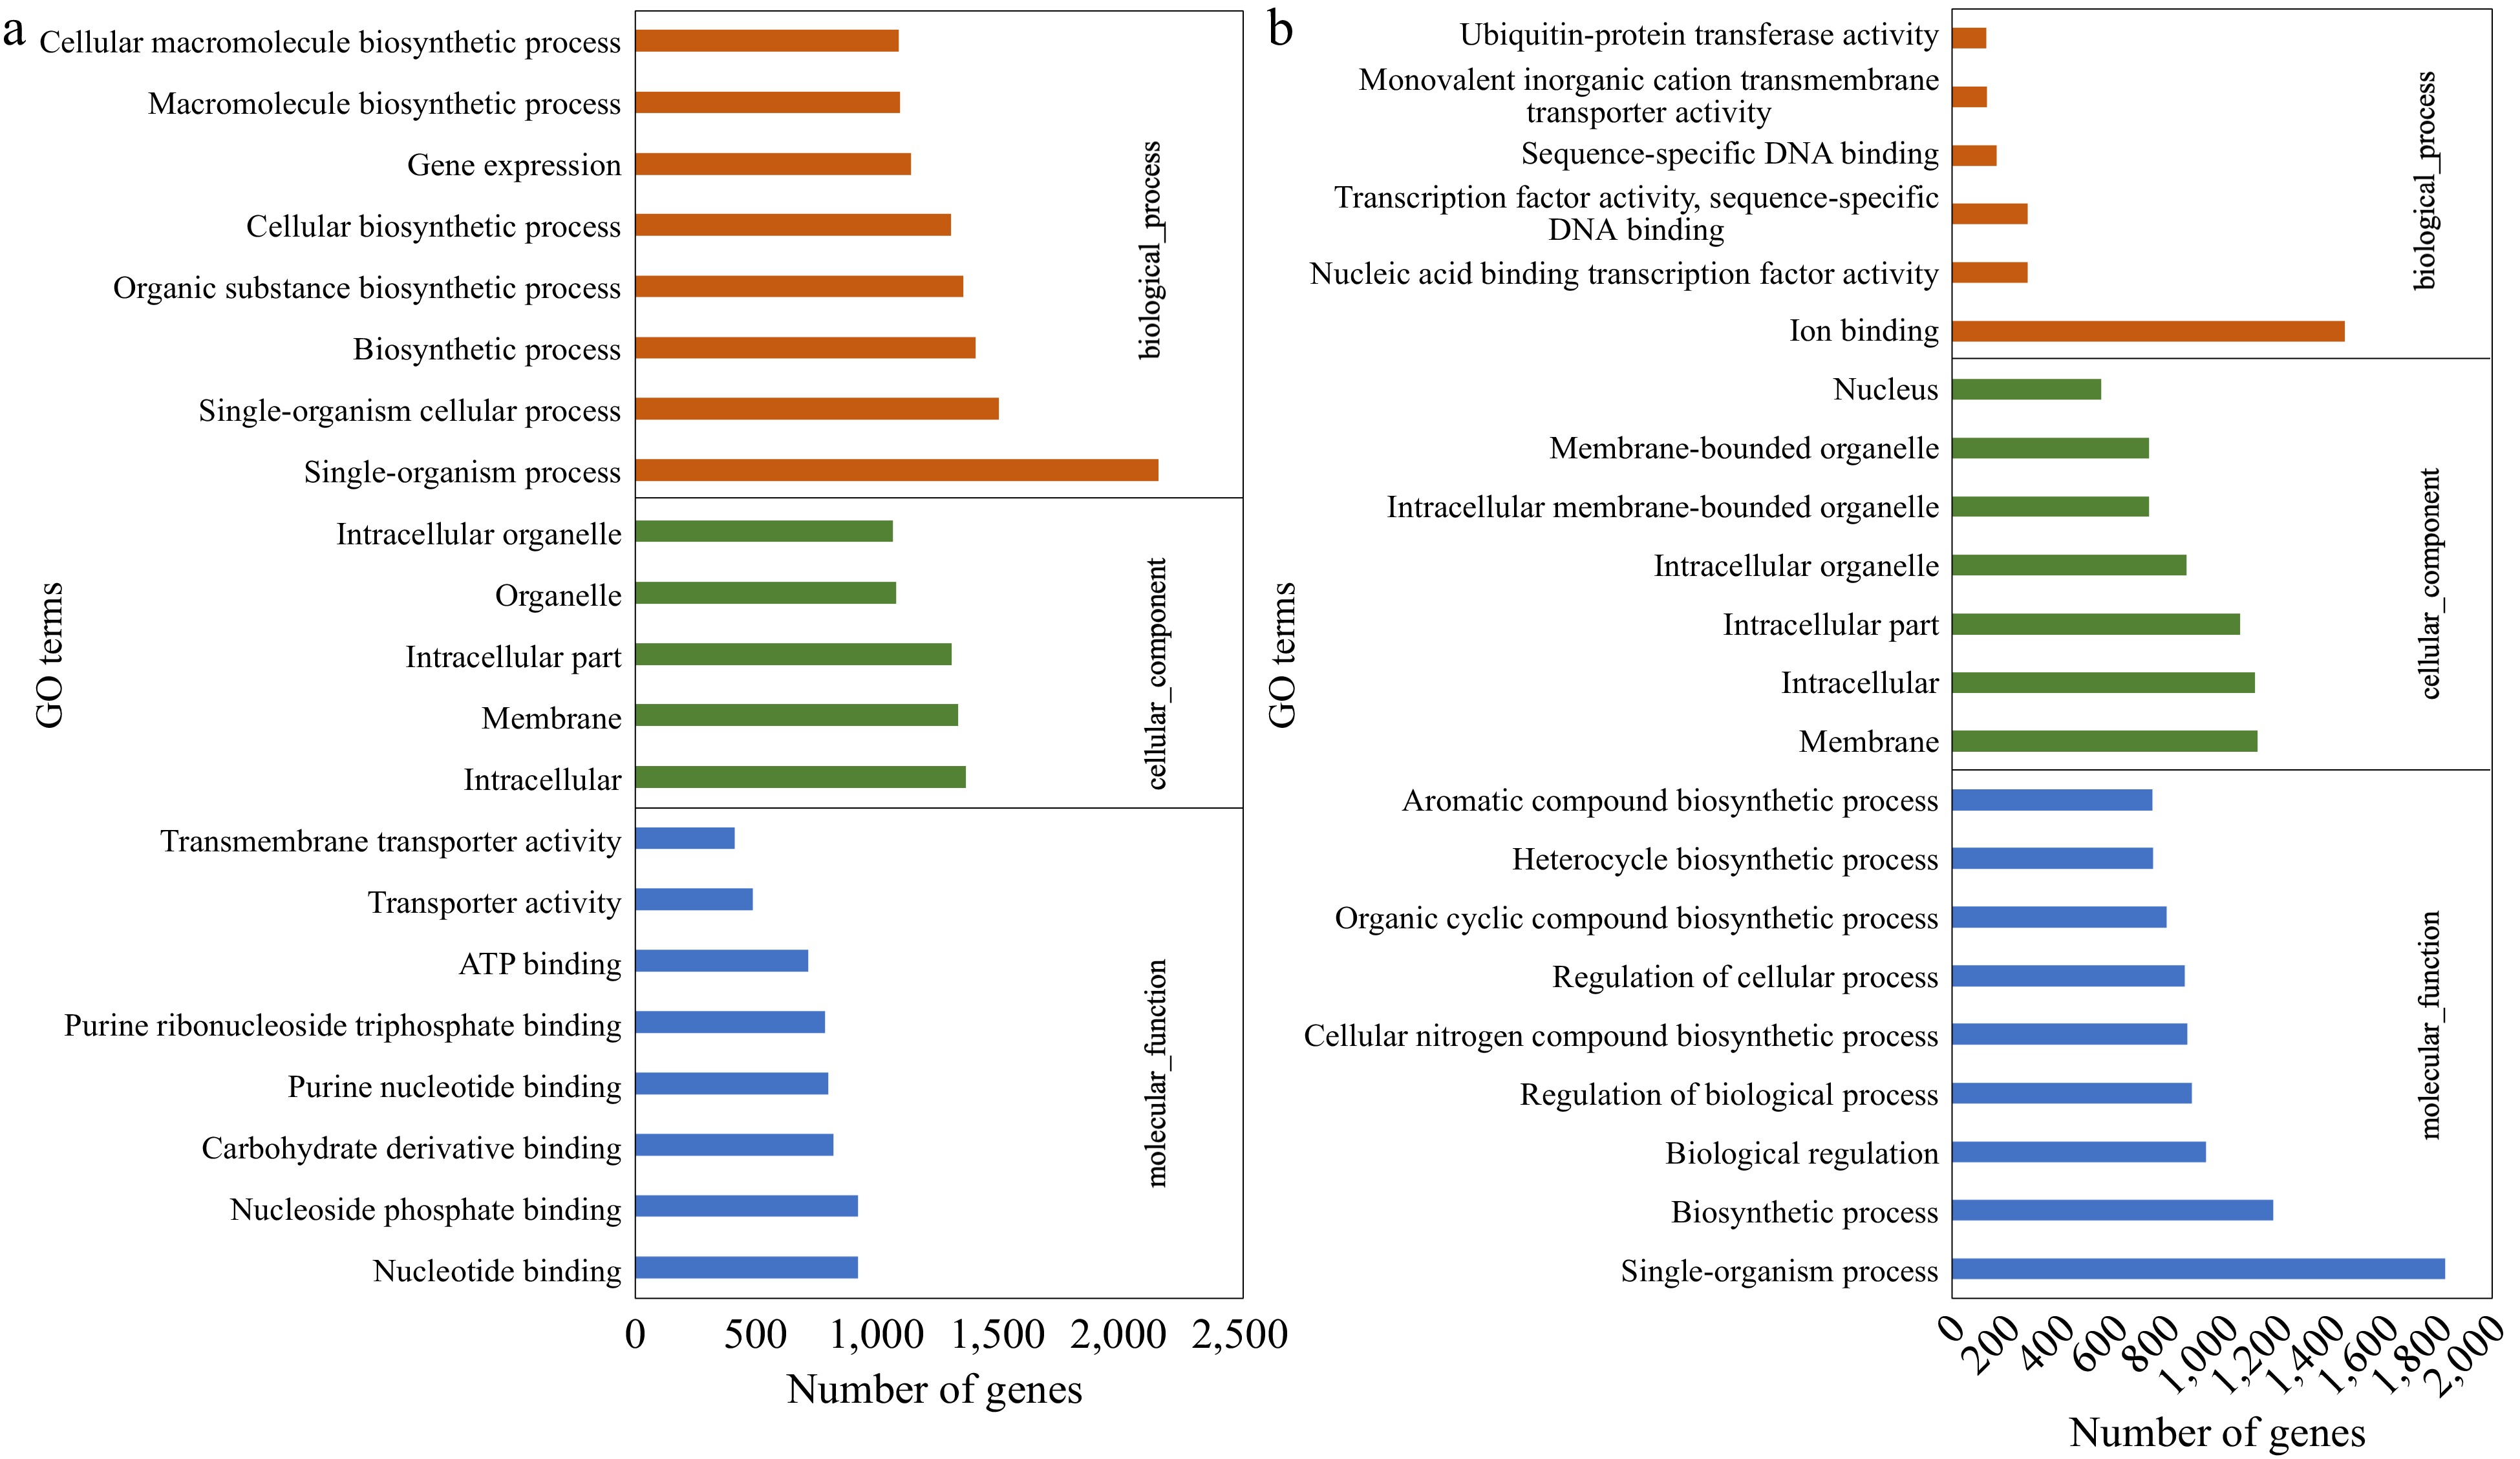
Figure 2.
Gene Ontology (GO) classification of the up-regulated DEGs identified in (a) CM vs NM and (b) CV vs NV comparisons. DEGs were annotated in three categories: biological process, cellular component, and molecular function.
-
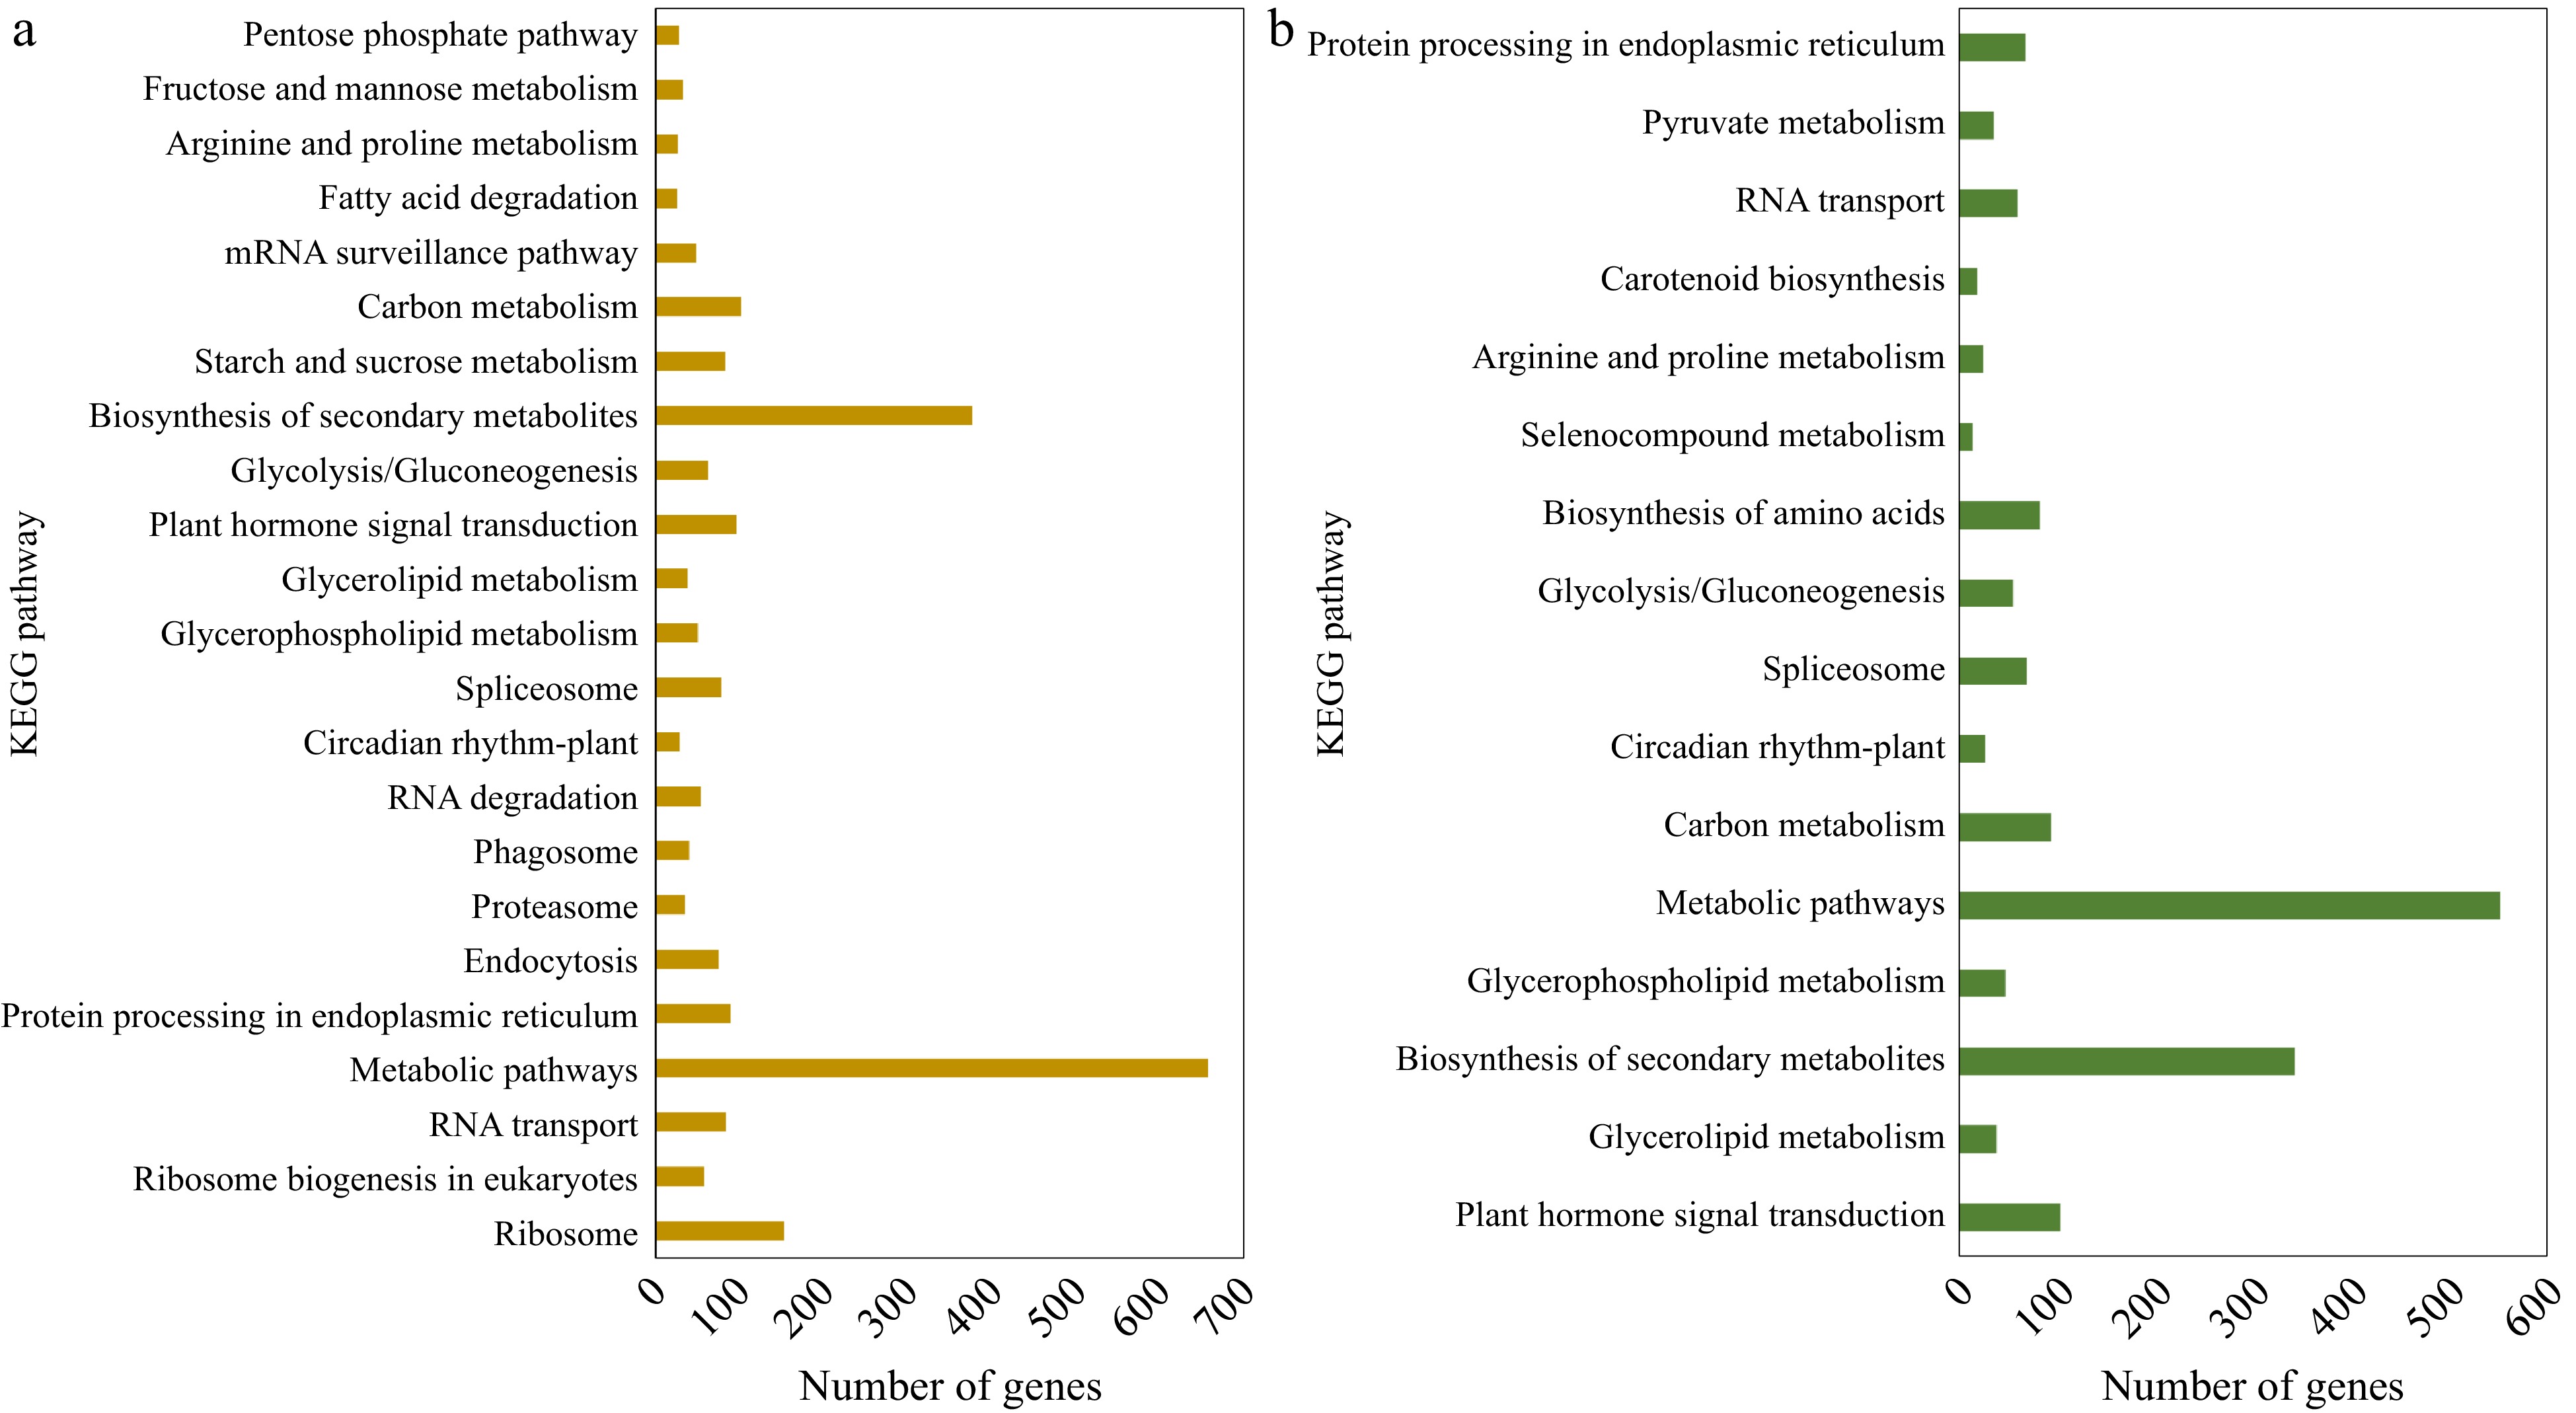
Figure 3.
KEGG pathway classification of the up-regulated DEGs identified in (a) CM vs NM and (b) CV vs NV comparisons.
-
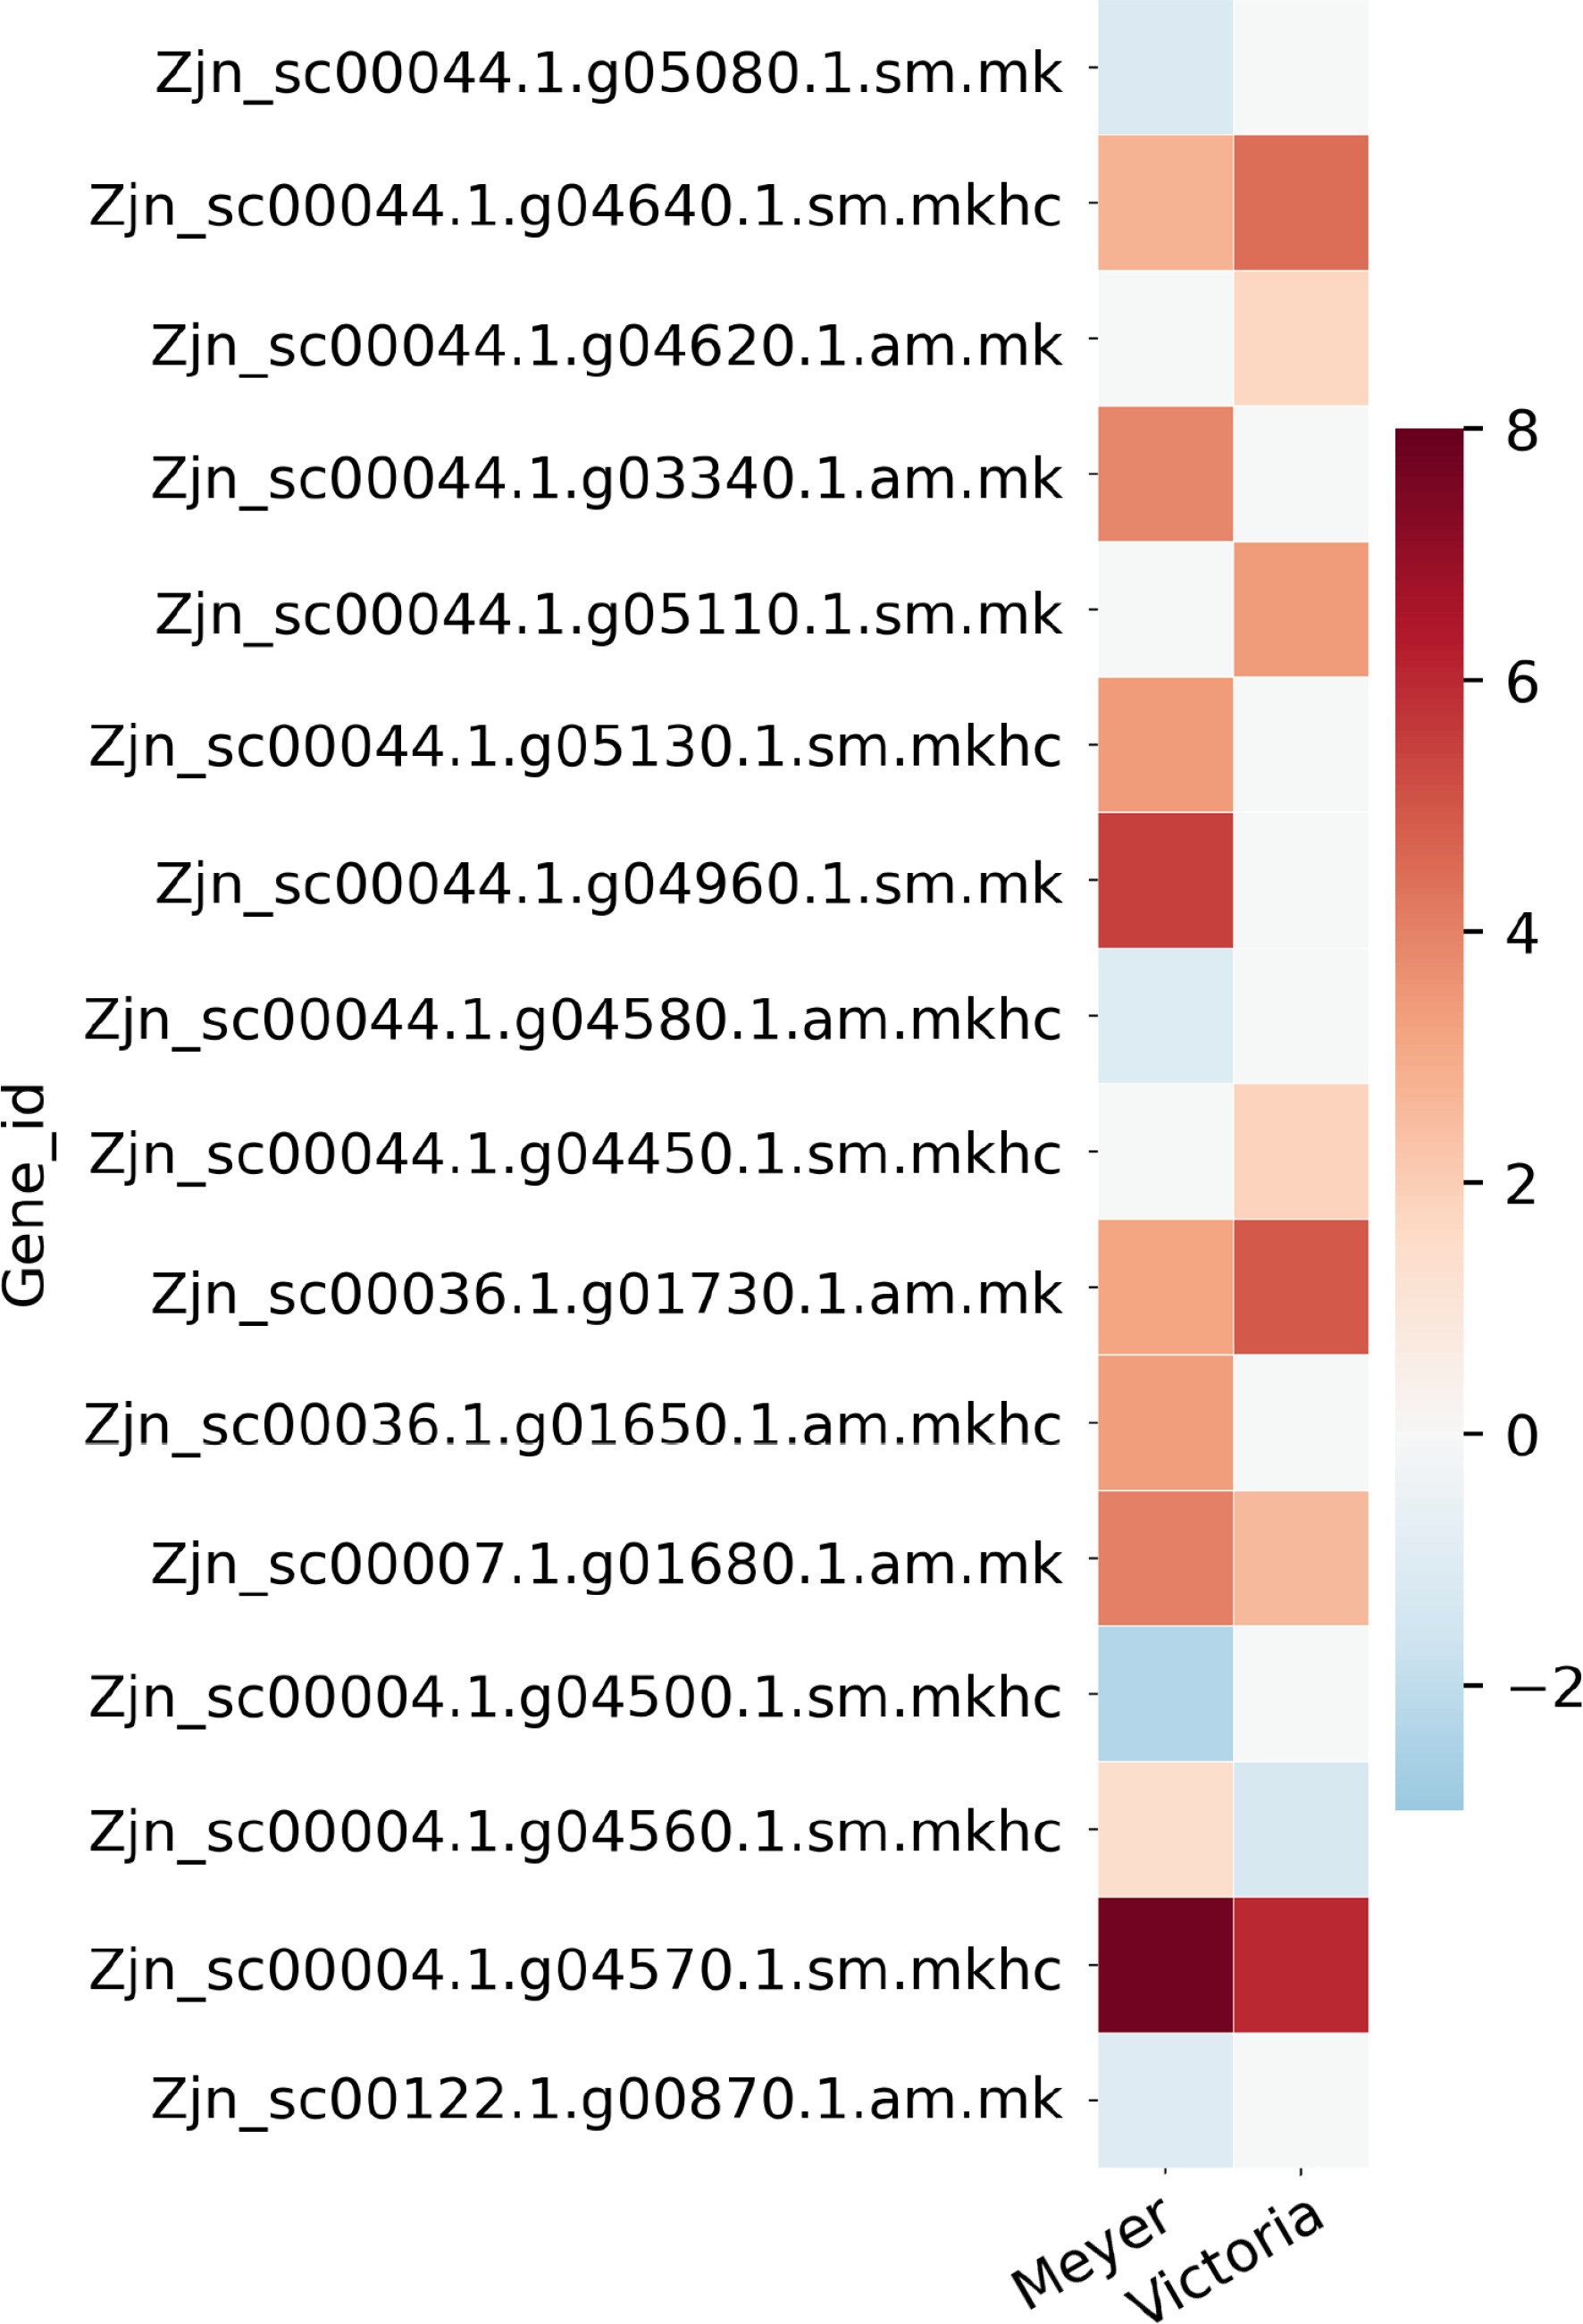
Figure 4.
Heat map of partial candidate acclimation response genes that were identified both in the QTL regions previously reported in Brown et al.[15] and the differentially expressed genes reported here. Color bar shows the log2(Fold Change) value, red color indicates up-regulation, blue color indicates down-regulation, and white color indicates no significant change.
-
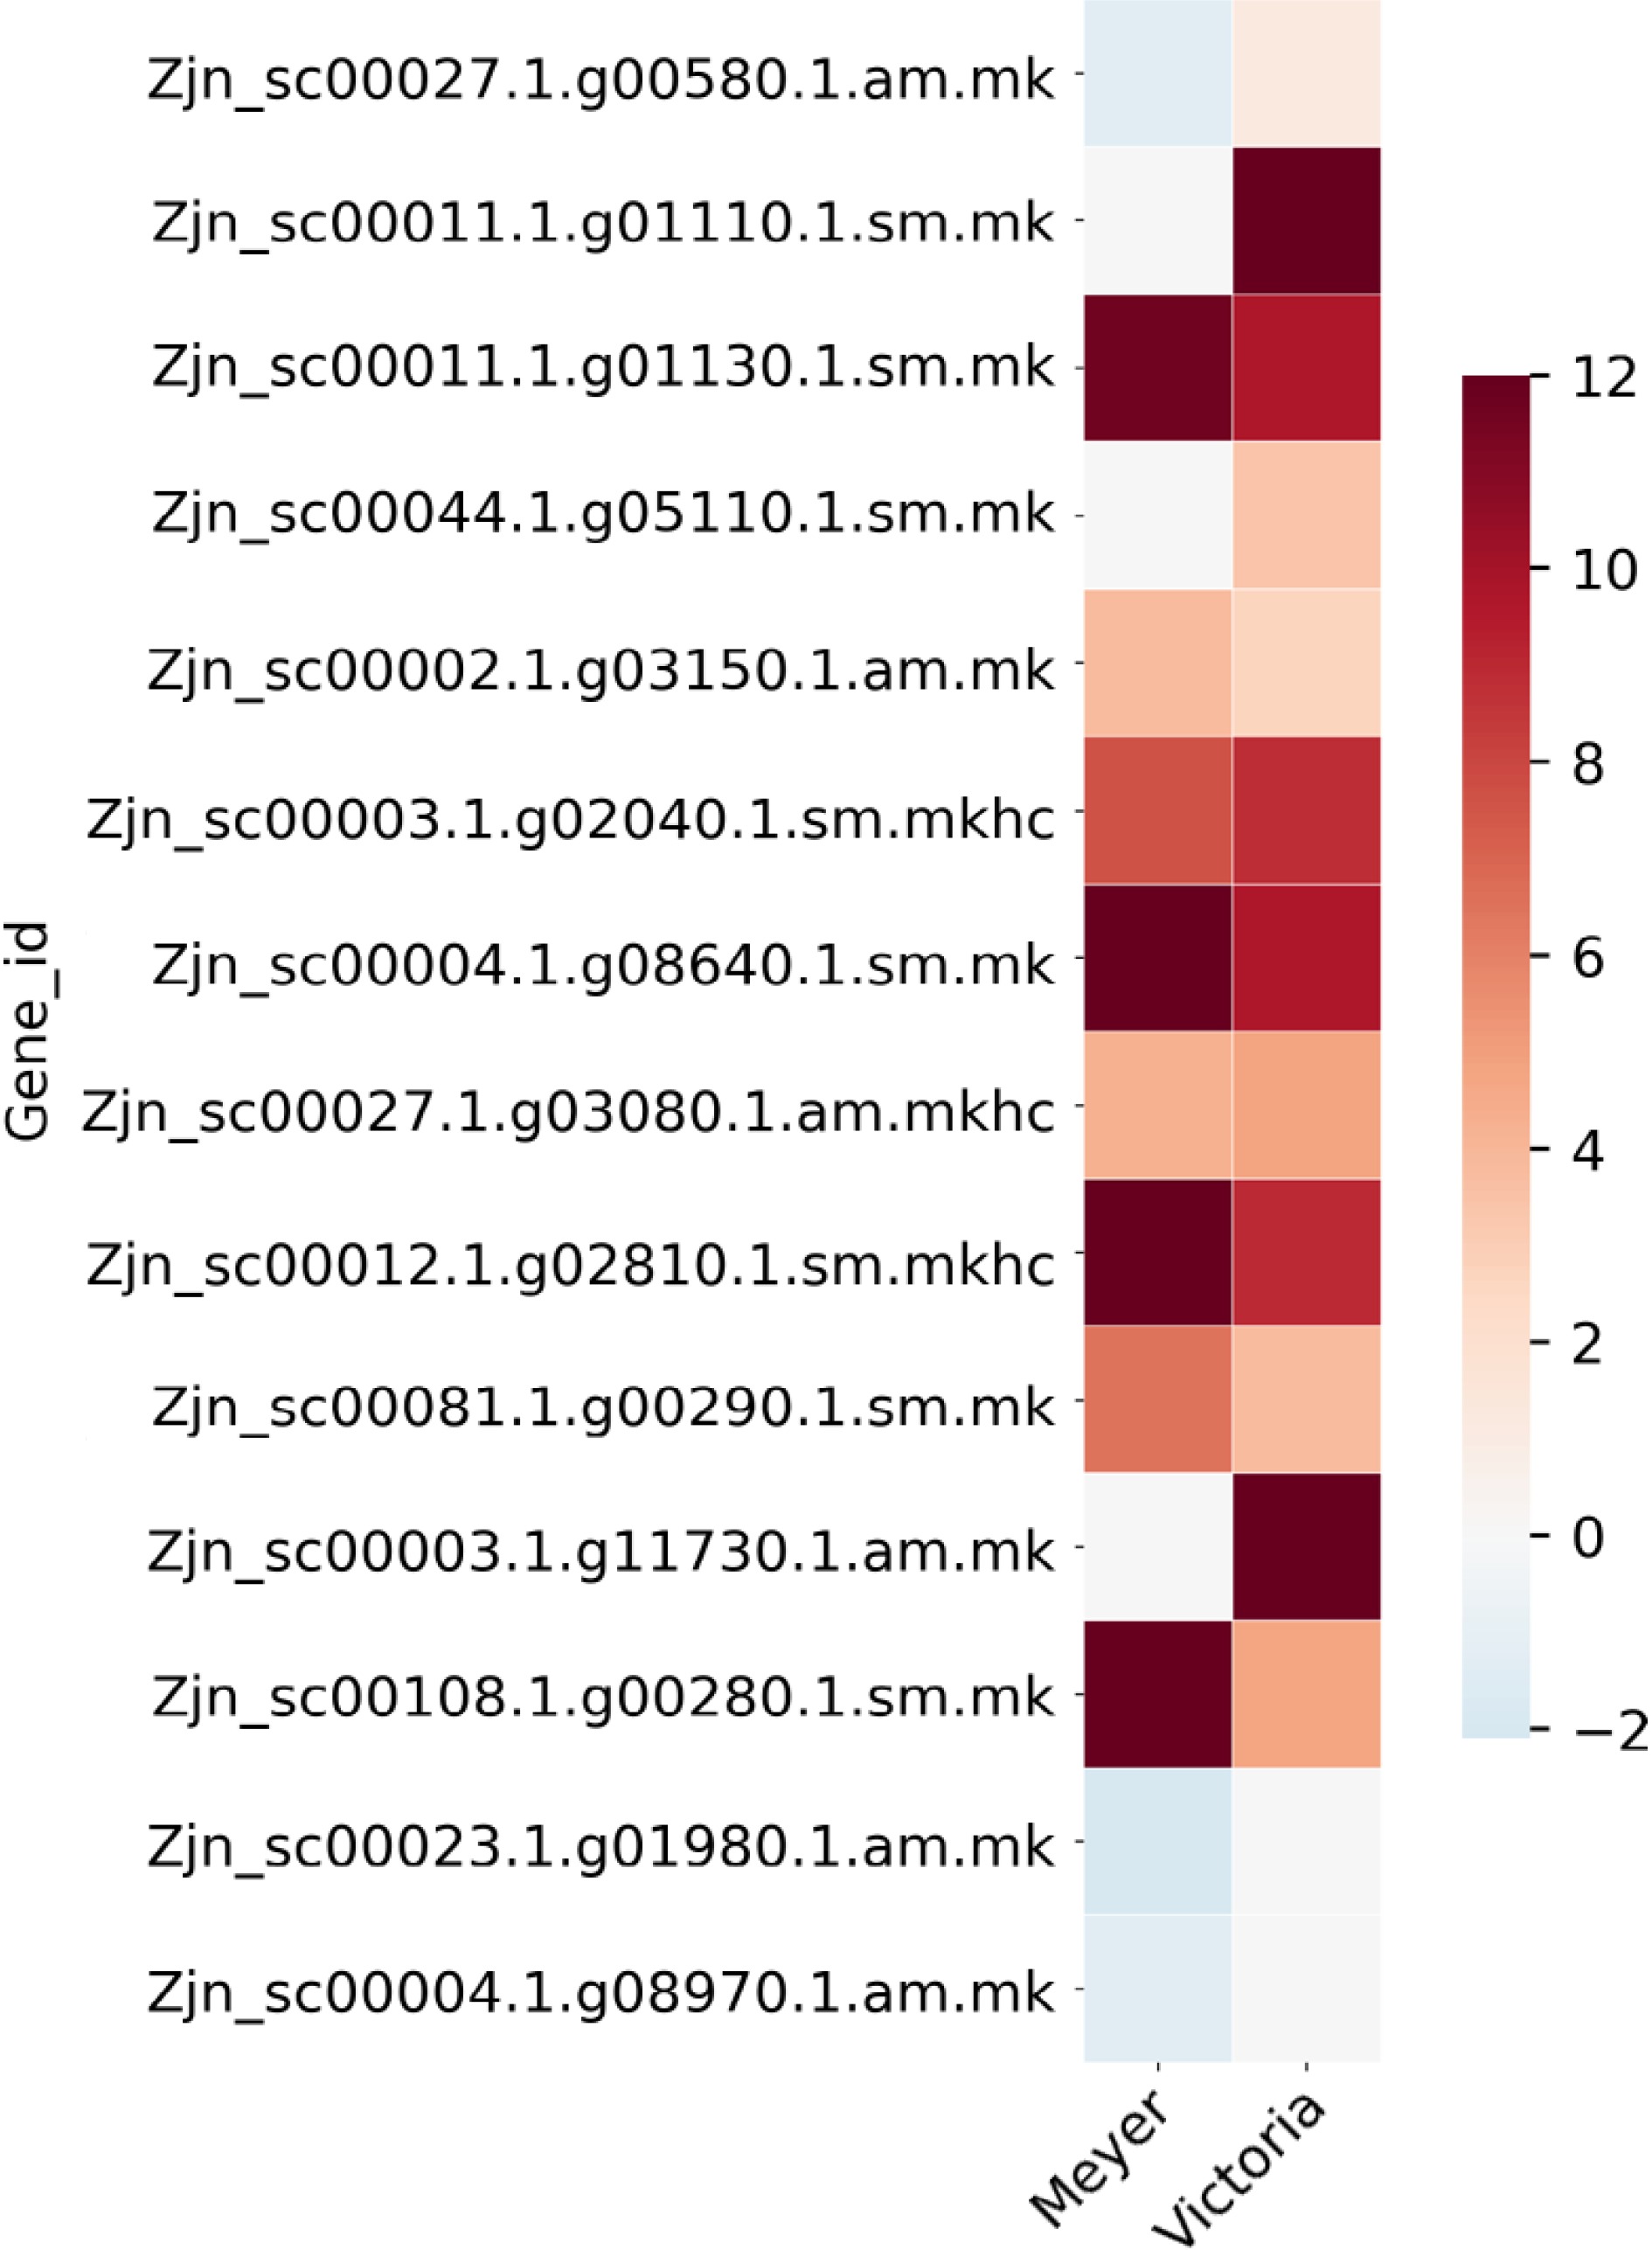
Figure 5.
Heat map of Late embryogenesis abundant protein (LEA) genes that were identified as differentially expressed after cold acclimation in Z. japonica, which were also differentially expressed in protein abundance in a previous study[16]. Color bar shows the log2(Fold Change) value, red color indicates up-regulation, blue color indicates down-regulation, and white color indicates no significant change.
-
Sample Raw reads Clean reads Clean bases Error rate (%) Q20 (%) Q30 (%) GC content (%) NM1 49,475,254 48,077,382 7.2G 0.03 97.92 94.15 57.25 NM2 51,183,836 50,010,472 7.5G 0.03 97.84 93.99 57.49 NM3 50,168,628 49,079,396 7.4G 0.03 97.88 94.04 57.49 CM1 59,804,056 58,665,446 8.8G 0.03 97.37 92.95 52.47 CM2 67,204,258 65,599,380 9.8G 0.03 97.35 92.94 51.48 CM3 53,728,046 52,608,814 7.9G 0.03 97.11 92.48 52.52 NV1 71,039,902 69,474,296 10.4G 0.03 97.47 93.19 53.68 NV2 46,536,824 45,397,712 6.8G 0.03 97.39 93.03 52.99 NV3 55,073,384 53,918,022 8.1G 0.03 97.08 92.41 53.03 CV1 61,931,458 6,0855,104 9.1G 0.03 97.43 93.12 52.9 CV2 51,018,634 49,819,784 7.5G 0.03 97.28 92.84 52.43 CV3 67,843,324 66,500,252 10.0G 0.03 97.49 93.23 52.78 *NM: 'Meyer' genotype under non-cold acclimated conditions; CM: 'Meyer' genotype under cold acclimated conditions; NV: 'Victoria' genotype under non-cold acclimated conditions; CV: 'Victoria' genotype under cold acclimated conditions. Table 1.
Summary of reads following Illumina sequencing.
-
QTL
regionGene_id log2FoldChange 'Meyer' log2FoldChange 'Victoria' Blast gene accession Blast gene name QTL1 Zjn_sc00044.1.g05080.1.sm.mk −1.2035 NS Q9C5Q2 AI5L3_ARATH ABSCISIC ACID-INSENSITIVE 5-like protein 3 QTL1 Zjn_sc00044.1.g04640.1.sm.mkhc 2.7812 4.4685 Q7X996 CIPK2_ORYSJ CBL-interacting protein kinase 2 QTL1 Zjn_sc00044.1.g04620.1.am.mk NS 1.7587 Q7XIW5 CIPKT_ORYSJ CBL-interacting protein kinase 29 QTL1 Zjn_sc00044.1.g03340.1.am.mk 3.9076 NS Q7XHZ0 HFB4B_ORYSJ Heat stress transcription factor B-4b QTL1 Zjn_sc00044.1.g05110.1.sm.mk NS 3.422 A3AHG5 LEA17_ORYSJ Late embryogenesis abundant protein 17 QTL1 Zjn_sc00044.1.g05130.1.sm.mkhc 3.3773 NS Q10MB4 MYB2_ORYSJ Transcription factor MYB2 QTL1 Zjn_sc00044.1.g04960.1.sm.mk 5.4299 NS A0SPJ6 NAMB2_TRITD NAC transcription factor NAM-B2 QTL1 Zjn_sc00044.1.g04580.1.am.mkhc −1.0768 NS P42736 RAP23_ARATH Ethylene-responsive transcription factor RAP2-3 QTL1 Zjn_sc00044.1.g04450.1.sm.mkhc NS 1.8656 Q9SW70 SRP_VITRI Stress-related protein QTL2 Zjn_sc00036.1.g01730.1.am.mk 3.1617 4.869 Q6VBA4 HFC1A_ORYSJ Heat stress transcription factor C-1a QTL2 Zjn_sc00036.1.g01650.1.am.mkhc 3.3333 NS Q93WV4 WRK71_ARATH WRKY transcription factor 71 QTL6 Zjn_sc00007.1.g01680.1.am.mk 4.0415 2.6034 Q6K846 IAA9_ORYSJ Auxin-responsive protein IAA9 QTL8 Zjn_sc00004.1.g04500.1.sm.mkhc −2.3169 NS Q7XBH4 MYB4_ORYSJ Transcription factor MYB4 QTL8 Zjn_sc00004.1.g04560.1.sm.mkhc 1.3851 −1.3166 P14717 PAL1_ORYSJ Phenylalanine ammonia-lyase QTL8 Zjn_sc00004.1.g04570.1.sm.mkhc 7.7281 5.9998 A2X7F7 PAL2_ORYSI Phenylalanine ammonia-lyase QTL10 Zjn_sc00122.1.g00870.1.am.mk −1.0261 NS O80341 EF102_ARATH Ethylene-responsive transcription factor 5 *log2FoldChange, positive value indicates up-regulation after cold acclimation, negative value indicates down-regulation after cold acclimation, NS indicates non-significant. Table 2.
Partial list of candidate acclimation response genes that were identified both in the QTL regions previously reported in Brown et al.[15] and differential expression genes reported in this study. Full gene list and QTL information are provided in Supplemental File 4.
-
Gene_id log2FoldChange
'Meyer'log2FoldChange
'Victoria'Blast gene
accessionBlast gene name Protein spot 64[16] 6.7 NS Late embryogenesis abundant protein 3 (LEA3) Zjn_sc00027.1.g00580.1.am.mk −1.3435 1.2295 P46518 LEA14_GOSHI Late embryogenesis abundant protein Lea14-A Zjn_sc00011.1.g01110.1.sm.mk NS Inf Q94JF2 LEA14_ORYSJ Late embryogenesis abundant protein 14 Zjn_sc00011.1.g01130.1.sm.mk 11.646 9.6458 Q94JF2 LEA14_ORYSJ Late embryogenesis abundant protein 14 Zjn_sc00044.1.g05110.1.sm.mk NS 3.422 A3AHG5 LEA17_ORYSJ Late embryogenesis abundant protein 17 Zjn_sc00002.1.g03150.1.am.mk 3.8076 2.7007 A3AHG5 LEA17_ORYSJ Late embryogenesis abundant protein 17 Zjn_sc00003.1.g02040.1.sm.mkhc 7.597 8.8459 A3AHG5 LEA17_ORYSJ Late embryogenesis abundant protein 17 Zjn_sc00004.1.g08640.1.sm.mk Inf 9.7227 Q96273 LEA18_ARATH Late embryogenesis abundant protein 18 Zjn_sc00027.1.g03080.1.am.mkhc 4.2847 4.8089 Q42376 LEA3_MAIZE Late embryogenesis abundant protein, group 3 Zjn_sc00012.1.g02810.1.sm.mkhc Inf 8.9382 Q42376 LEA3_MAIZE Late embryogenesis abundant protein, group 3 Zjn_sc00081.1.g00290.1.sm.mk 6.5069 3.7991 Q9LJ97 LEA31_ARATH Late embryogenesis abundant protein 31 Zjn_sc00003.1.g11730.1.am.mk NS Inf P09444 LEA34_GOSHI Late embryogenesis abundant protein D-34 Zjn_sc00108.1.g00280.1.sm.mk Inf 4.7263 P09444 LEA34_GOSHI Late embryogenesis abundant protein D-34 Zjn_sc00023.1.g01980.1.am.mk −2.0172 NS F4KFM8 LEA65_ARATH Late embryogenesis abundant protein At5g17165 Zjn_sc00004.1.g08970.1.am.mk −1.2806 NS F4KFM8 LEA65_ARATH Late embryogenesis abundant protein At5g17165 * log2FoldChange, positive value indicates up-regulation after cold acclimation, negative value indicates down-regulation after cold acclimation, NS indicates non-significant, Inf indicates infinite value. Table 3.
List of Late embryogenesis abundant protein (LEA) genes that were identified as differentially expressed after cold acclimation in Z. japonica, which were also differentially expressed in protein abundance in a previous study[16].
Figures
(5)
Tables
(3)