-

Figure 1.
Effects on the growth and Phe accumulation under different Phenanthrene concentration treatments in rice. WT seedlings, aged 14 d, were hydroponically grown in Hoagland's solution (pH 5.5) with varying concentrations of Phenanthrene (Phe) supplementation for a duration of 8 d. (a) The growth of WT seedlings was evaluated to observe the phenotypes resulting from different concentrations of Phe. The scale bar is 20 cm. (b) Biomass of roots and shoots as described in (a). Data are presented for the concentrations of phenanthrene in roots and shoots (c). Means ± SE values are reported (n = 6), and significant differences are denoted by different letters on the histograms (p < 0.05, one-way ANOVA).
-
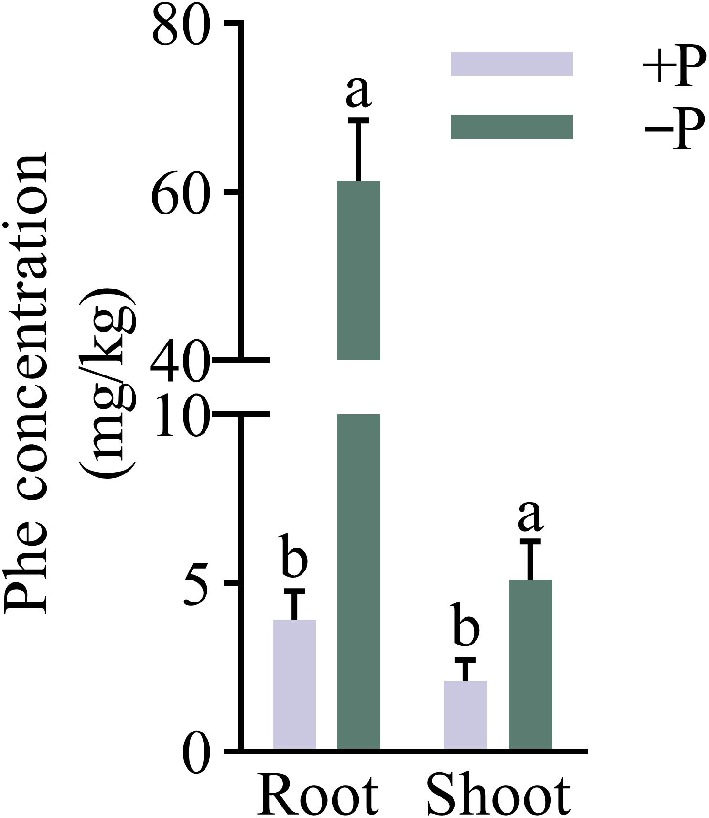
Figure 2.
The impact of different phosphorus treatments on Phe accumulation in WT. Under Pi-sufficient (+P [200 μM Pi]) and Pi-deficient (−P [10 μM Pi]) conditions, the wild-type (WT) seedlings were grown hydroponically with 1.5 mg/L phenanthrene for 35 d. Data are presented for the concentrations of phenanthrene in roots and shoots of WT. Means ± SE values are reported (n = 4), and significant differences are denoted by different letters on the histograms (p < 0.05, one-way ANOVA).
-
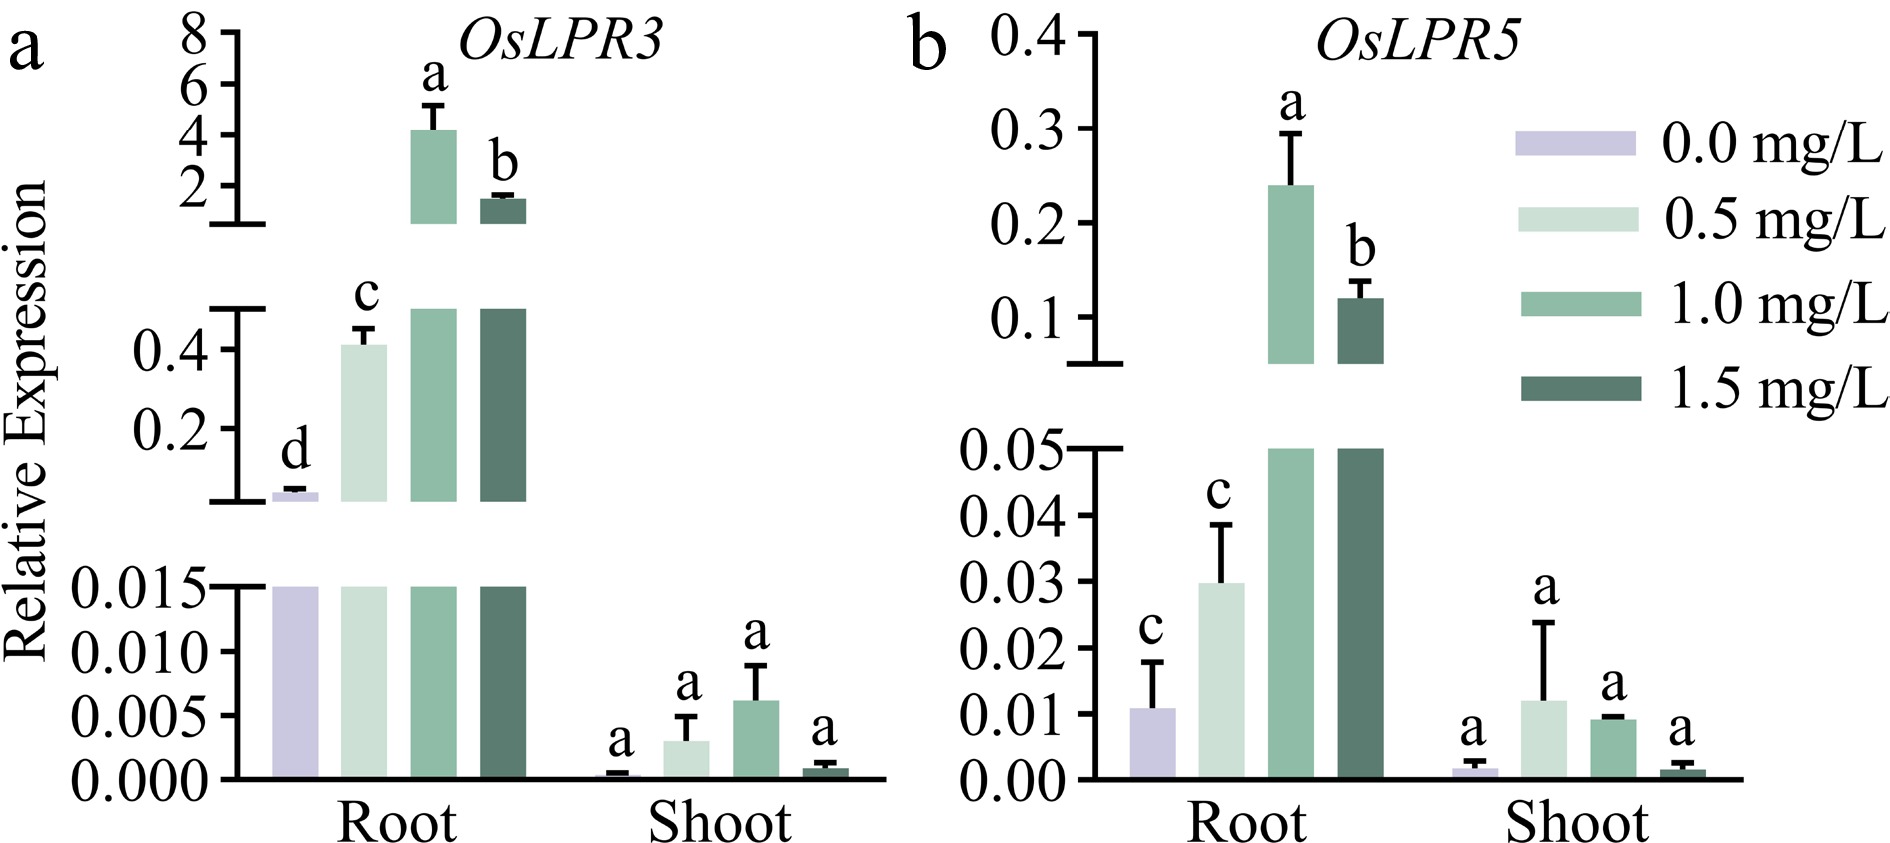
Figure 3.
Relative expression levels of (a) OsLPR3 and (b) OsLPR5 in response to phenanthrene in the roots and shoots of rice. The WT seedlings were subjected to phenanthrene treatments at different concentrations (0, 0.5, 1, and 1.5 mg/L) for a duration of 9 d. Means ± SE values are reported (n = 4), and significant differences are denoted by different letters on the histograms (p < 0.05, one-way ANOVA).
-
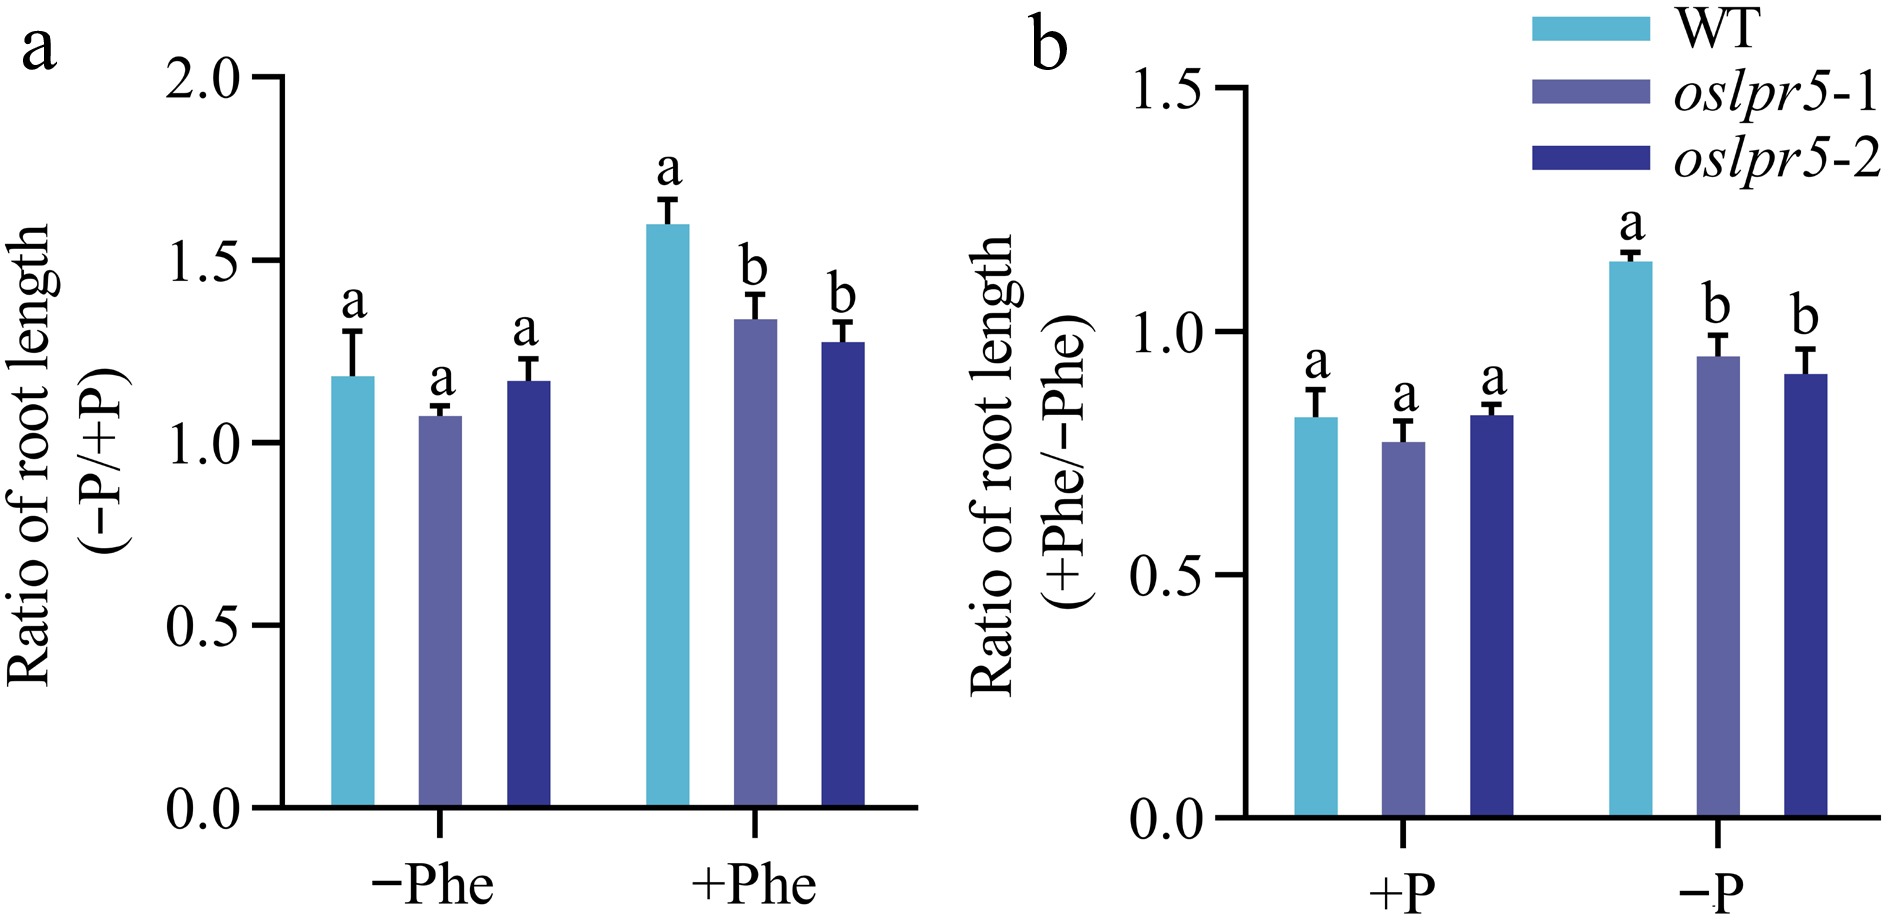
Figure 4.
Effects of mutation in OsLPR5 on the phenotype, and length of root during growth under different regimes of Phe and Pi. The 14-day-old seedlings, including the WT and OsLPR5 knockout mutants (oslpr5-1 and oslpr5-2), were grown hydroponically for a period of 35 d. The growth conditions included supplementation with −Phe (0 mg/L) and +Phe (1.5 mg/L), and the plants were subjected to both +P (200 μM Pi) and −P (10 μM Pi) conditions. (a) The phenotype of the seedlings. Scale bar = 10 cm. Data are presented for (b) Ratio (−P/+P) and (c) Ratio (+Phe/−Phe) of root length, respectively. Means ± SE values are reported (n = 4), and significant differences are denoted by different letters on the histograms (p < 0.05, one-way ANOVA).
-
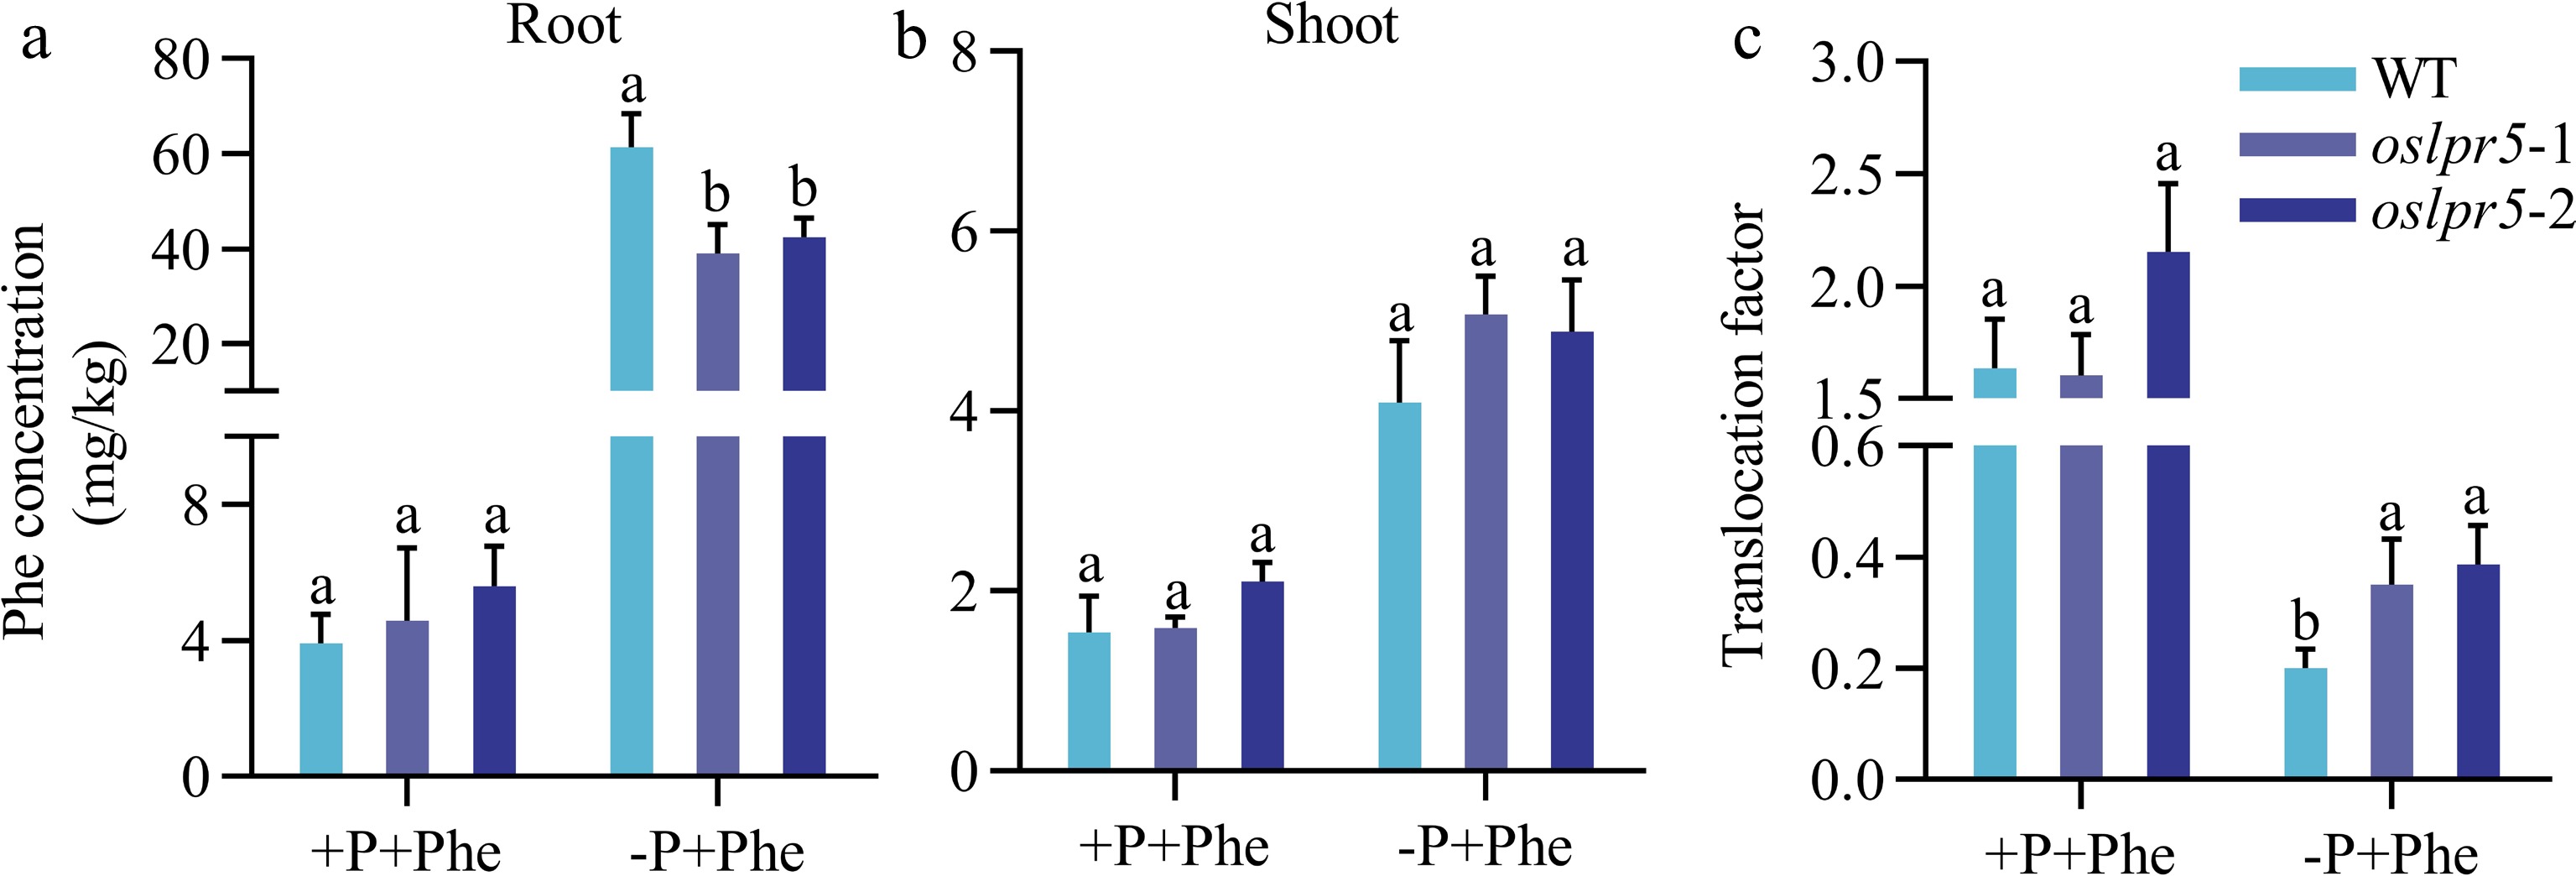
Figure 5.
The mutation in OsLPR5 has an impact on the acquisition and translocation of Phenanthrene (Phe) under different phosphorus (Pi) regimes. The 14-day-old WT and oslpr5 seedlings were grown following the instructions provided in the legend of Fig. 4. Data are presented for the concentrations of phenanthrene in (a) roots and (b) shoots and (c) translocation factor. Means ± SE values are reported (n = 4), and significant differences are denoted by different letters on the histograms (p < 0.05, one-way ANOVA).
-

Figure 6.
Concentrations of phenanthrene of different tissues in wild-type and oslpr5 in pot experiments grown to maturity. The 21-day-old seedlings, both the WT and oslpr5, were grown in potting soil supplemented with 60 mg Phe/kg soil for a period of 20 weeks. Phenanthrene concentrations of wild-type and oslpr5 were measured and data are presented for (a) culms, (b) flag leaf, and (c) seeds. Means ± SE values are reported (n = 4), and significant differences are denoted by different letters on the histograms (p < 0.05, one-way ANOVA).
Figures
(6)
Tables
(0)