-
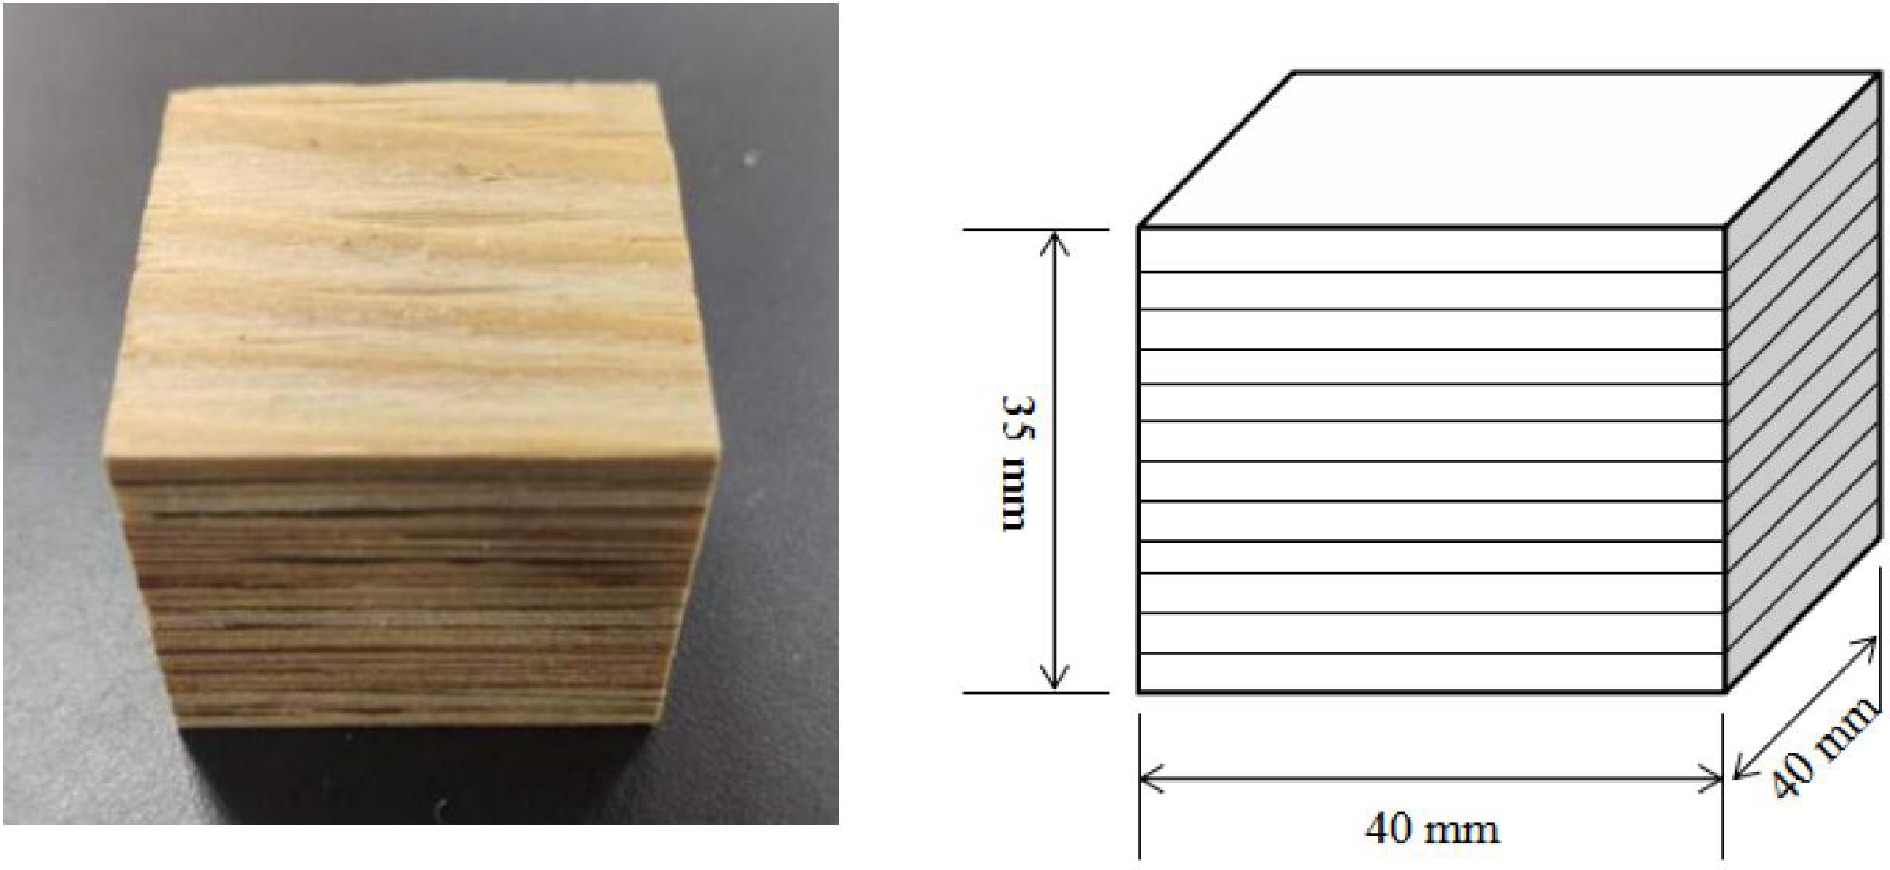
Figure 1.
Experimental laminated veneer lumber samples (40 mm × 40 mm × 35 mm). Left, physical picture; right, schematic diagram.
-
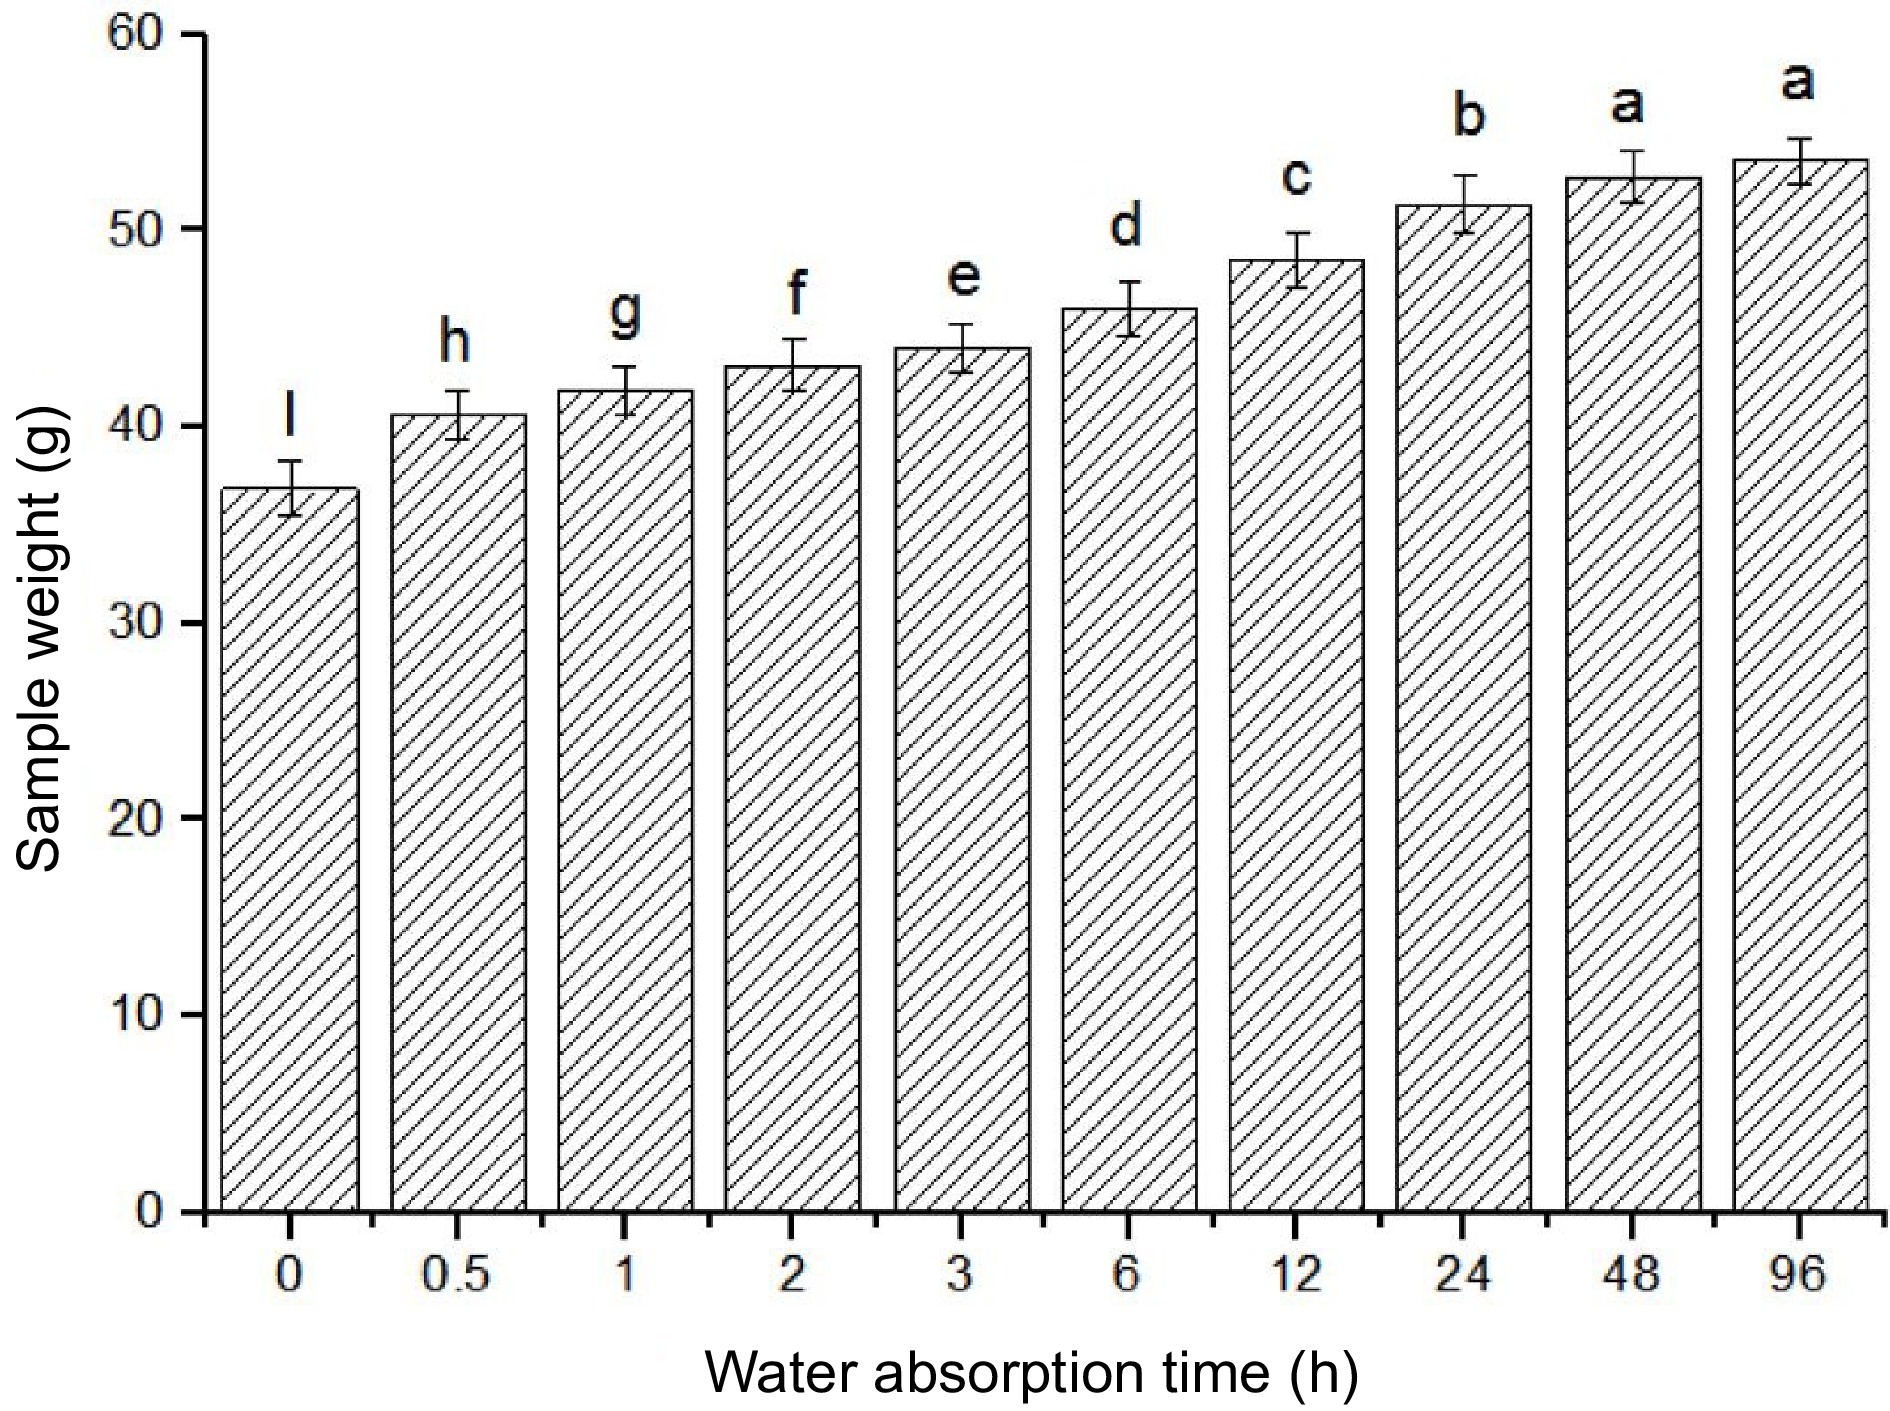
Figure 2.
Effect of water absorption time on sample weight. Note: Means with standard error are indicated, different letters represent significant differences (p < 0.05) in each treatment (n = 10).
-
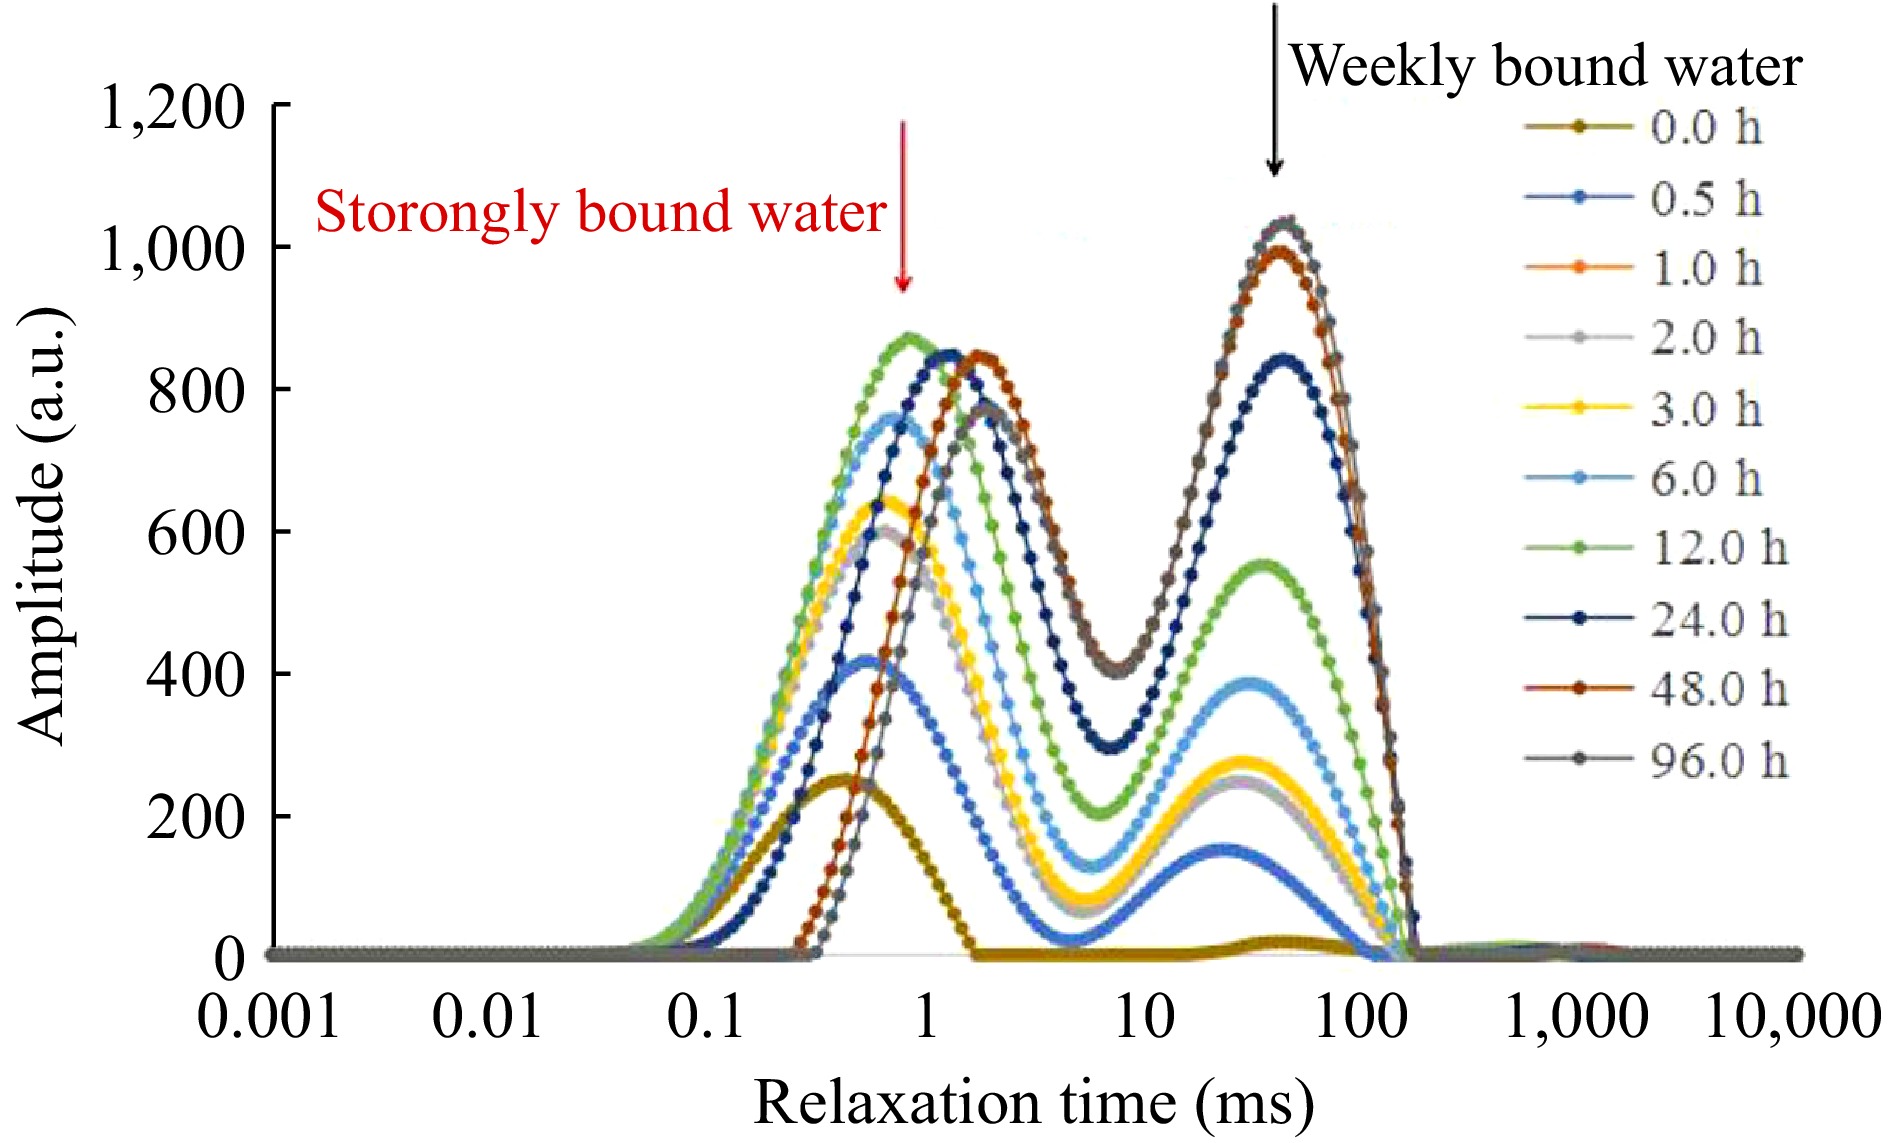
Figure 3.
Changes in T2 relaxation spectra during water absorption.
-
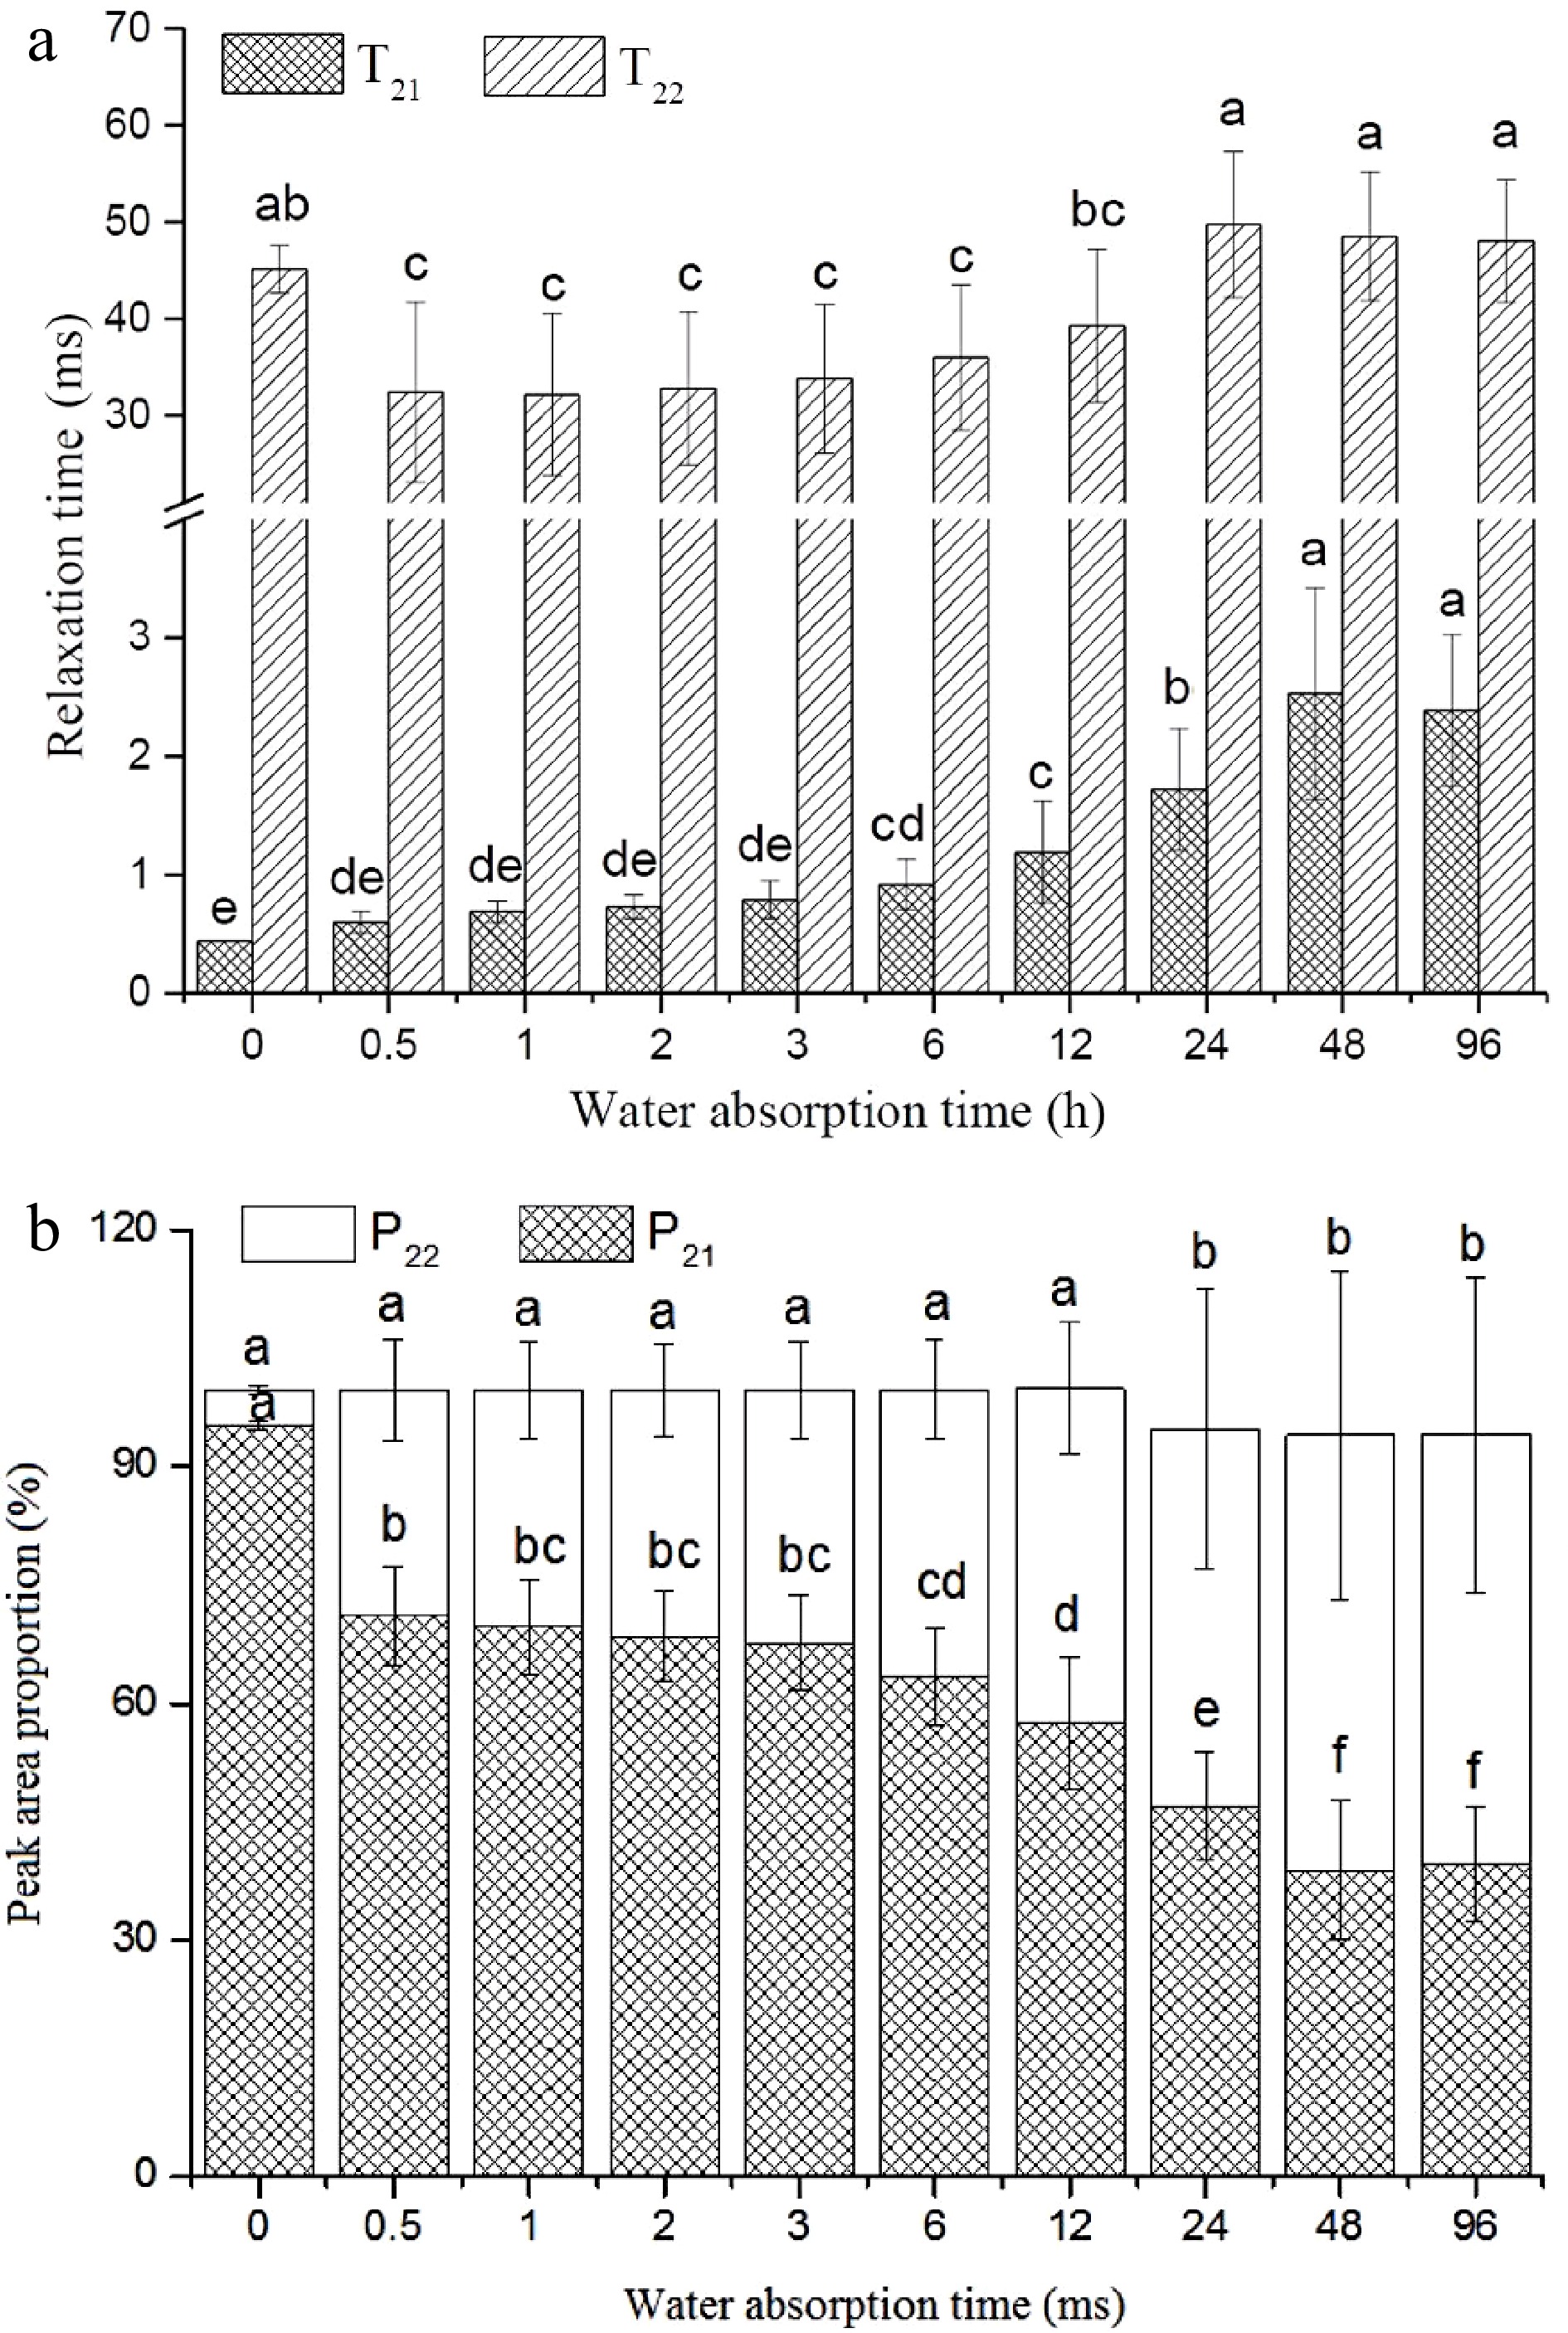
Figure 4.
Relaxation times and peak area ratios of water in laminated veneer lumber sample after water absorption. Note: Means with standard error are indicated, different letters represent significant differences (p < 0.05) in each treatment (n = 10).
-
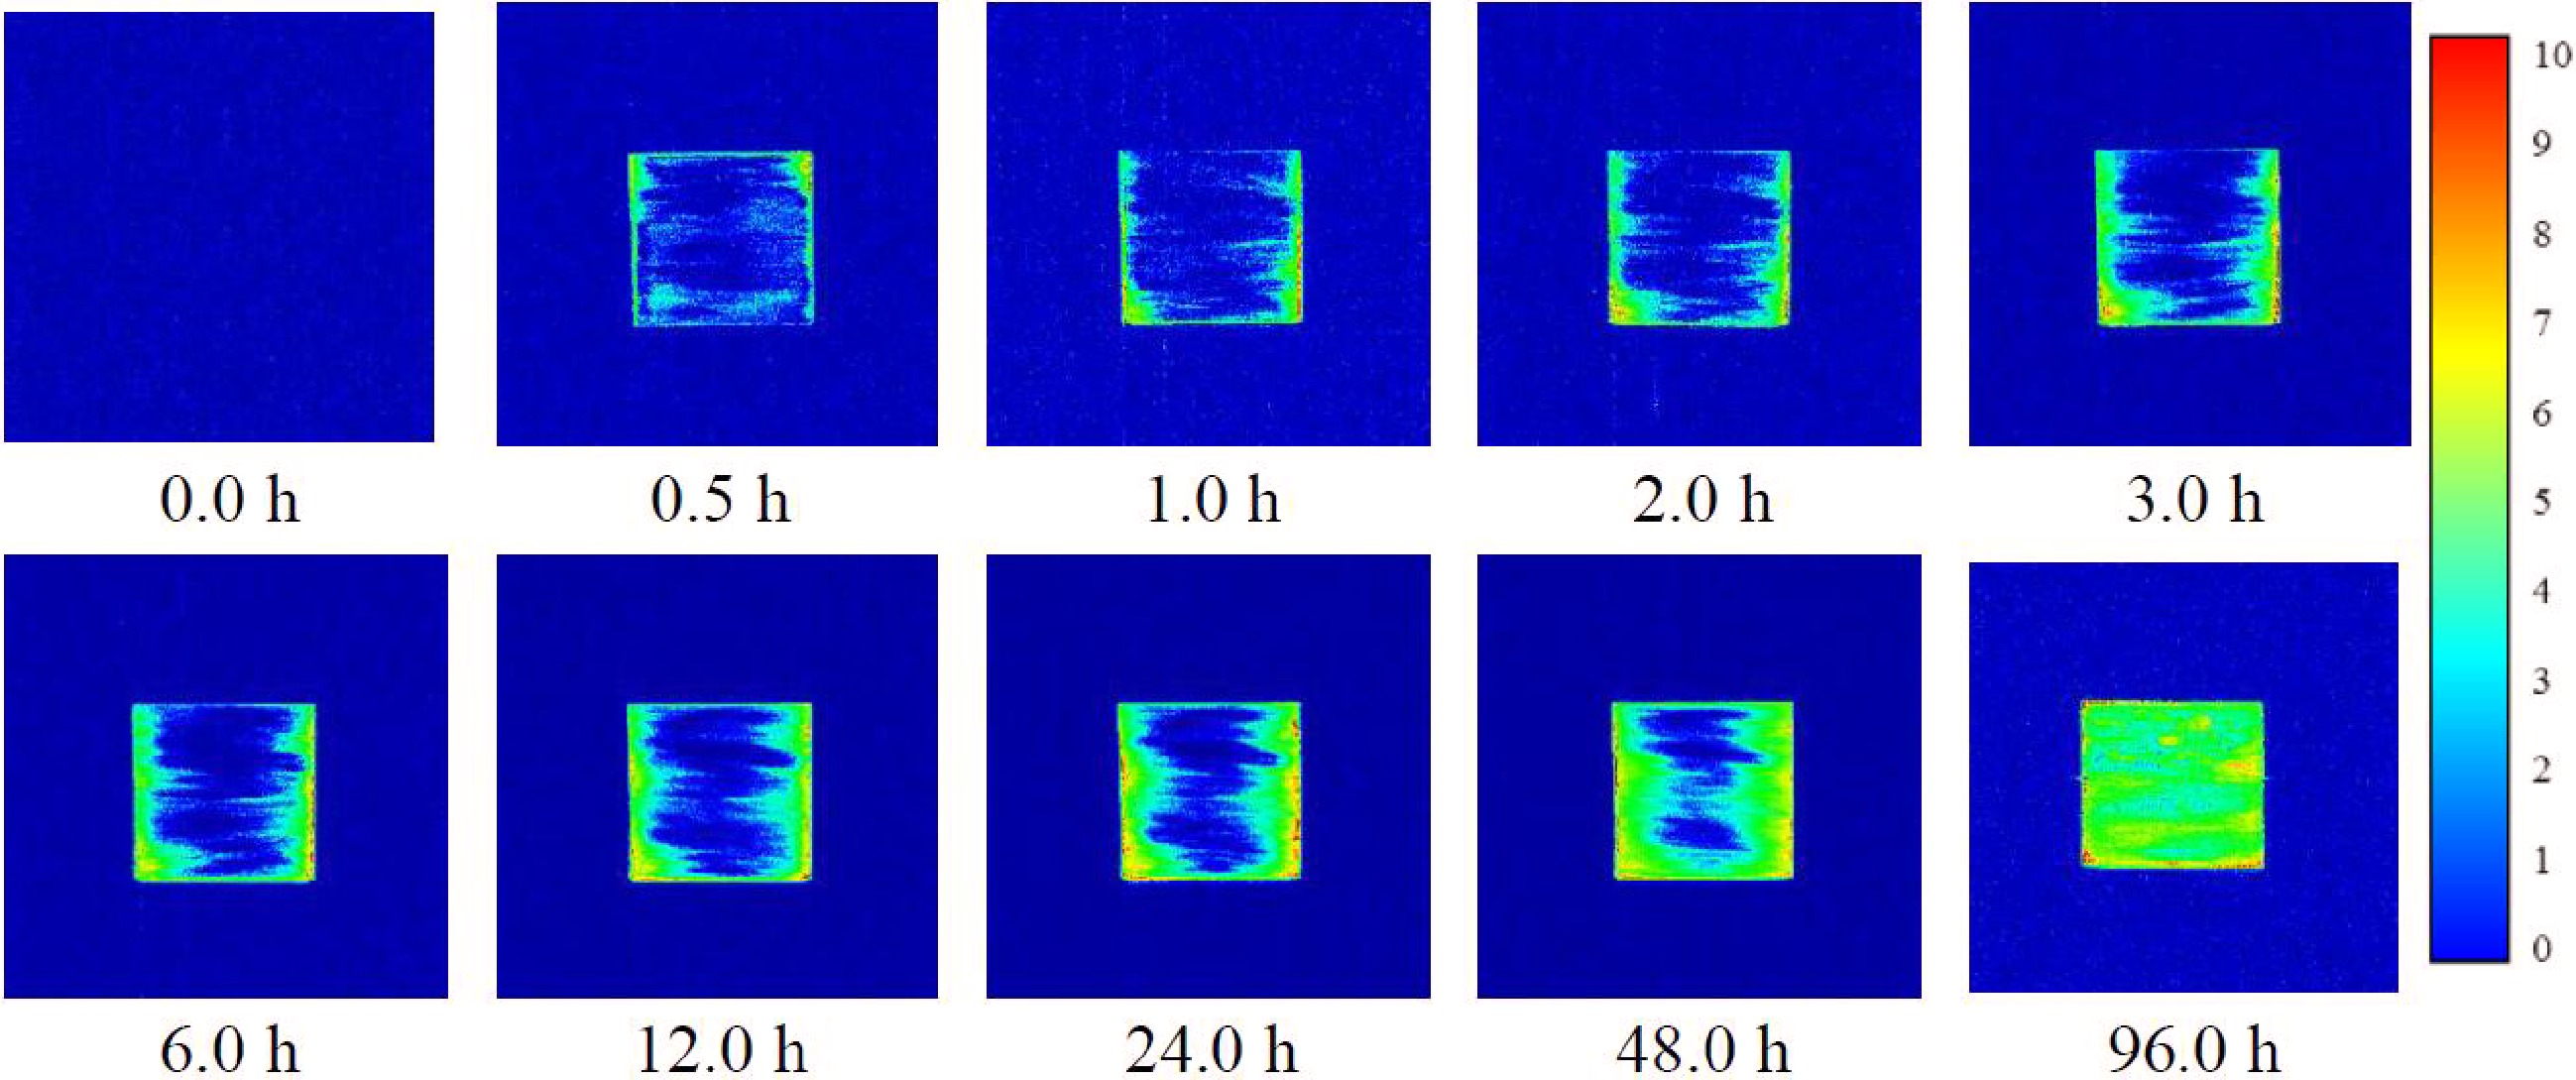
Figure 5.
T2-weighted MRI images of laminated veneer lumber sample of different water absorption time.
-
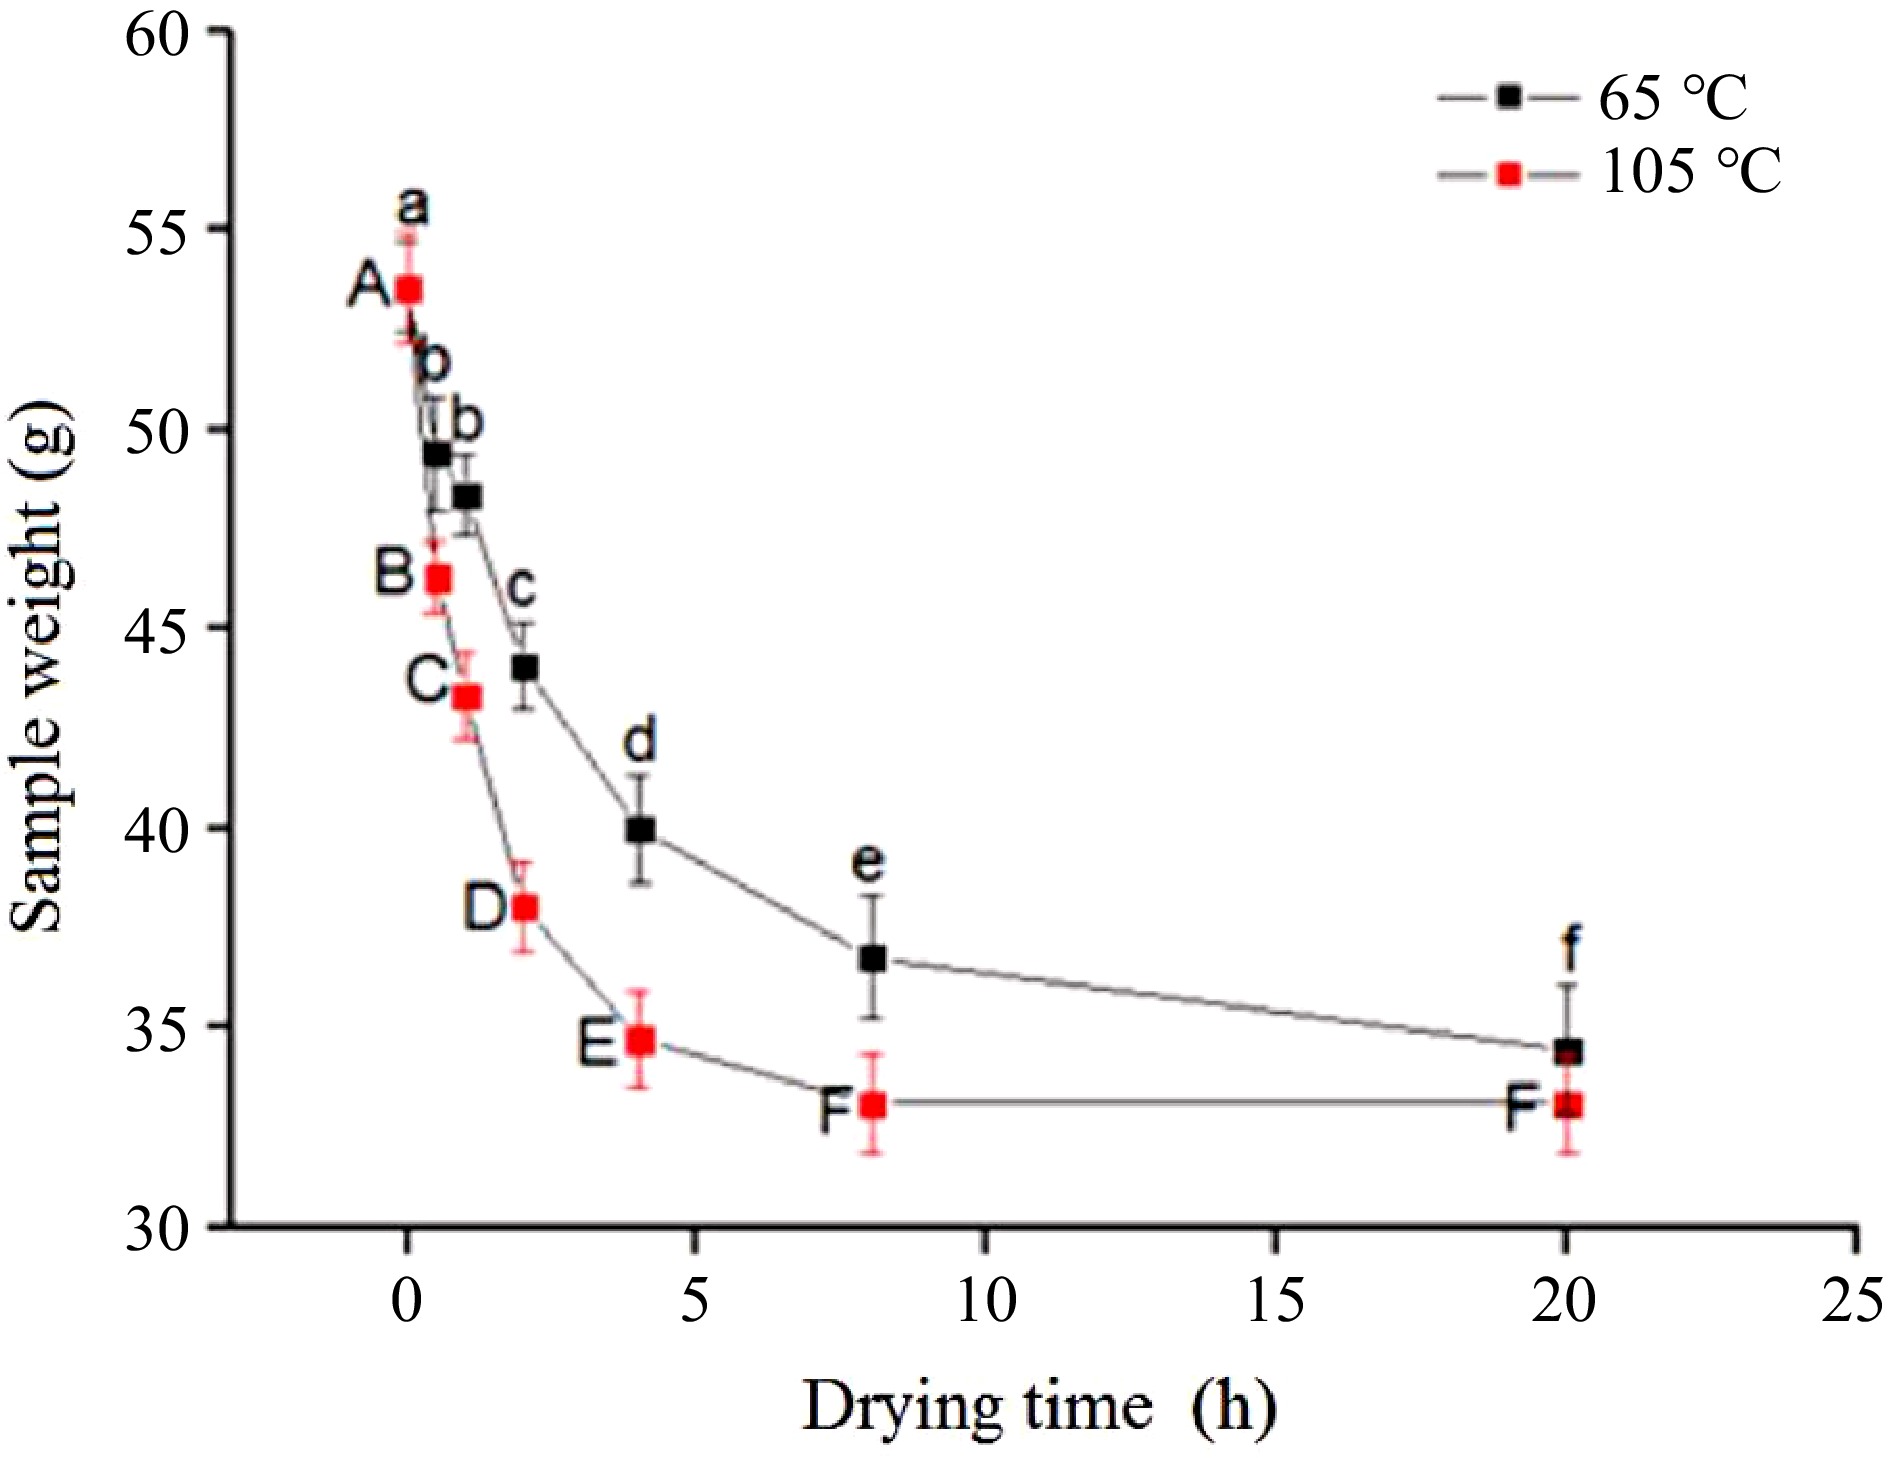
Figure 6.
Changes of weight in laminated veneer lumber sample after water absorption. Note: Means with standard error are indicated, different letters represent significant differences (p < 0.05) in each treatment (n = 10).
-
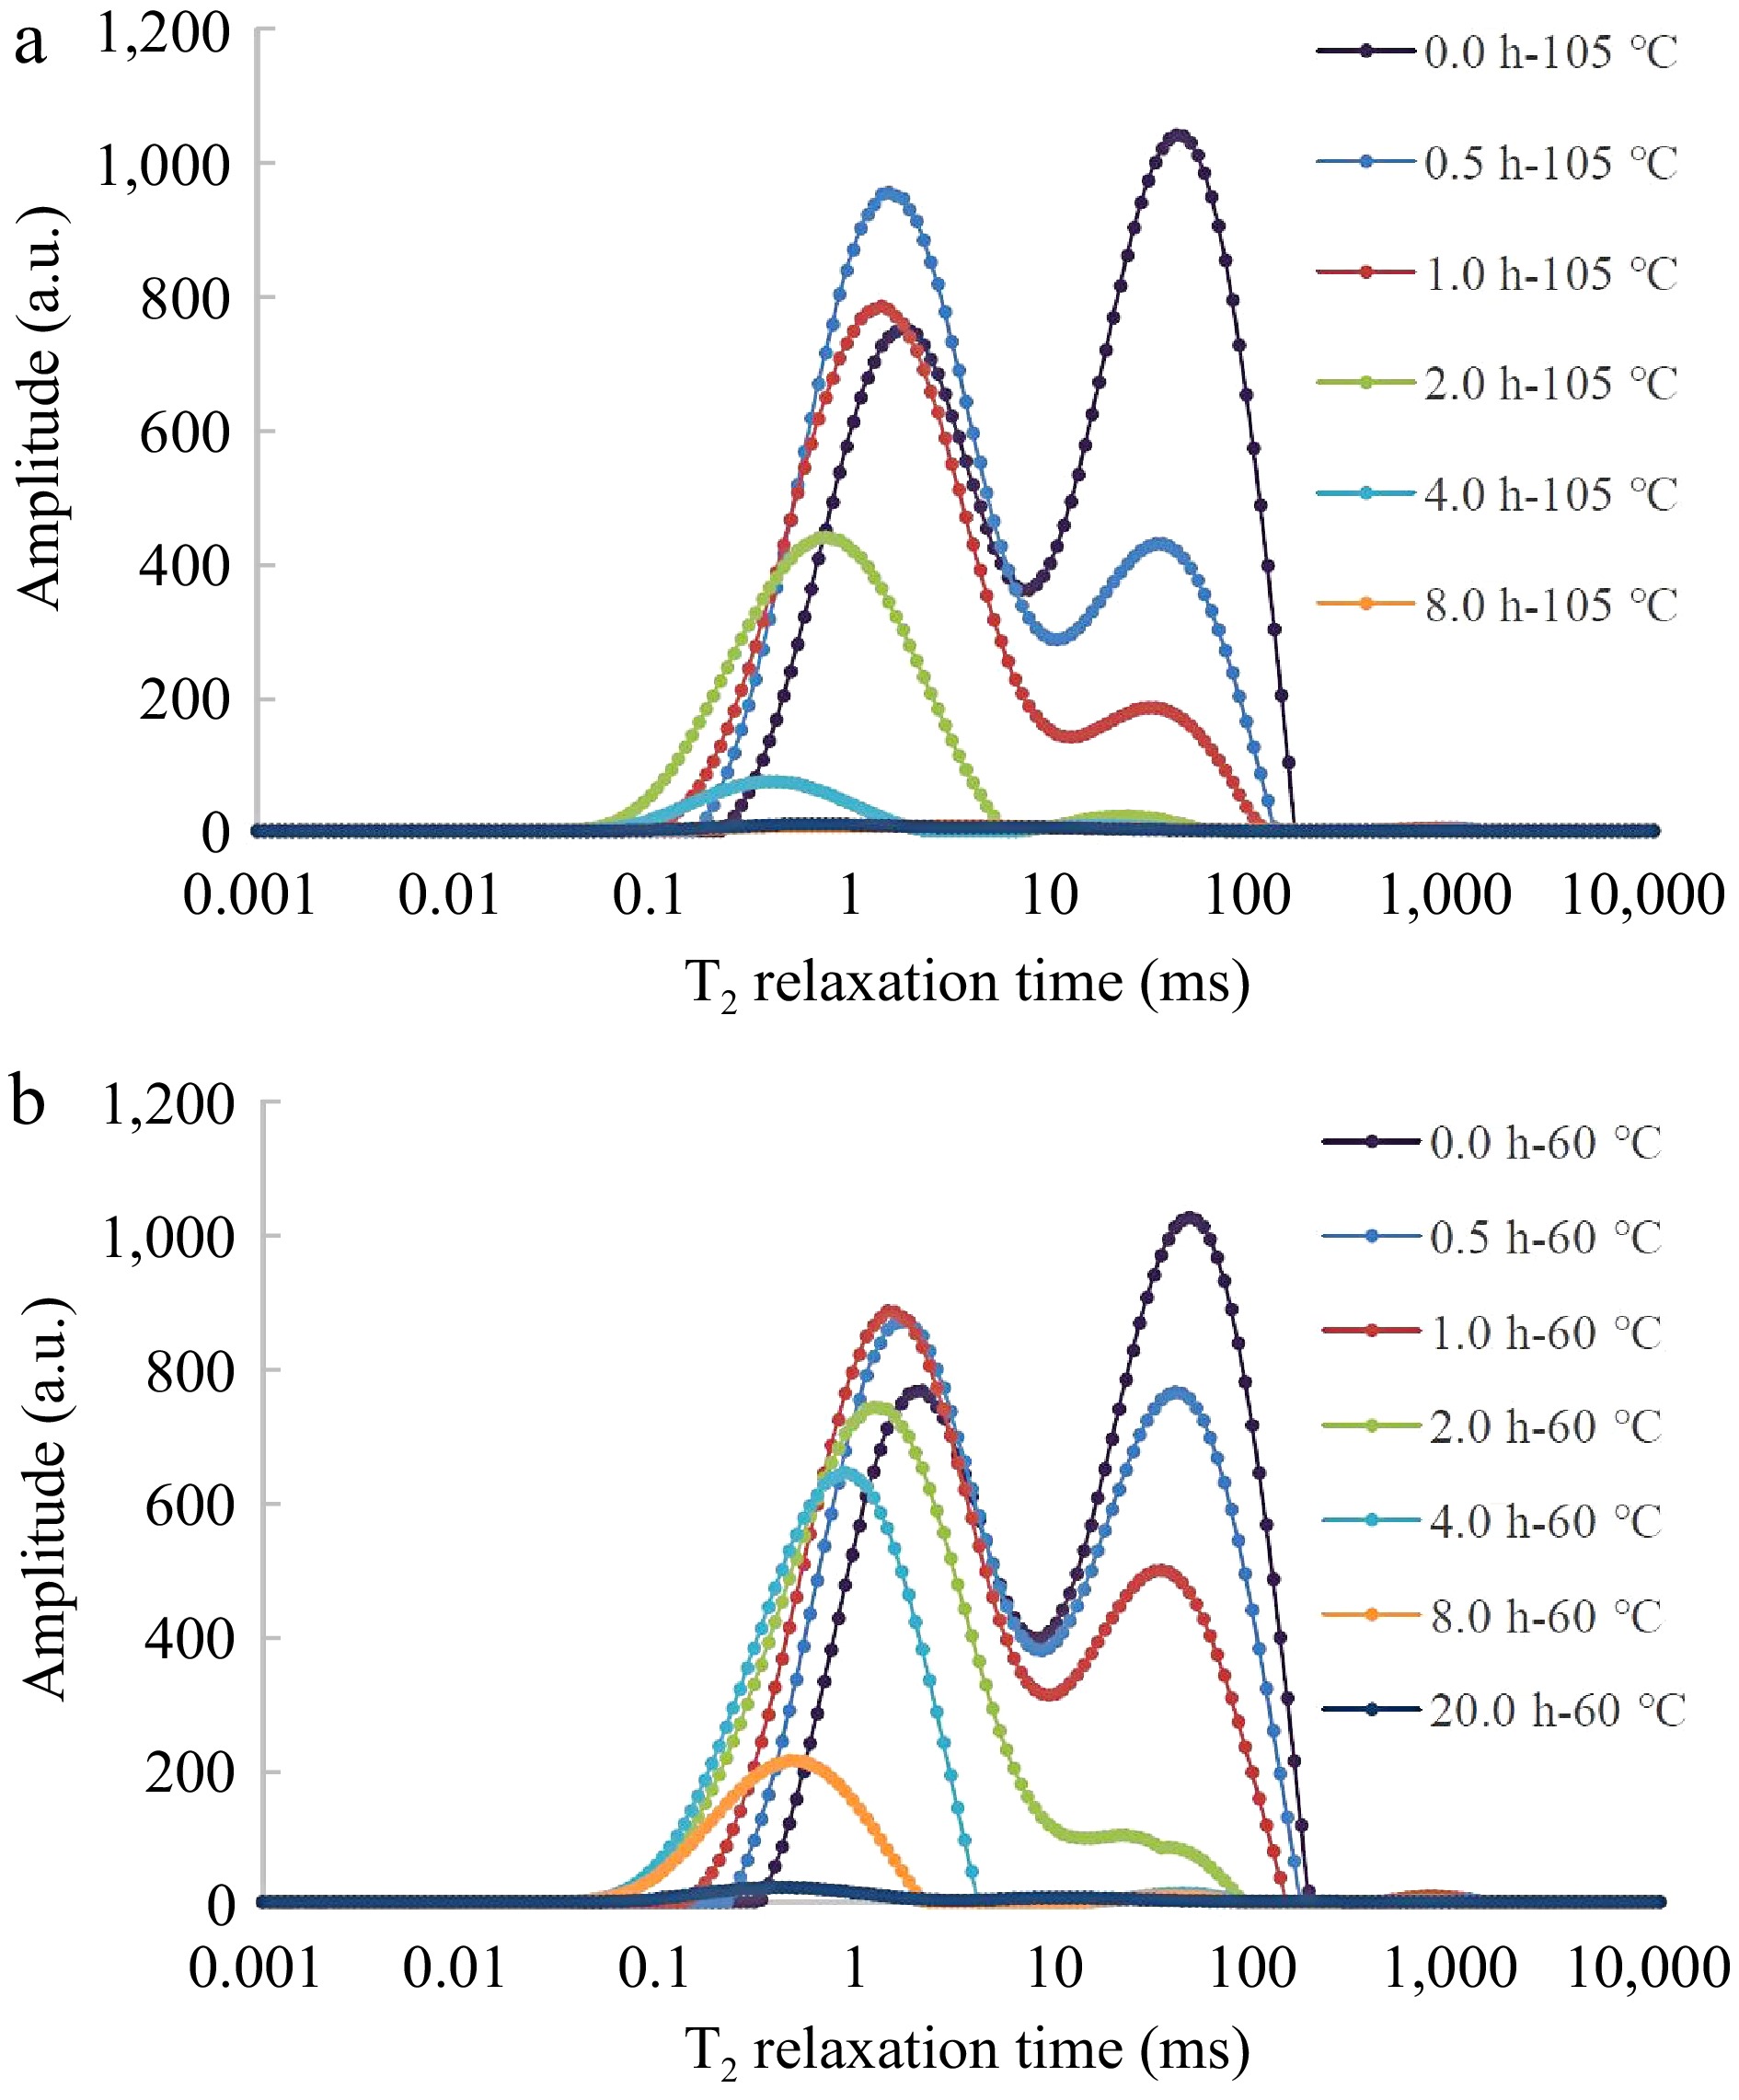
Figure 7.
Changes in T2 relaxation spectra during drying process. (a) Dried at 105 °C, (b) dried at 60 °C.
-
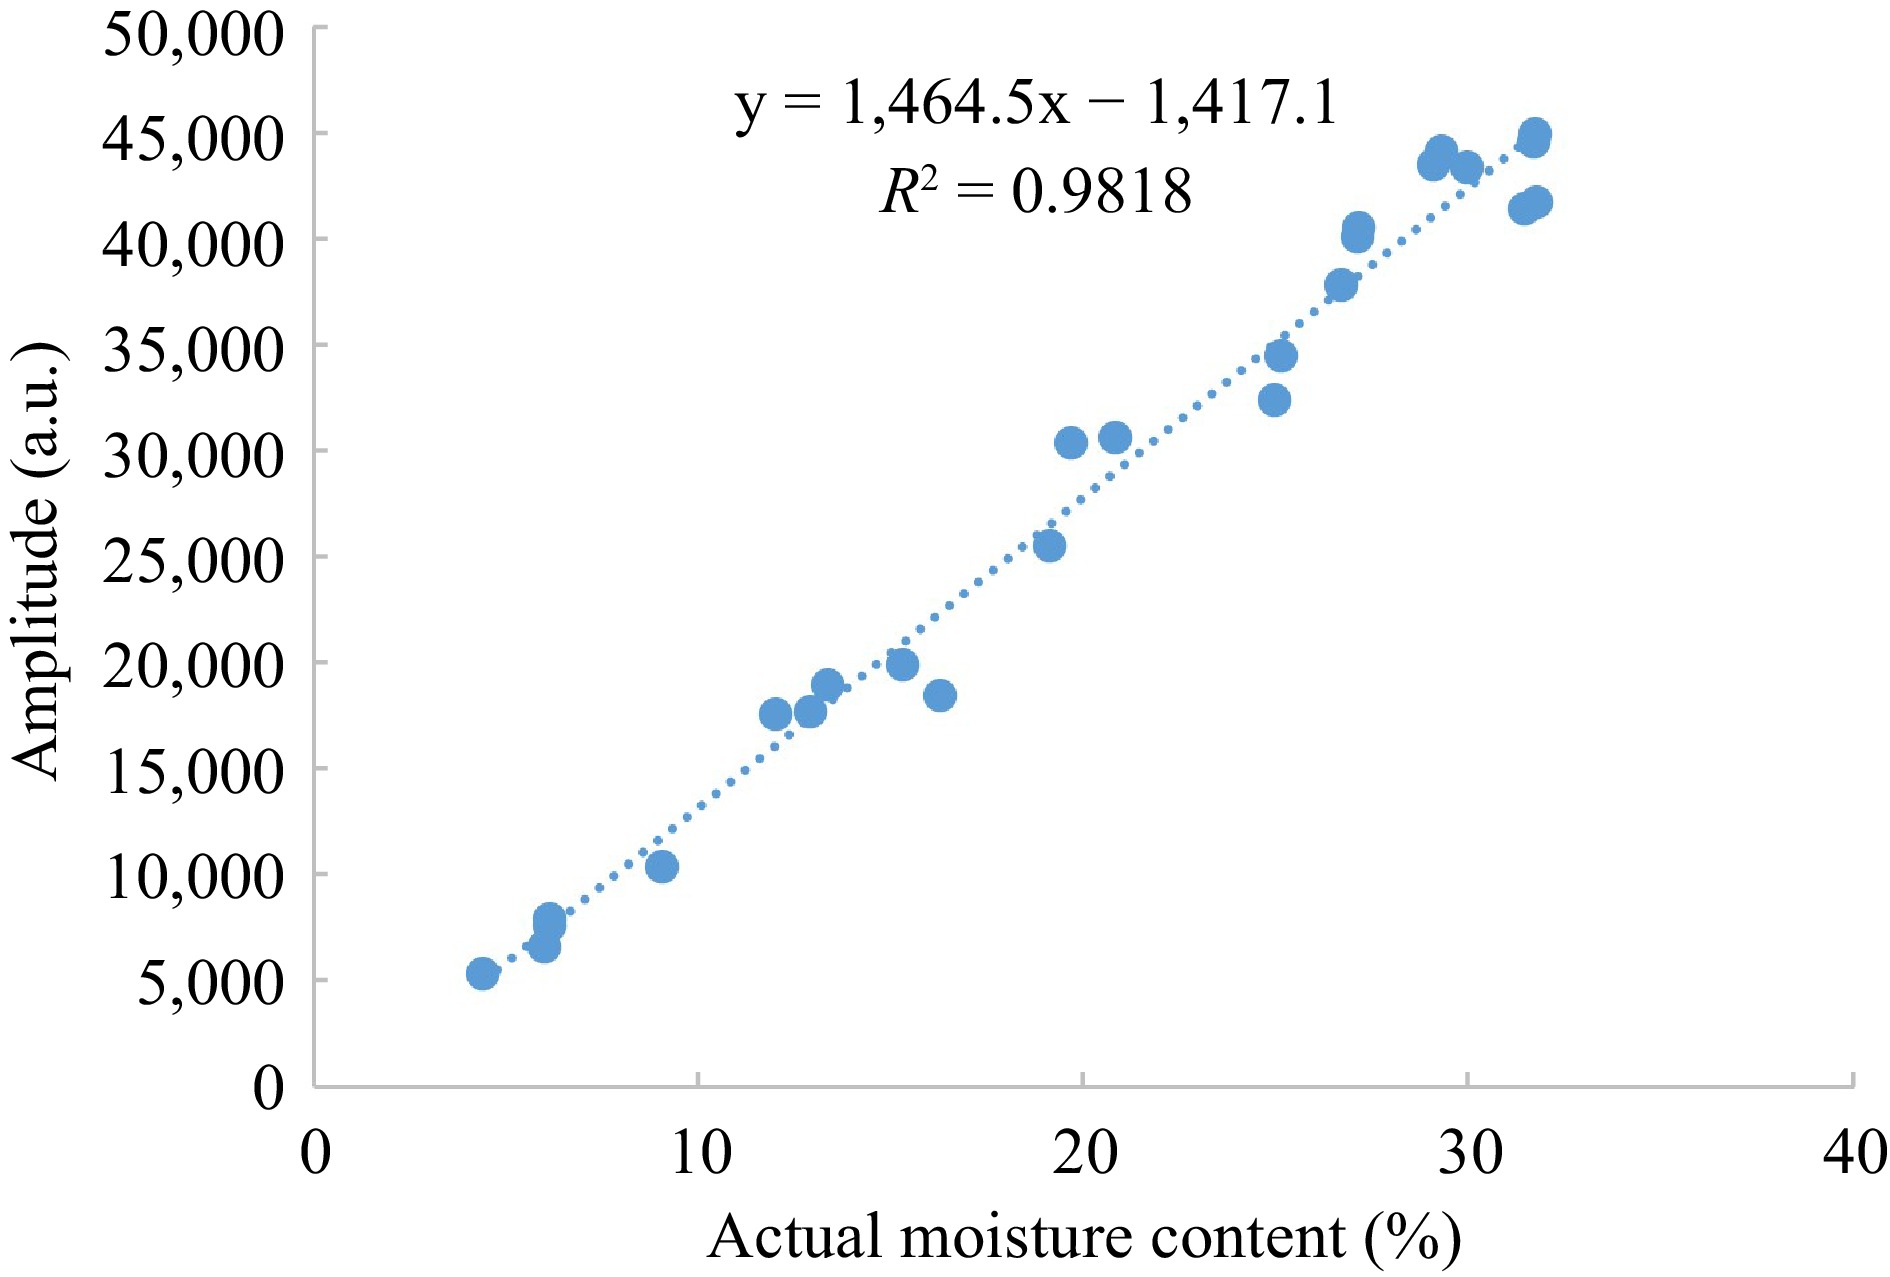
Figure 8.
Standard curves of water quality and nuclear magnetic signal quantity.
-
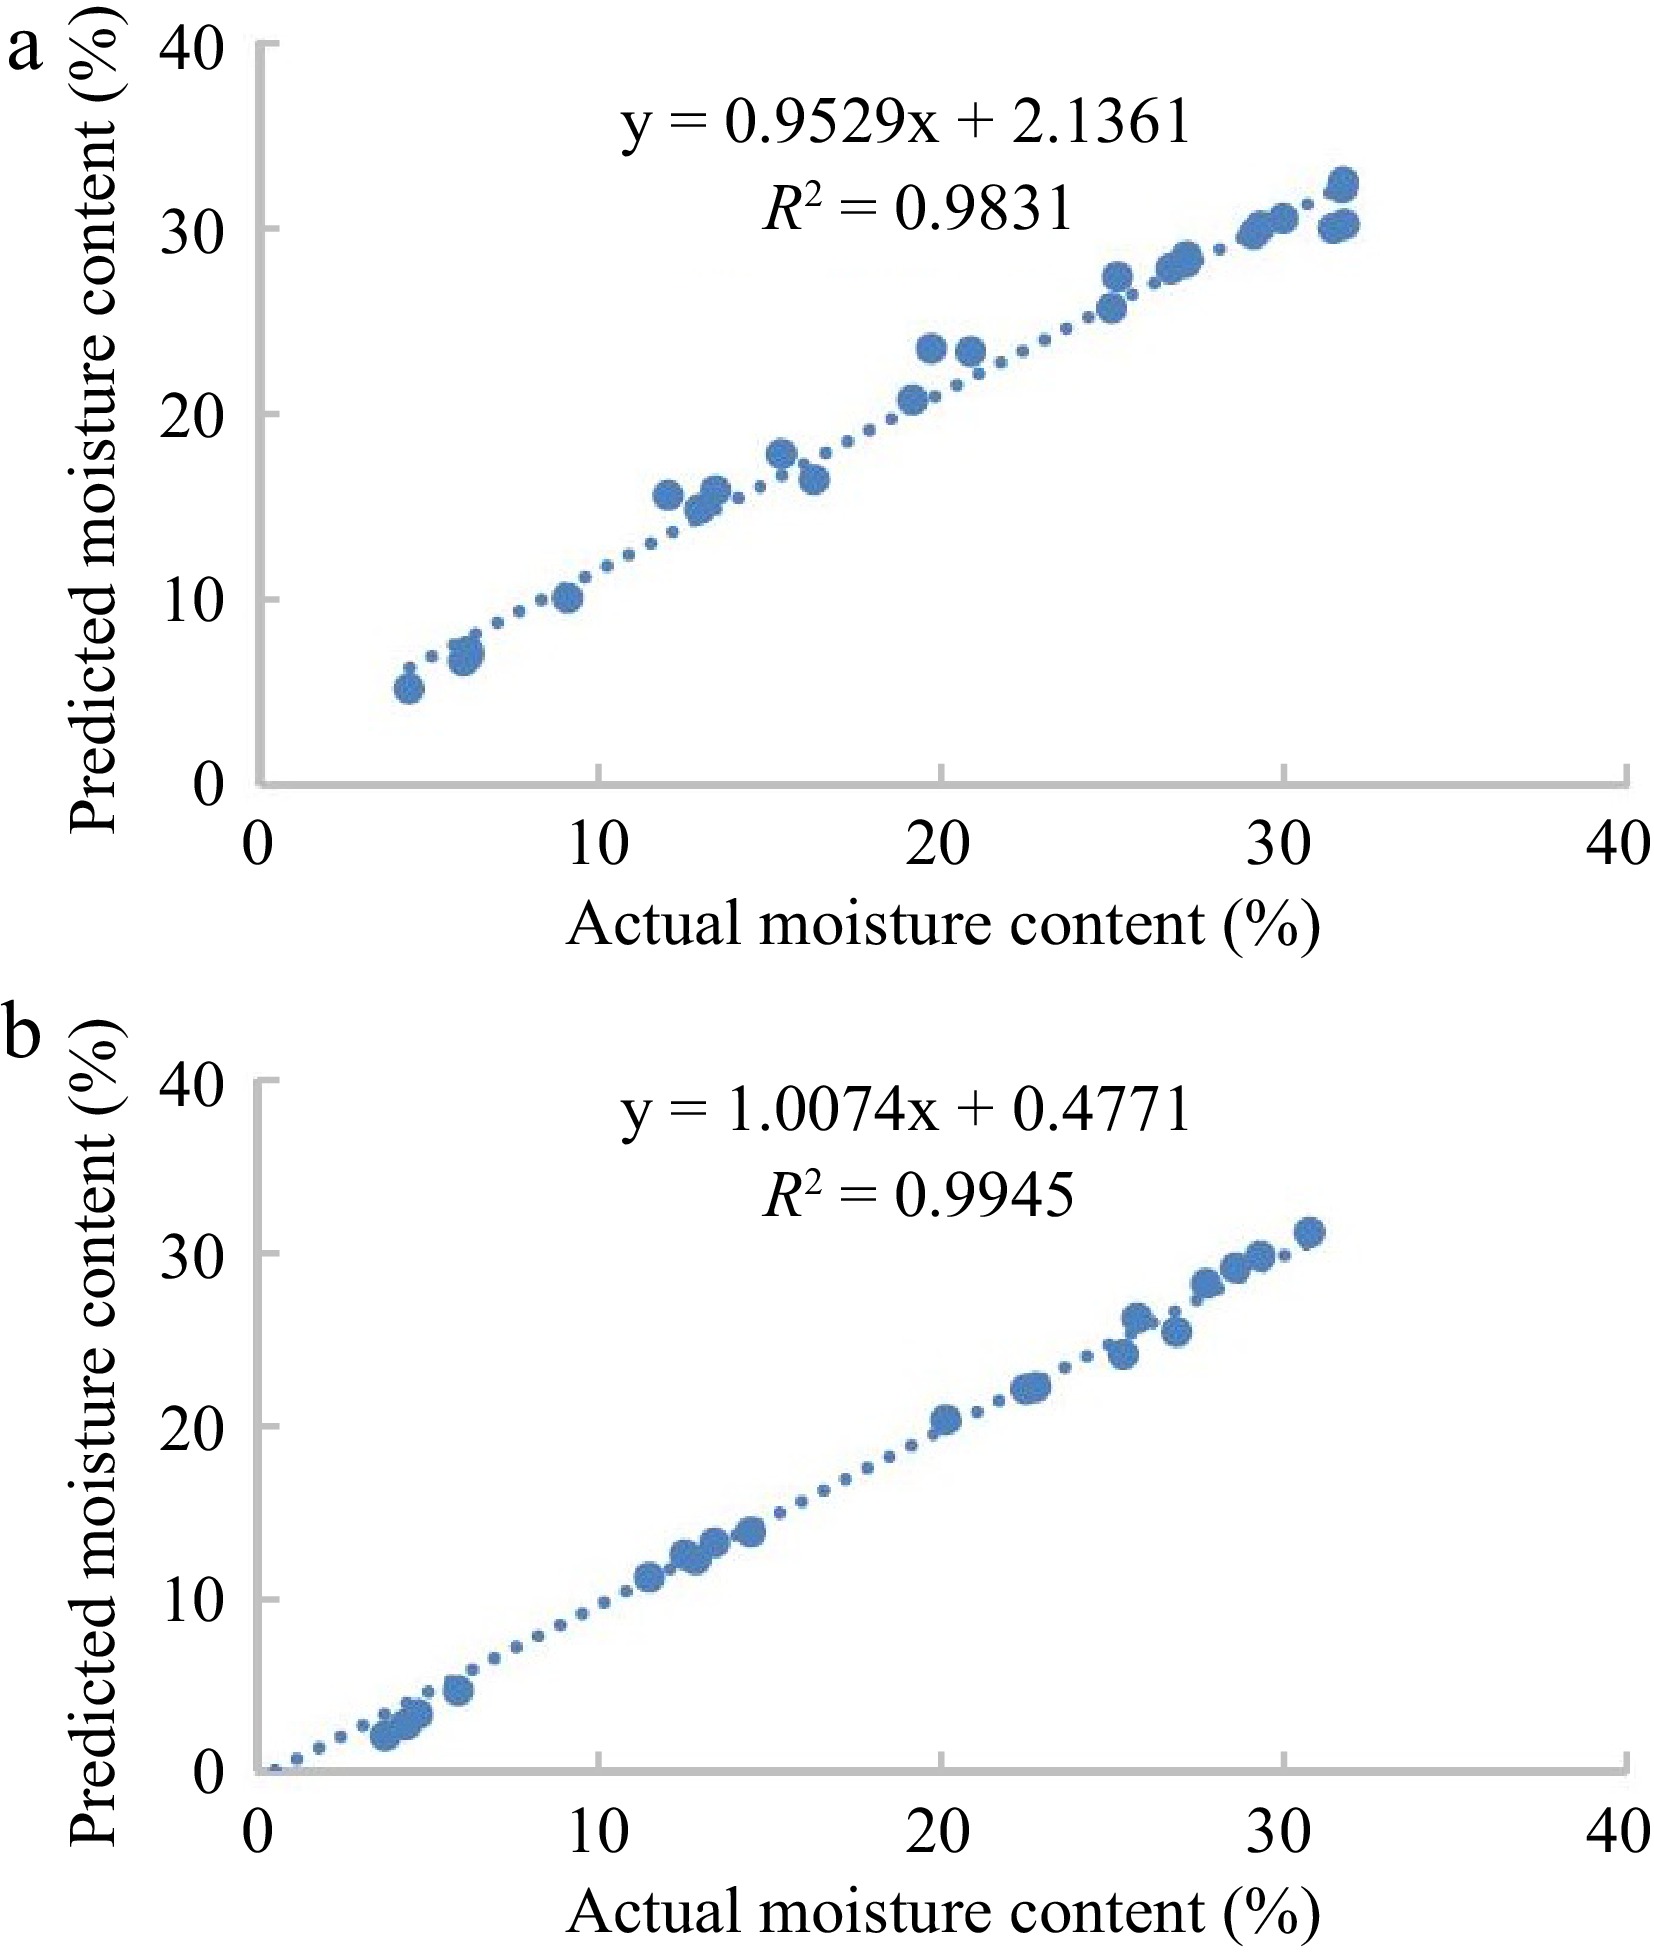
Figure 9.
Comparison of water content by the nuclear magnetic predicted method and weighing method. (a) Dried at 105 °C, (b) dried at 60 °C.
-
Water
absorption
timeA21 A22 A2 Control 160.41 ± 11.39f 7.48 ± 1.00f 168.37 ± 11.99e 0.5 318.31 ± 42.43e 135.93 ± 60.31e 455.56 ± 100.71d 1 381.52 ± 36.28d 171.29 ± 65.32de 554.56 ± 98.67d 2 441.11 ± 38.18c 209.57 ± 73.62de 652.67 ± 108.44c 3 470.18 ± 32.41bc 238.79 ± 77.29cd 711.00 ± 105.75c 6 513.33 ± 18.04ab 302.35 ± 82.23c 817.64 ± 82.08b 12 518.82 ± 68.02a 384.47 ± 81.43b 904.74 ± 28.58a 24 432.31 ± 65.19c 523.85 ± 130.30a 913.49 ± 26.70a 48 351.22 ± 81.30de 580.79 ± 120.04a 897.33 ± 21.79a 96 341.68 ± 62.32de 552.65 ± 117.83a 860.42 ± 16.26ab Different letters of superscripts in each column represent significant differences (p < 0.05) in each treatment (n = 10). Table 1.
Peak area of laminated veneer lumber sample of different water absorption time.
Figures
(9)
Tables
(1)