-
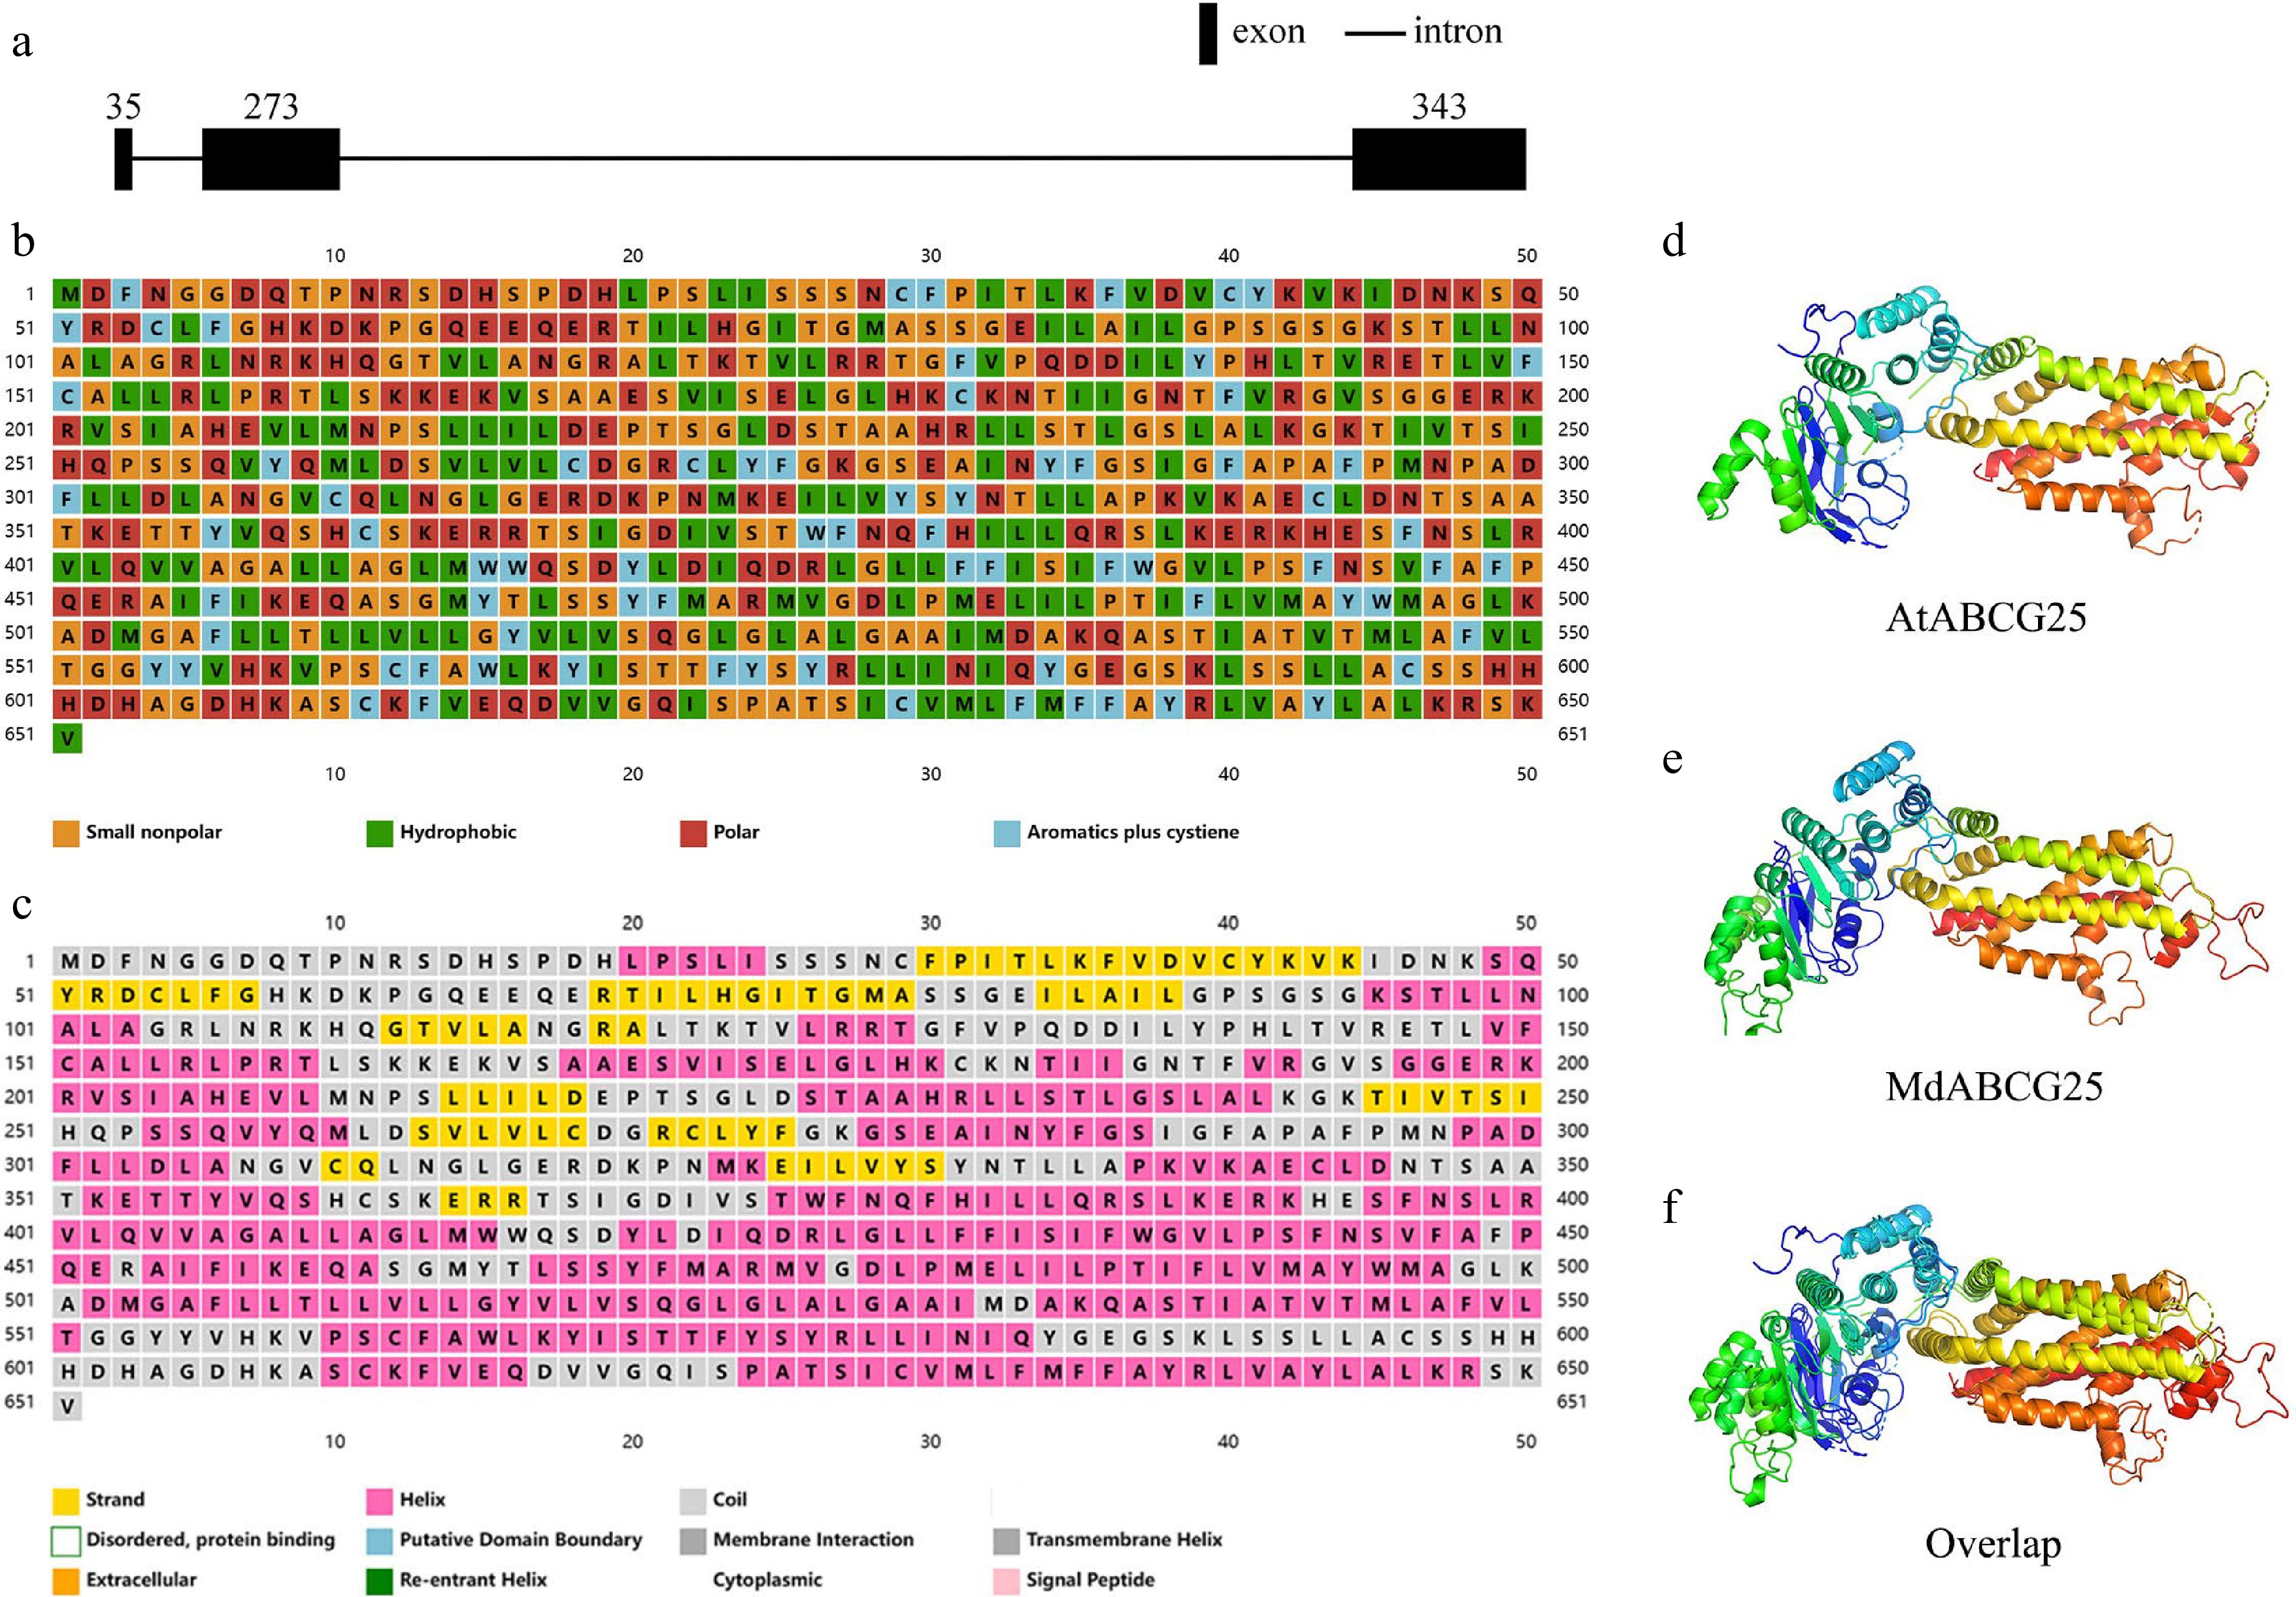
Figure 1.
Basic bioinformatic information about AtABCG25 and MdABCG25 sequence. (a) Genomic structure of MdABCG25 sequence. The black rectangles denote exons, and the black lines denote introns. (b) Properties of each amino acid of MdABCG25 protein; orange for small nonpolar, green for hydrophobic, red for polar, and blue for aromatics plus cystiene. (c) Predicted secondary structures of MdABCG25 protein, each represented by a different color; yellow for strands, pink for helices, and gray for coils. The predicted tertiary structure of (d) AtABCG25 protein, (e) MdABCG25 protein, and their (f) overlaps.
-
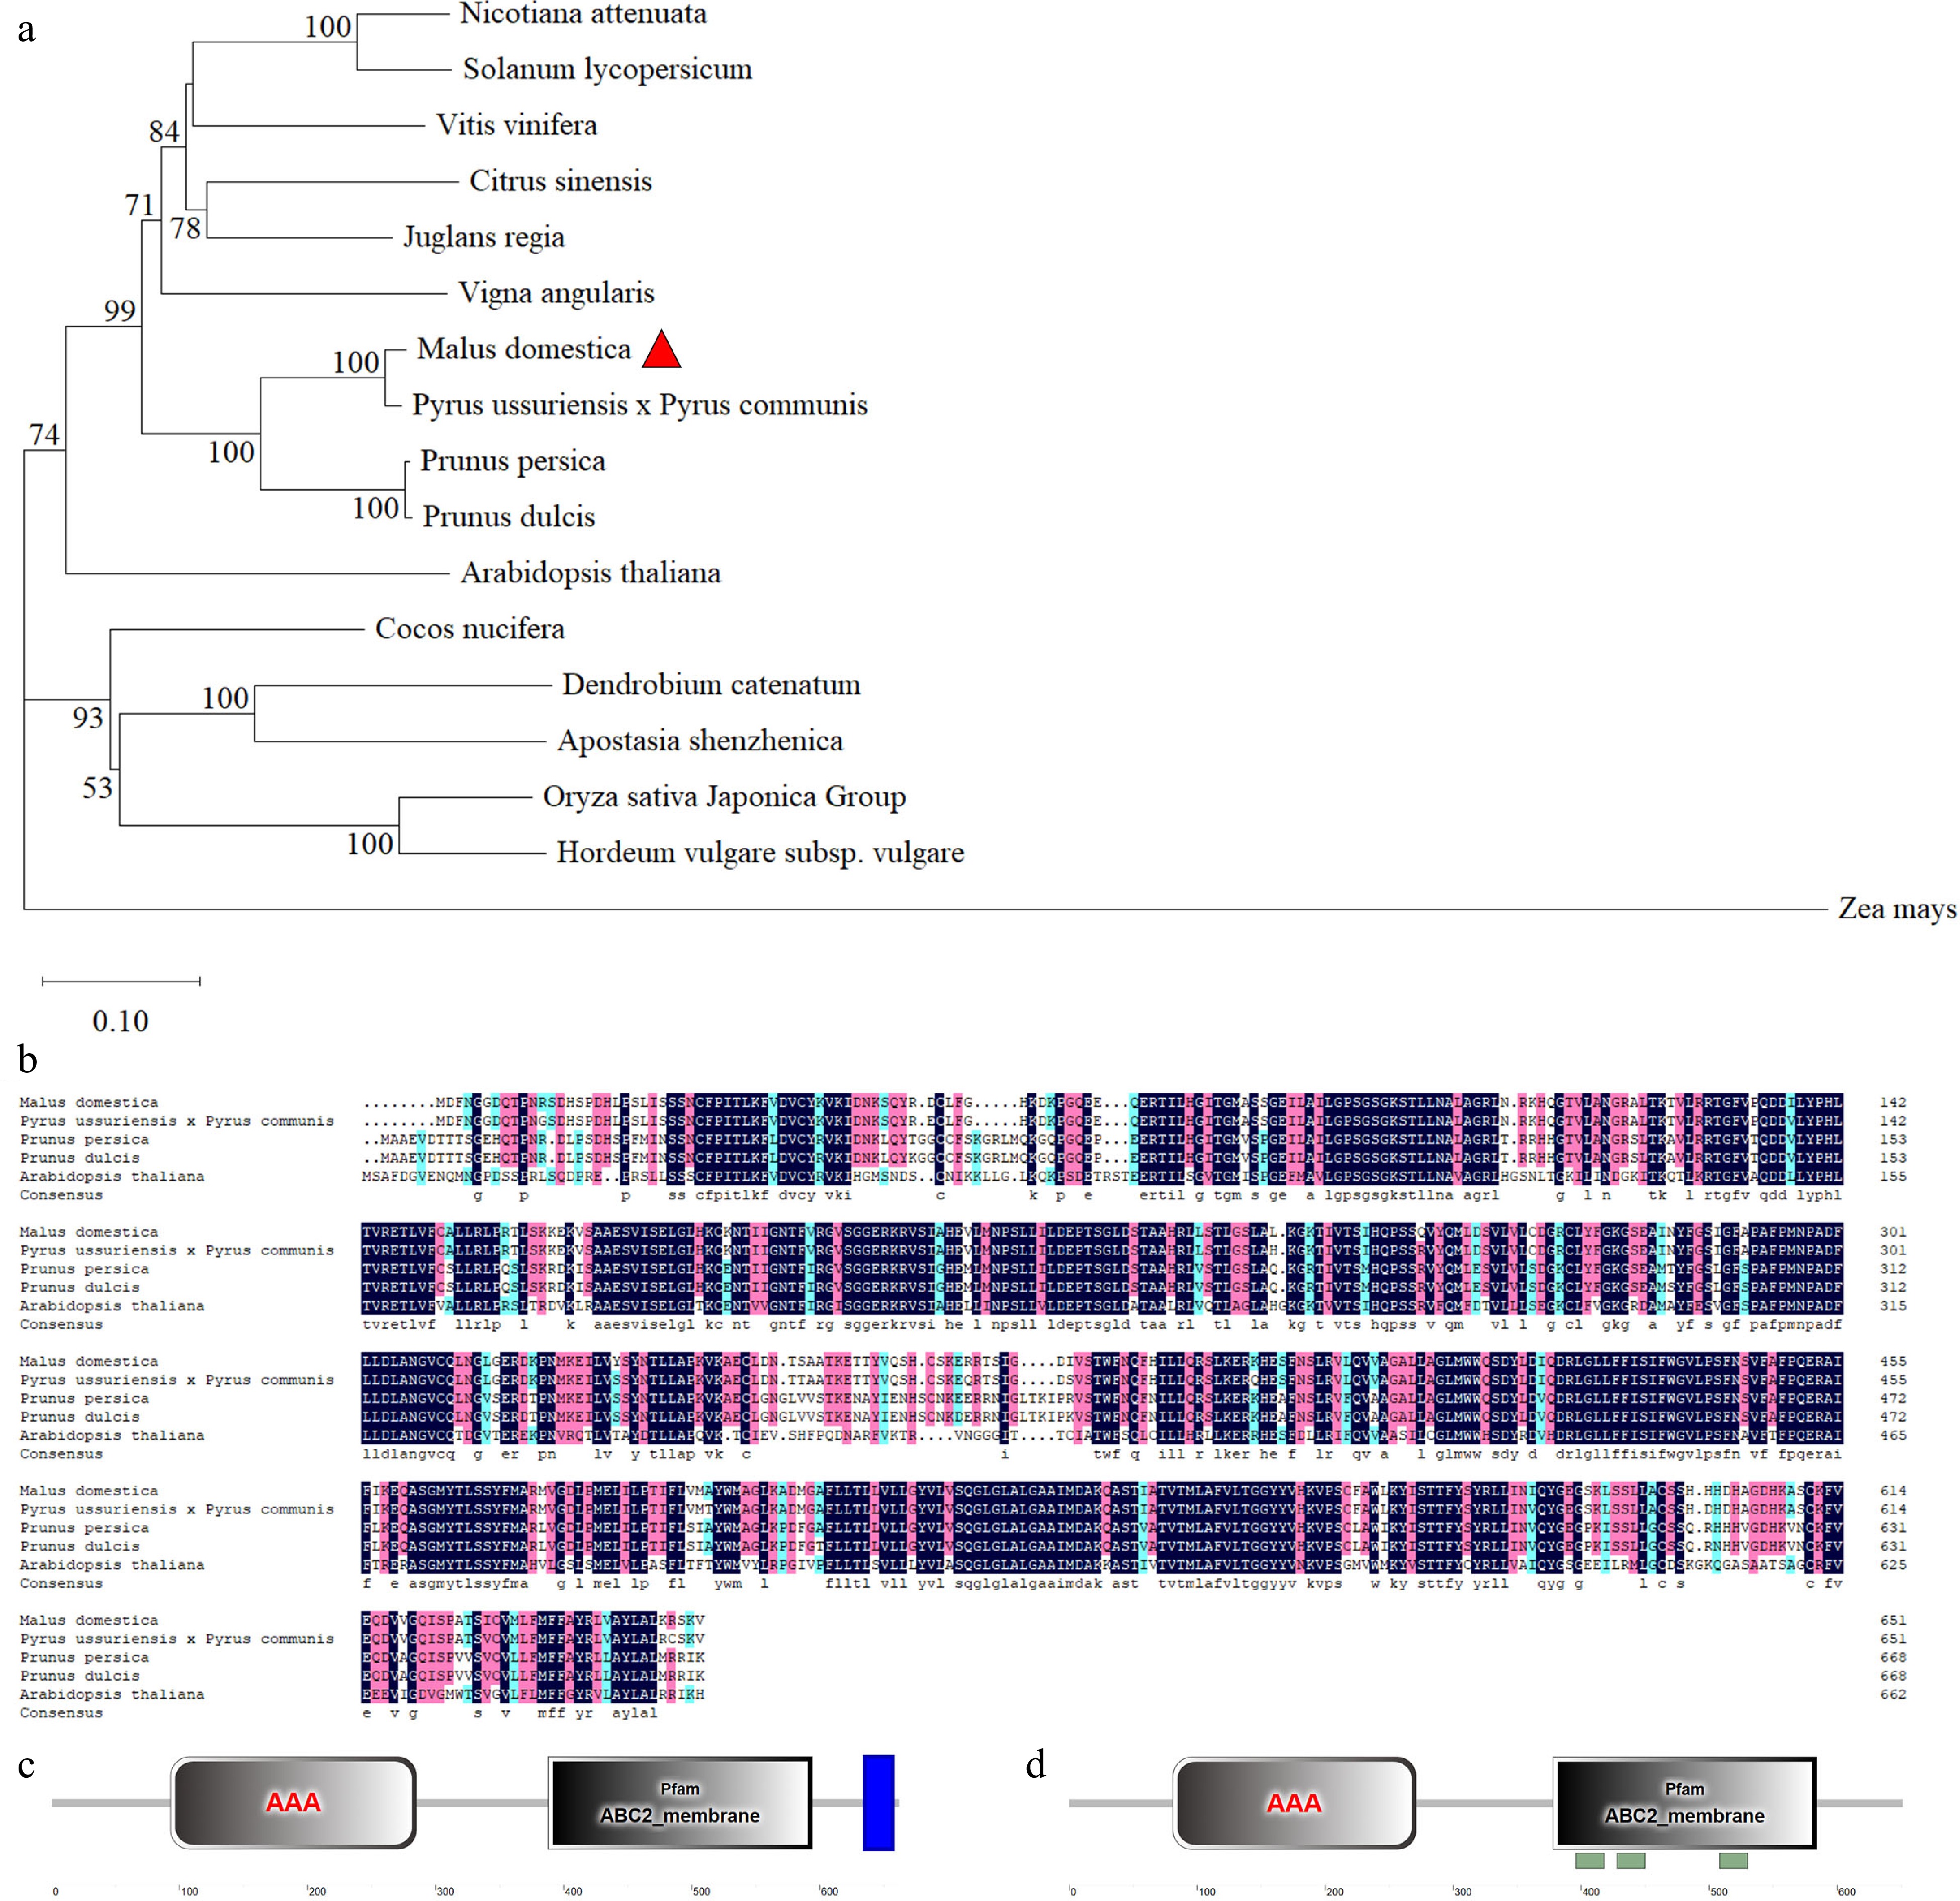
Figure 2.
Phylogenetic analysis, multiple sequence alignment and conserved motif analysis of ABCG25 proteins. (a) Phylogenetic tree assembled from ABCG25 proteins of 17 different species: Nicotiana attenuate, Solanum lycopersicum, Vitis vinifera, Citrus sinensis, Juglans regia, Vigna angularis, Malus domestica, Pyrus ussuriensis × Pyrus communis, Prunus persica, Prunus dulcis, Arabidopsis thaliana, Cocos nucifera, Dendrobium catenatum, Apostasia shenzhenica, Oryza sativa Japonica Group, Hordeum vulgare subsp. Vulgare, Zea mays. (b) Multiple sequence alignment of ABCG25 protein from different species: Malus domestica, Pyrus × bretschneideri, Prunus persica, Prunus dulcis, Arabidopsis thaliana. The conserved structural domains analysis of (c) AtABCG25 protein and (d) MdABCG25 protein sequences. The gray rectangles represent AAA domain. The blue rectangles represent transmembrane domain (TMD).
-
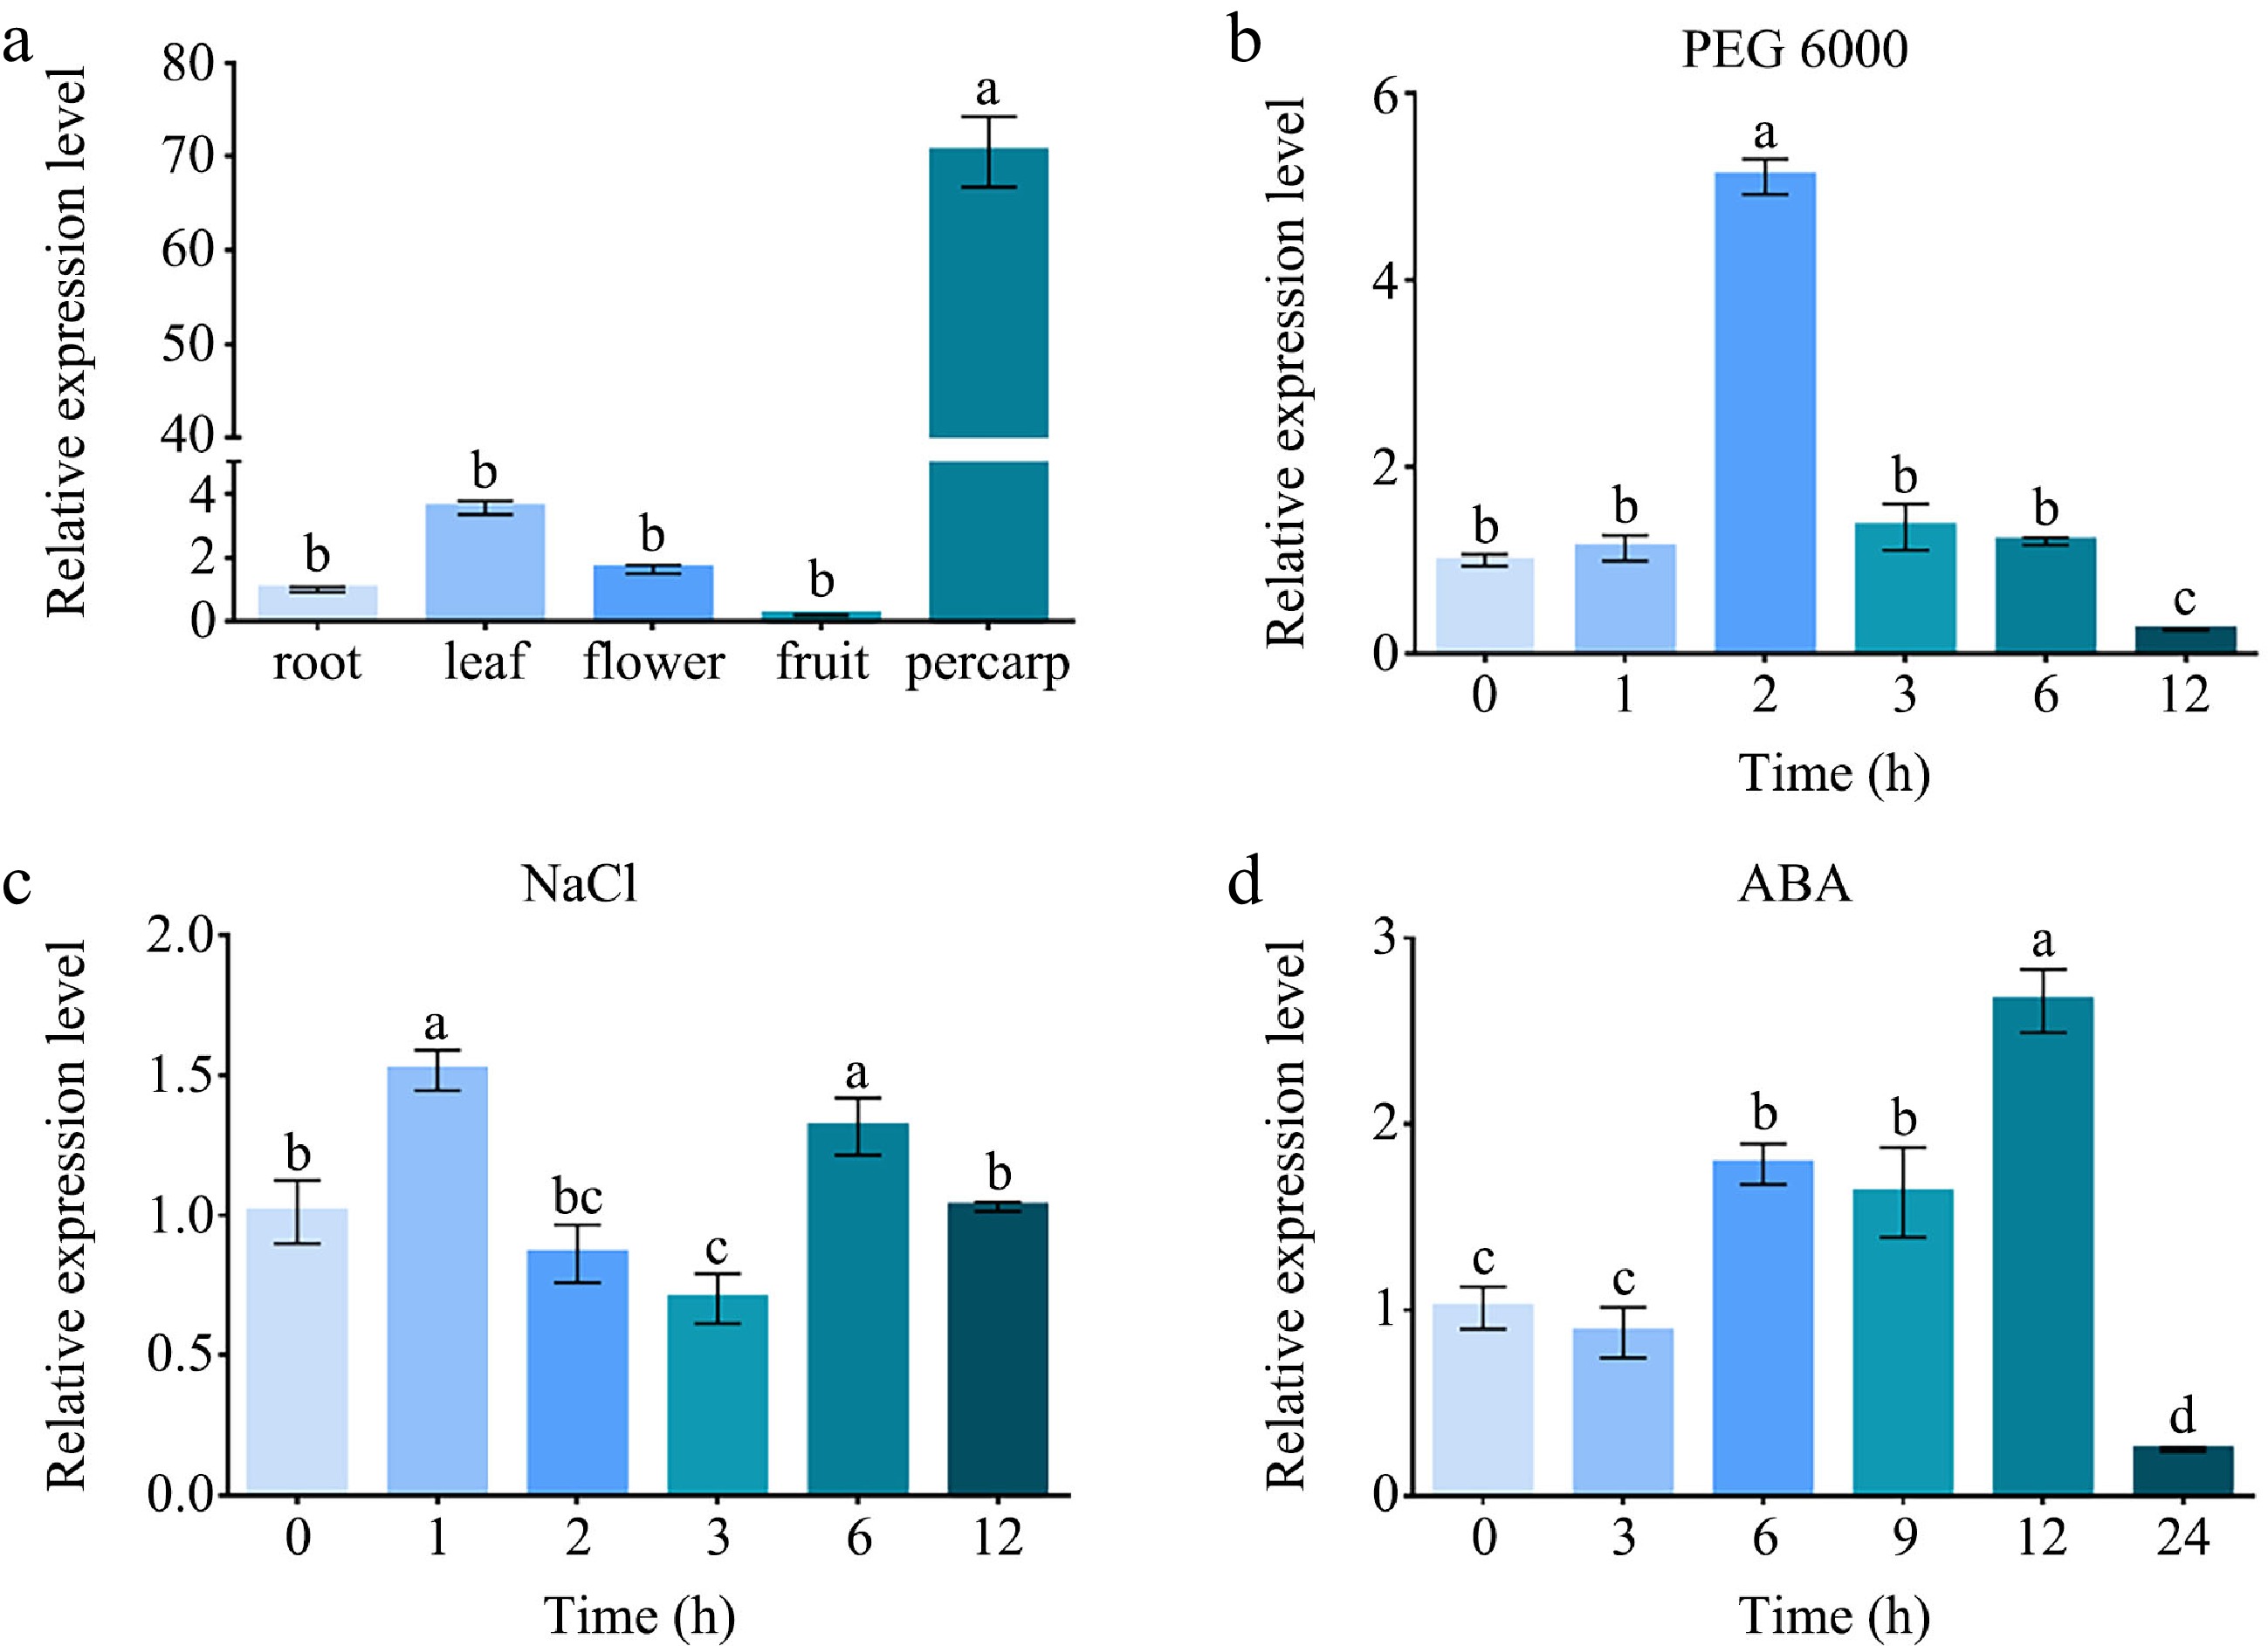
Figure 3.
The relative expression analysis of MdABCG25. (a) The relative expression levels of MdABCG25 in apple root, leaf, flower, fruit, pericarp measured by RT-qPCR. The relative expression levels of MdABCG25 under different stress treatments: (b) 10% PEG 6000, (c) 100 mmol·L −1 NaCl, and (d) 100 μmol·L −1 ABA measured by RT-qPCR. Data are mean ± SD of three independent replicates. Different lowercase letters indicate a significant difference at p < 0.05.
-
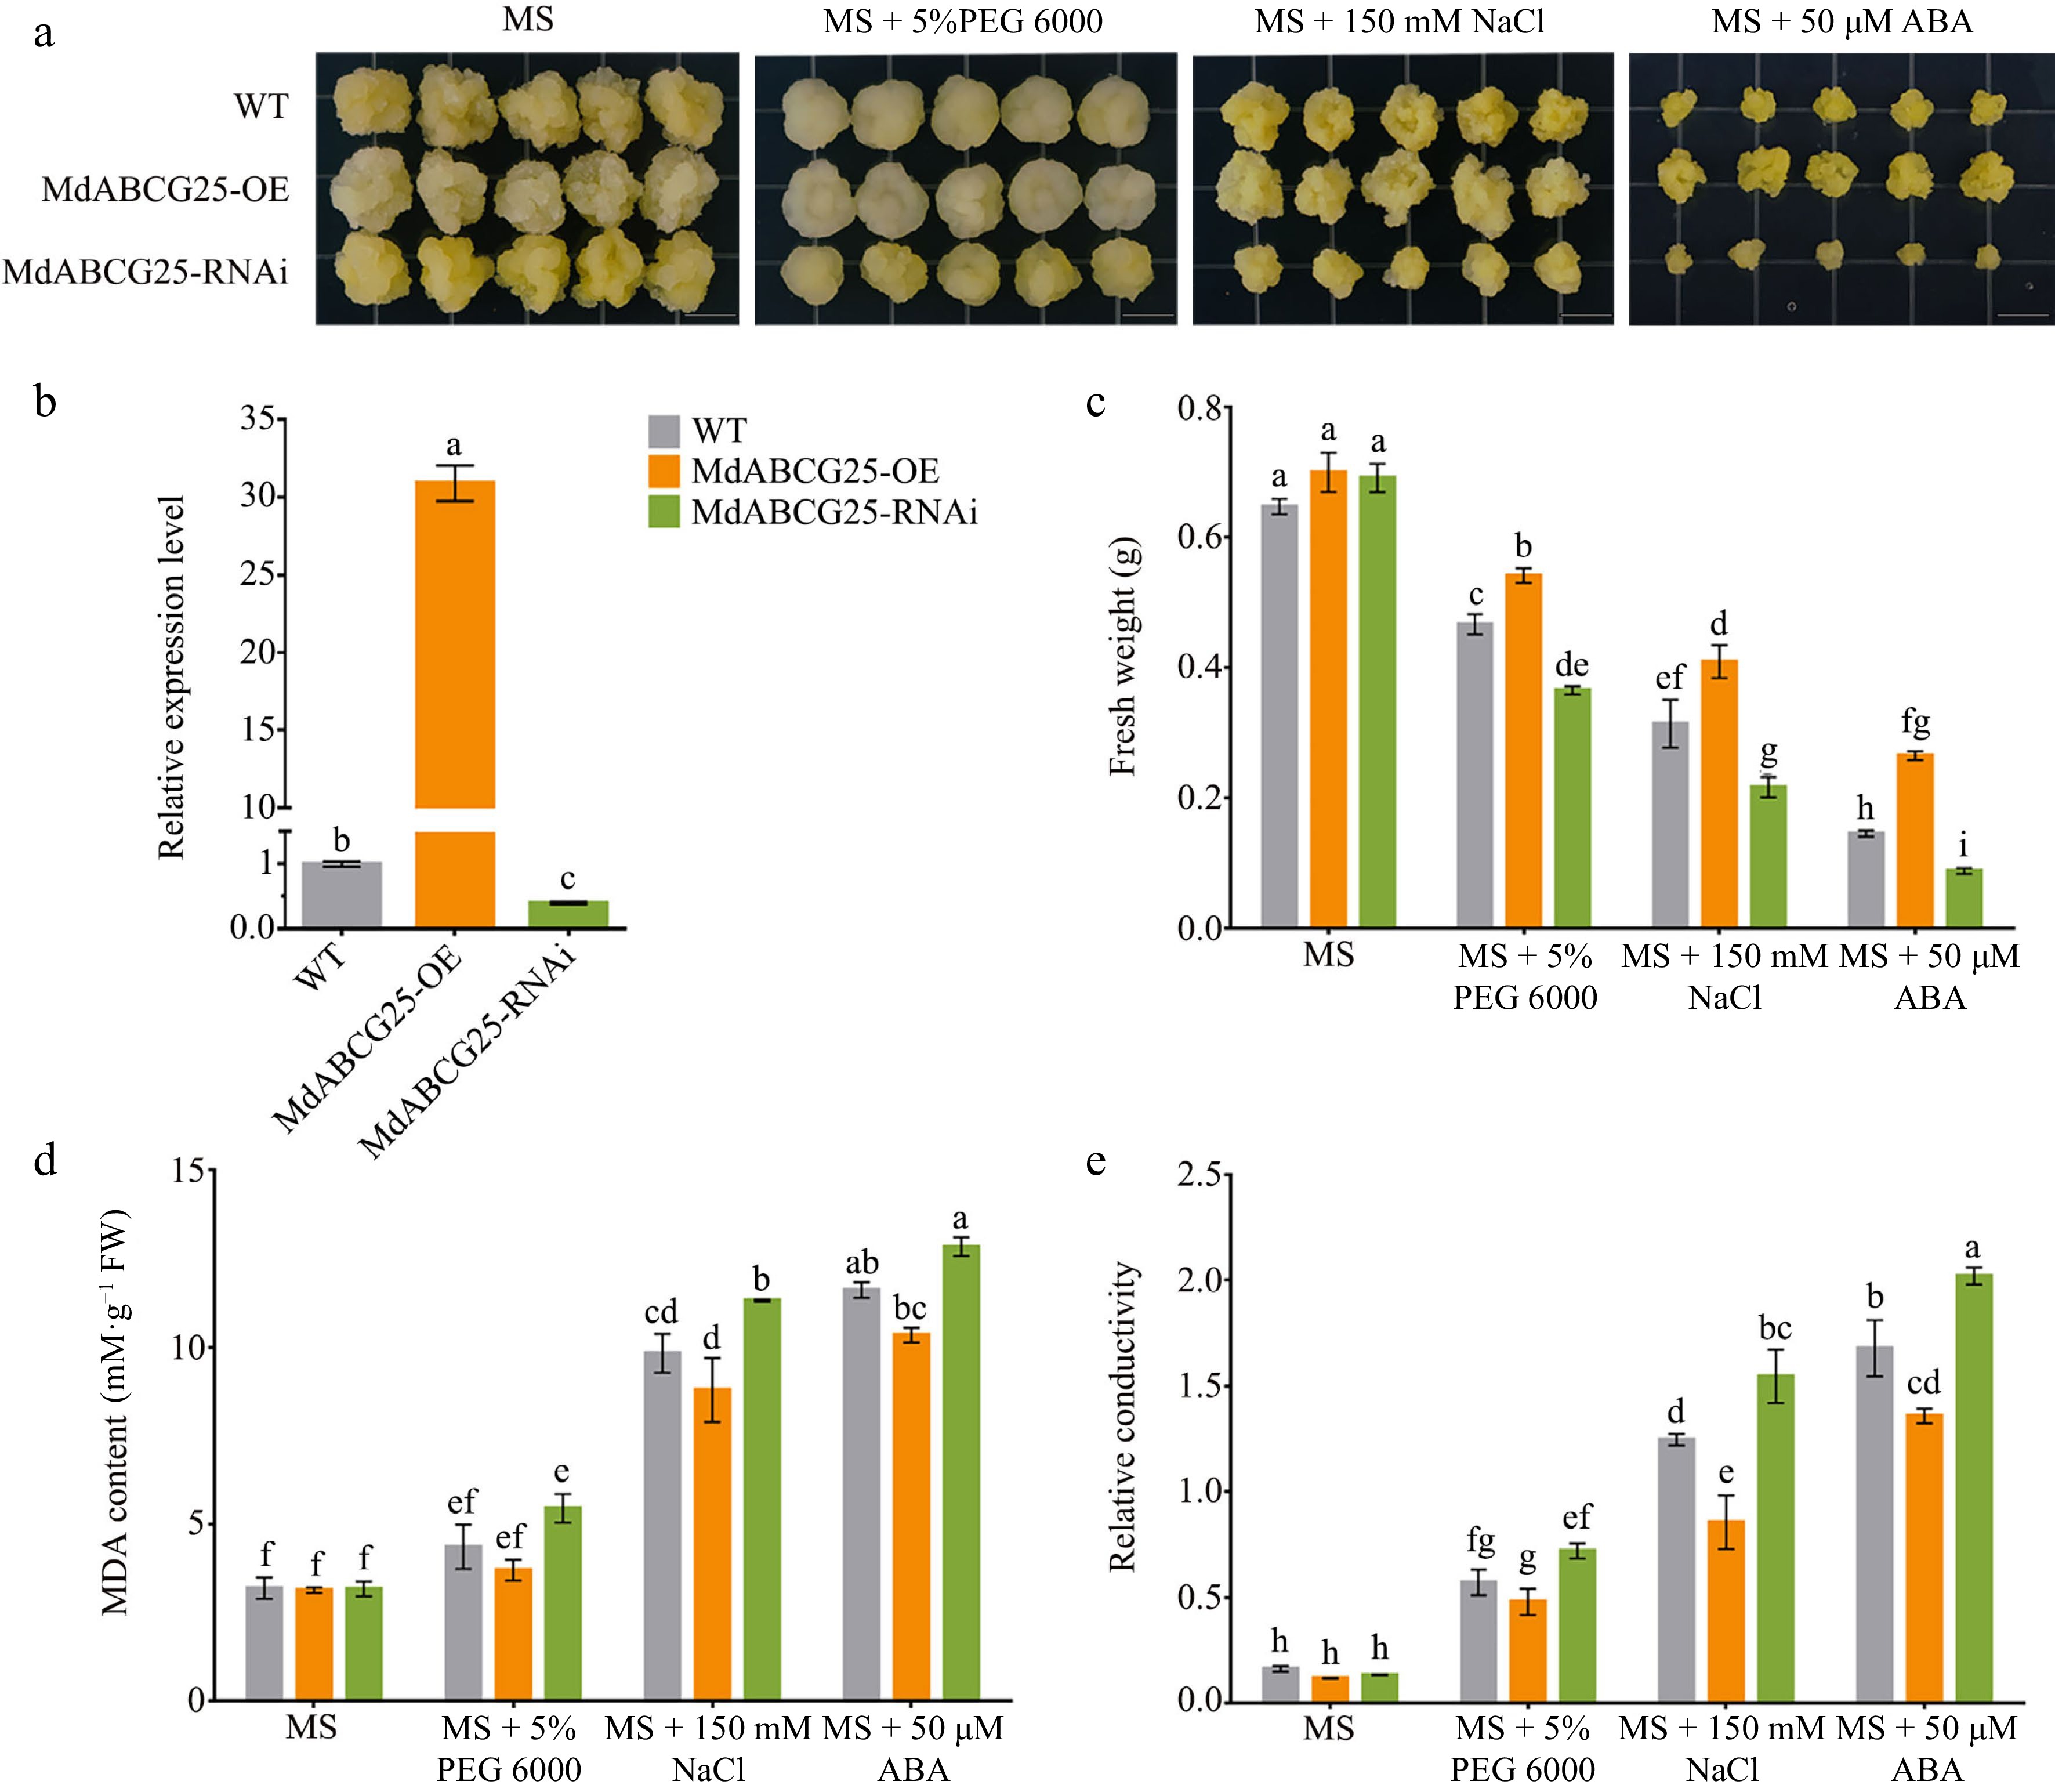
Figure 4.
Phenotypes of MdABCG25 transgenic apple calli under different abiotic stress conditions. (a) Phenotypes of MdABCG25 transgenic lines and wild-type (WT) apple calli treated with MS medium, MS + 5% PEG 6000, MS + 150 mmol·L −1 NaCl and MS + 50 μmol·L −1 ABA. (b) Relative expression levels of MdABCG25 in wild-type (WT) apple calli and MdABCG25 transgenic lines measured by RT-qPCR. (c) Fresh weight, (d) MDA content and (e) relative conductivity of MdABCG25 transgenic lines and WT apple calli after treatments. FW = fresh weight. Data are mean ± SD of three independent replicates. Different lowercase letters indicate a significant difference at p < 0.05.
-
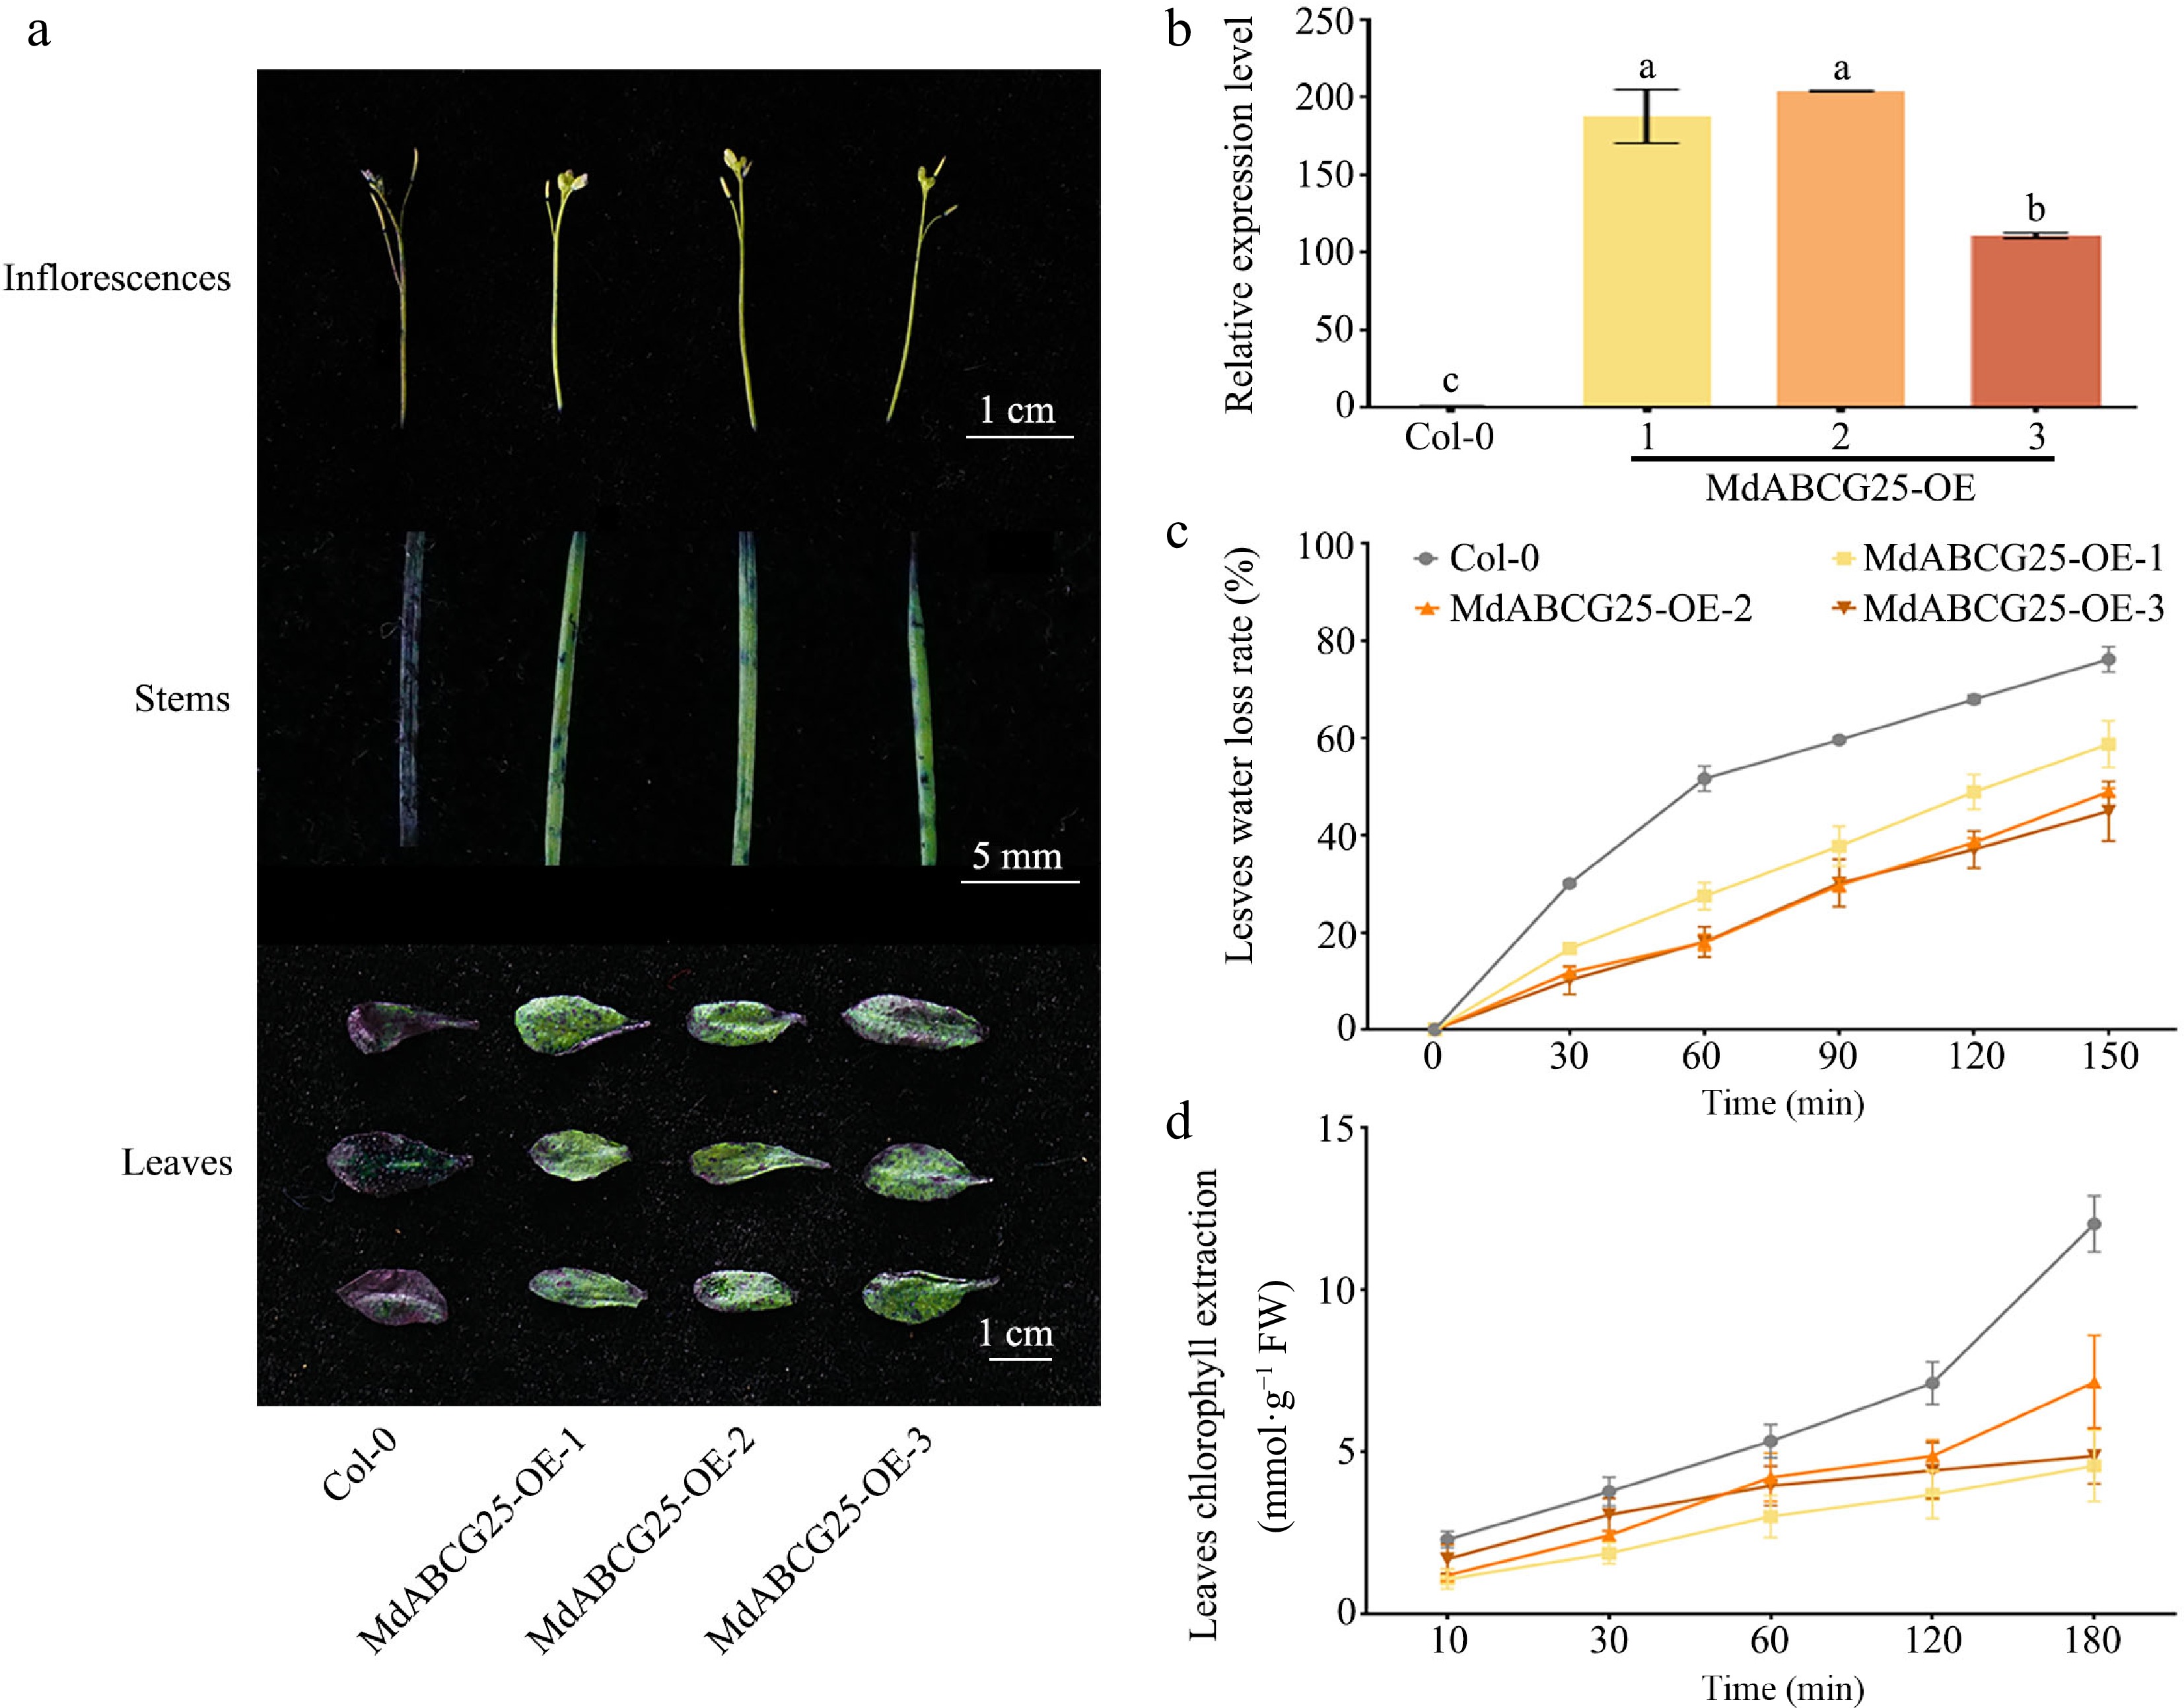
Figure 5.
MdABCG25 can reduce the epidermis permeability of Arabidopsis. (a) TB staining of inflorescences, stems and leaves of the MdABCG25 transgenic lines and Col-0. Scale bars correspond to 1 cm, 5 mm and 1 cm, respectively. (b) Expression levels of MdABCG25 in three MdABCG25 transgenic Arabidopsis and Col-0 using RT-qPCR analysis. (c) Water loss rate of rosette leaves of the MdABCG25 transgenic lines and Col-0. (d) Chlorophyll extraction of rosette leaves of the MdABCG25 transgenic lines and Col-0. Data are mean ± SD of three independent replicates. Different lowercase letters indicate a significant difference at p < 0.05.
-
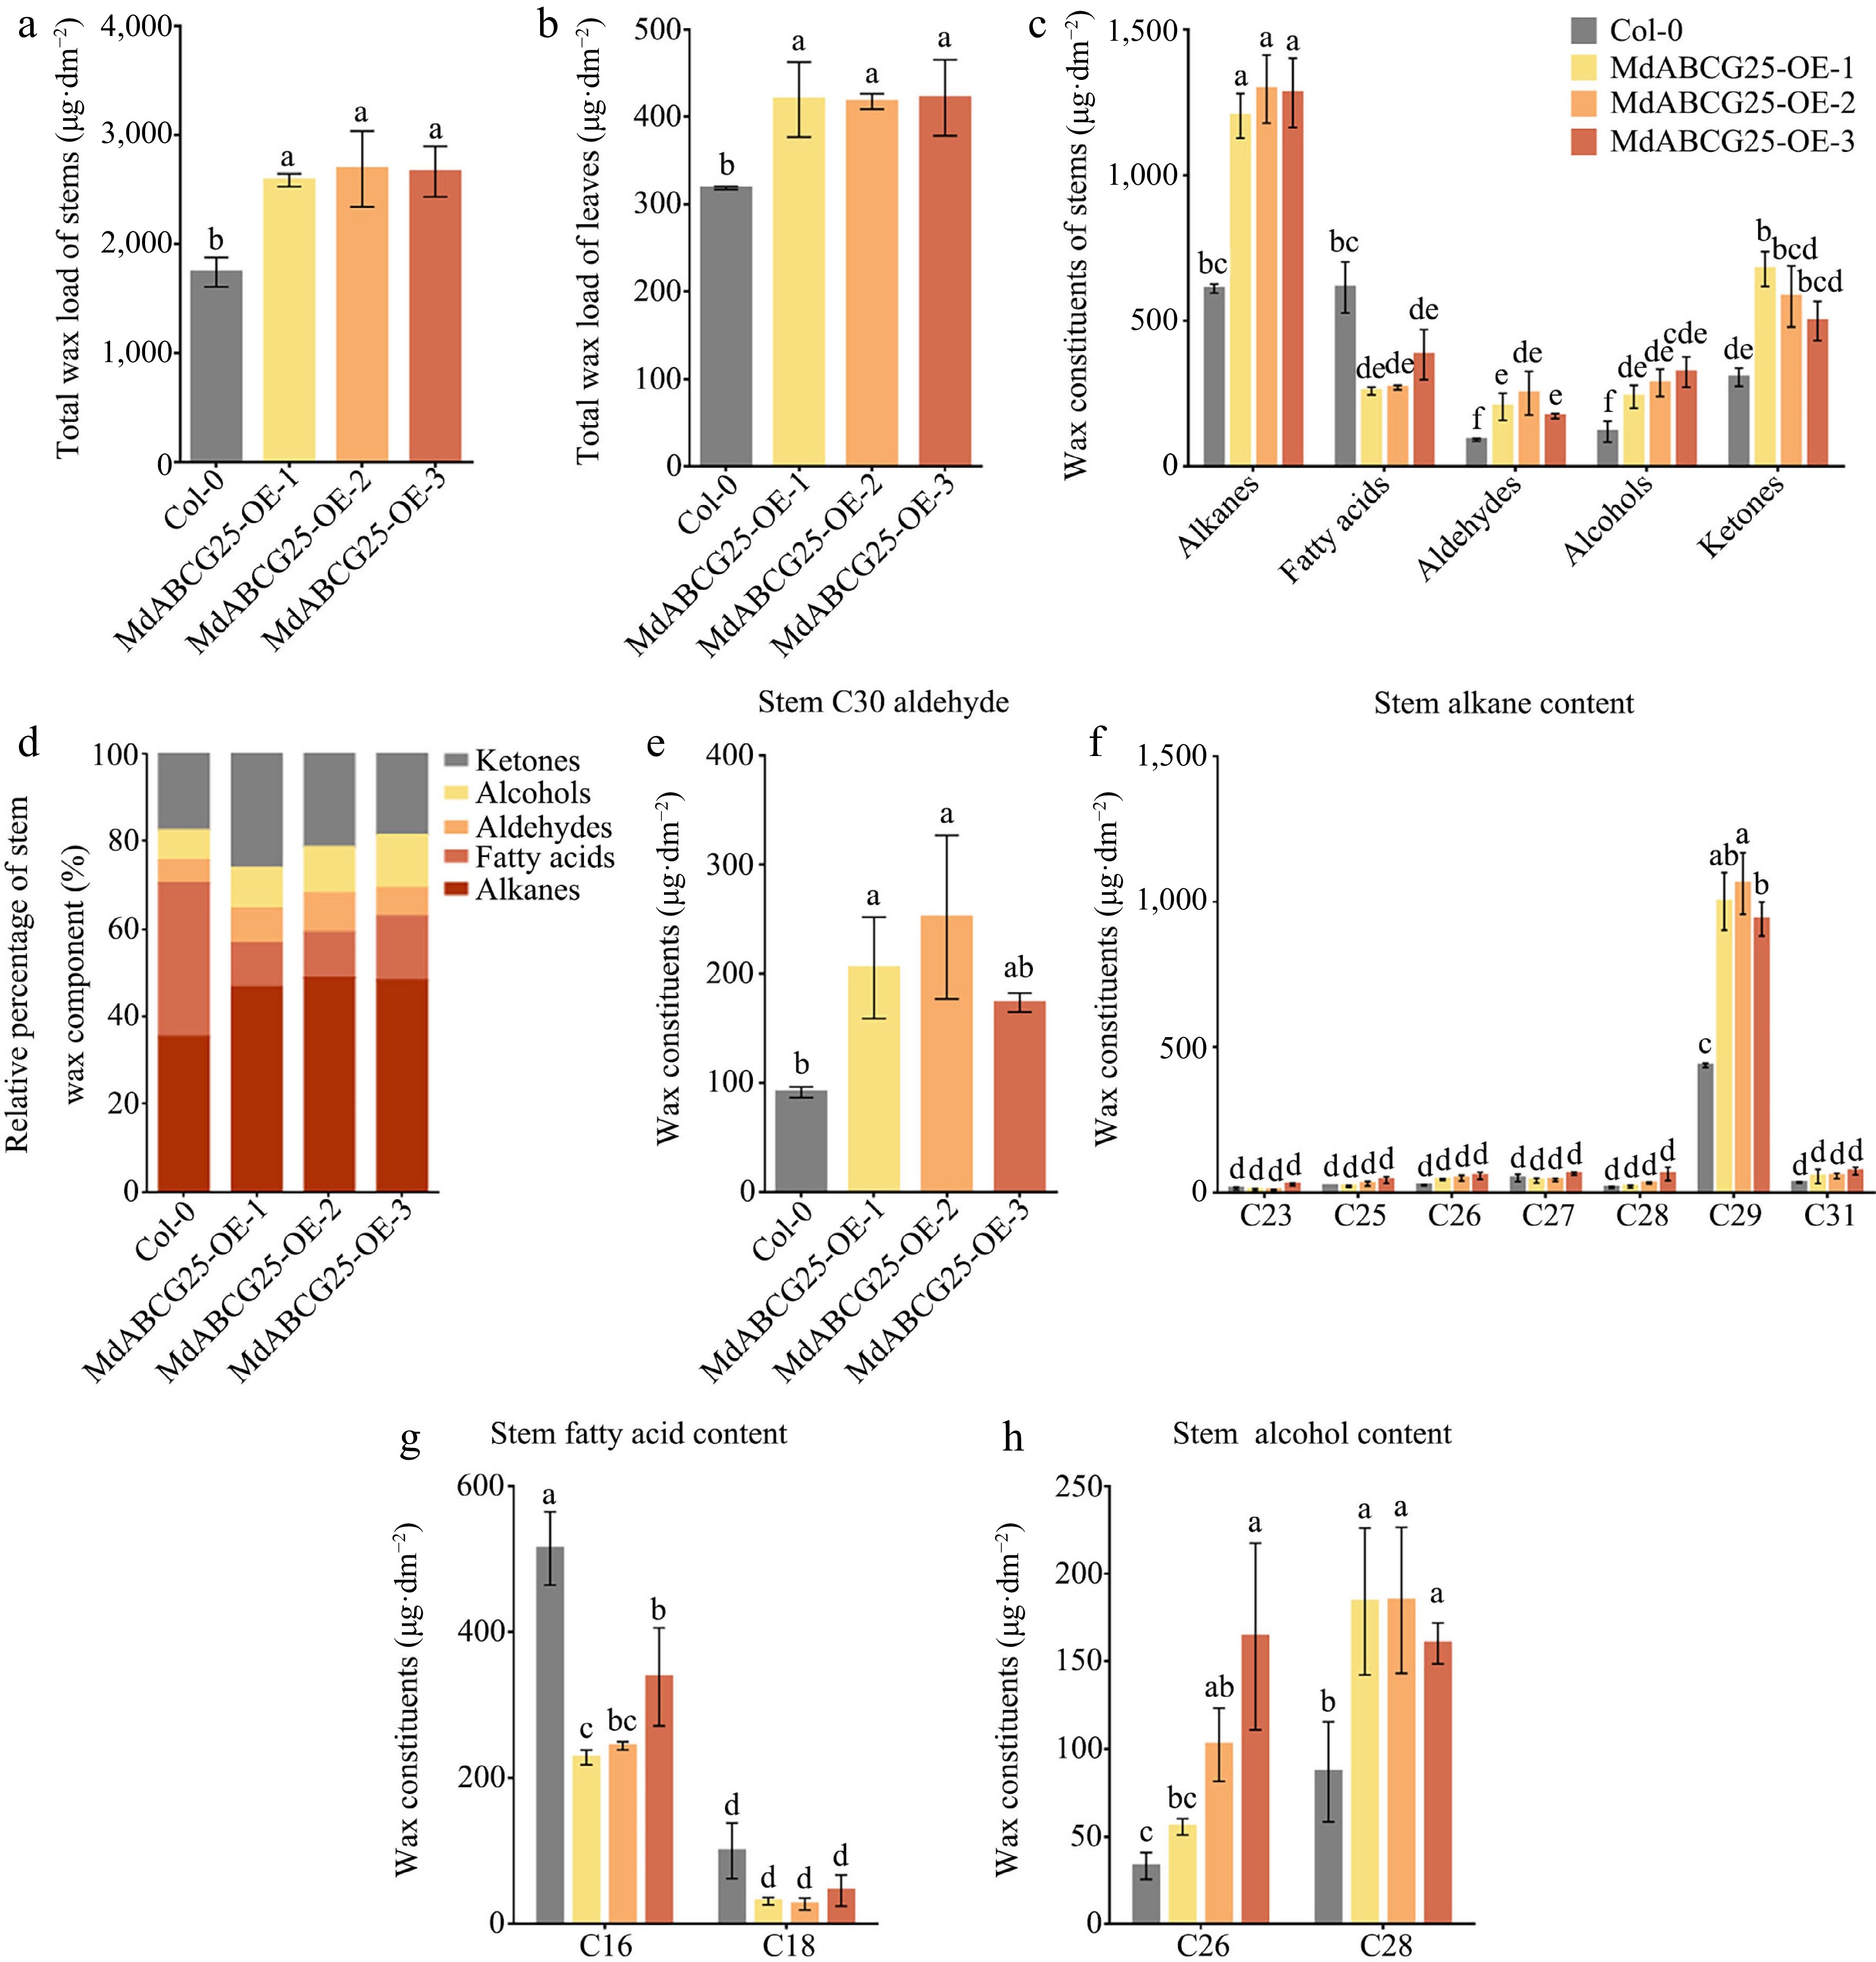
Figure 6.
The effect of MdABCG25 on cuticular wax content and composition. Total wax load of (a) stems and (b) leaves of the MdABCG25 transgenic Arabidopsis and Col-0. (c) Wax composition of stems of the MdABCG25 transgenic Arabidopsis and Col-0 analyzed by GC-MS. (d) Relative percentage of stems wax component. Stem wax constituents of (e) aldehydes, (f) alkanes, (g) fatty acids and (h) alcohols in MdABCG25 transgenic Arabidopsis and Col-0 analyzed by GC-MS. The compounds were tentatively identified by GC-MS solution software. Data are mean ± SD of three independent replicates. Different lowercase letters indicate a significant difference at p < 0.05.
-
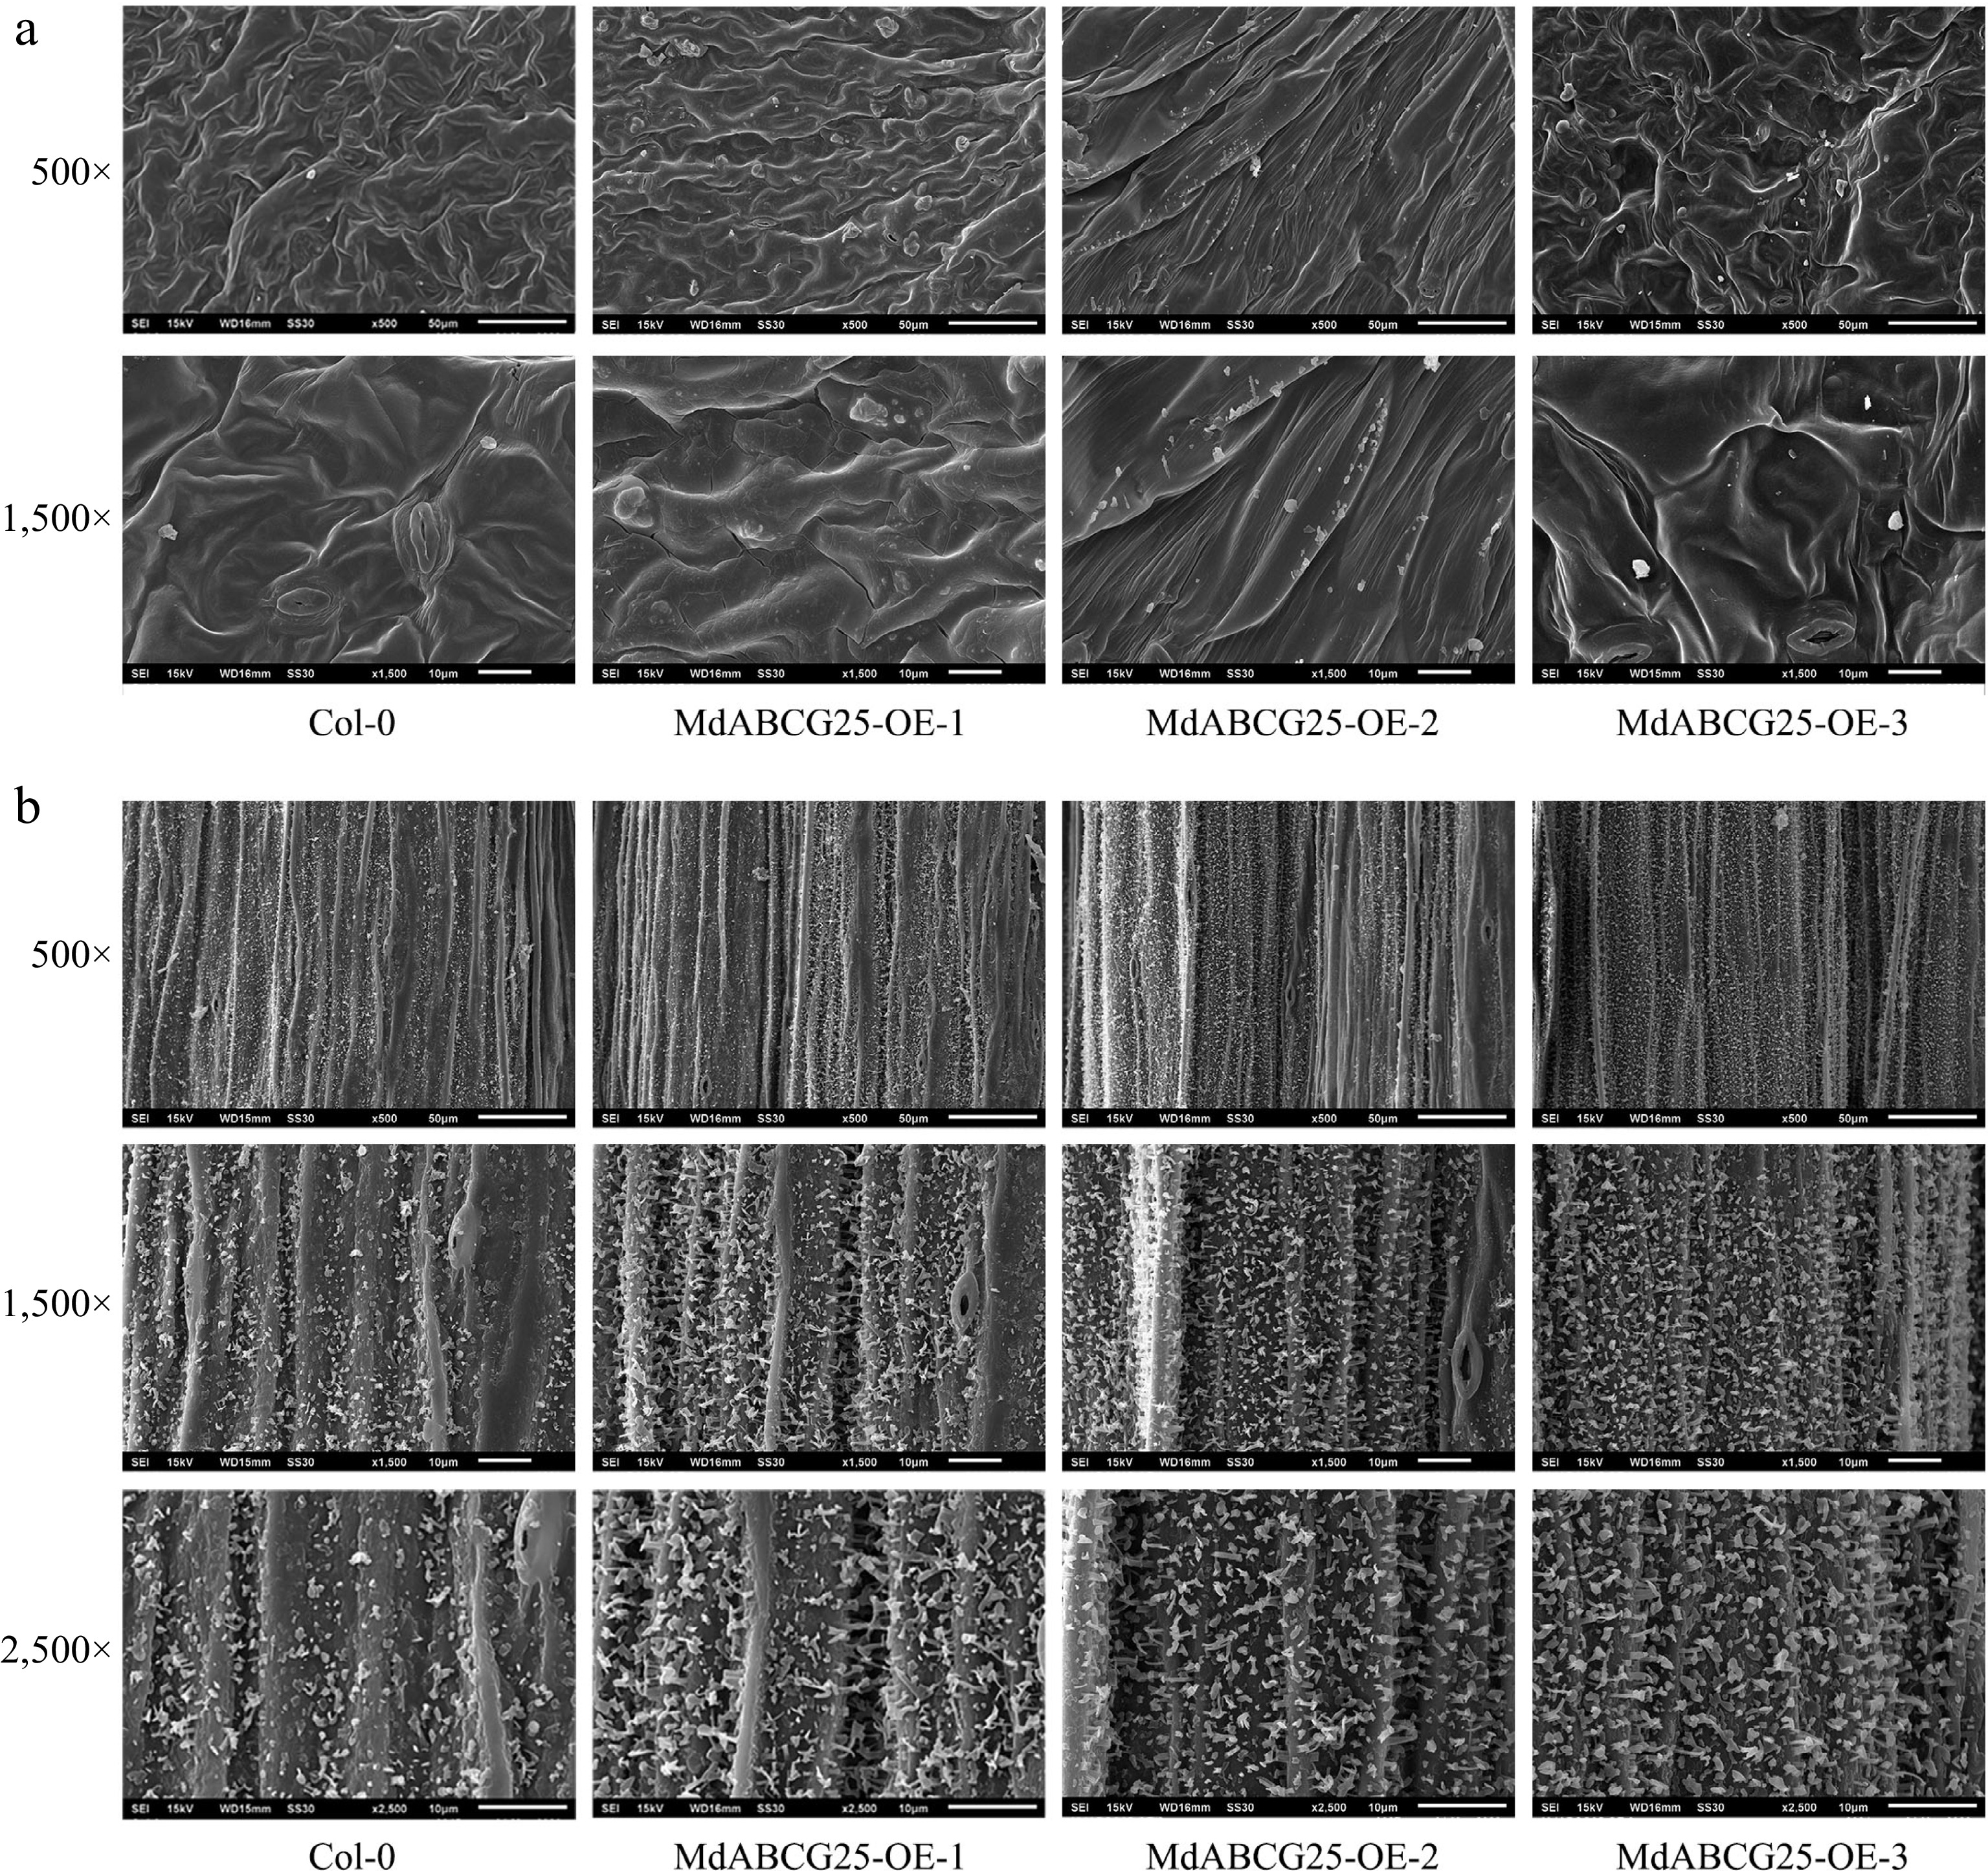
Figure 7.
Cuticle wax crystal morphology of MdABCG25 transgenic and Col-0 Arabidopsis observed by SEM. The epidermal ultrastructure of MdABCG25 transgenic and Col-0 Arabidopsis rosette (a) leaves and (b) stems. Wax crystals were monitored at 500×, 1,500× and 2,500× magnification, and scale bars correspond to 50 μm, 10 μm and 10 μm, respectively.
-
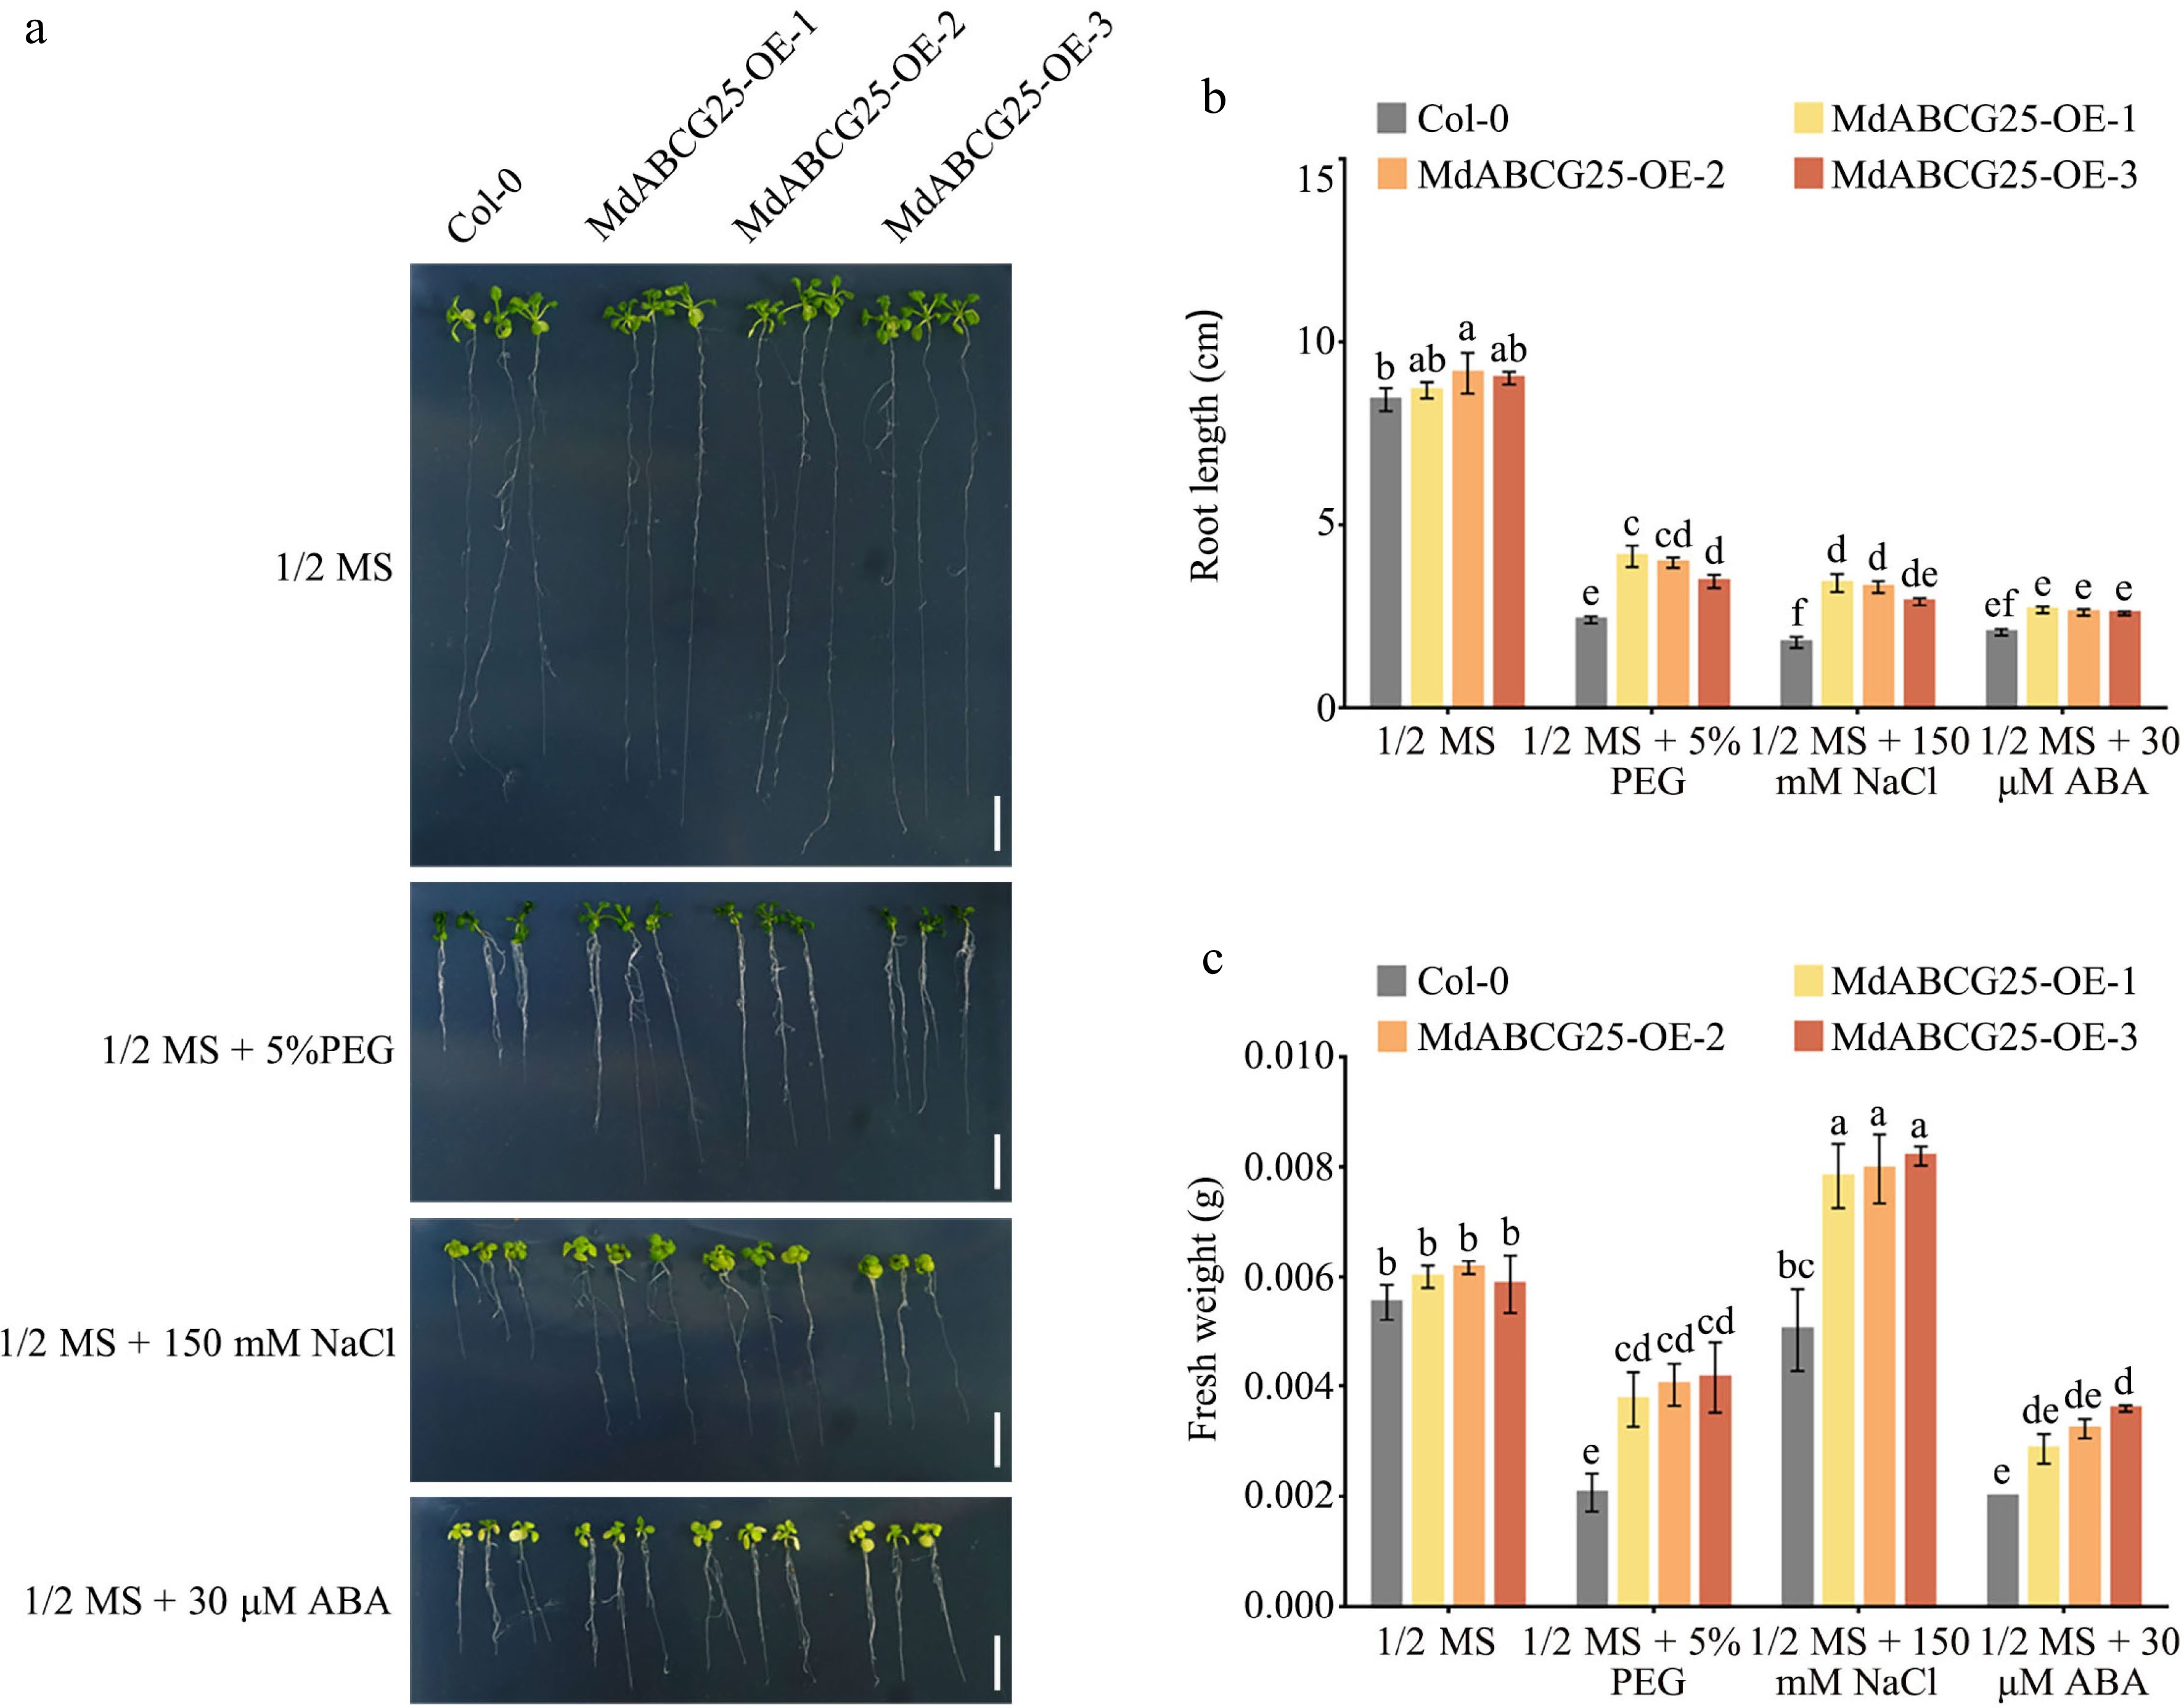
Figure 8.
Phenotypes of MdABCG25 transgenic and Col-0 Arabidopsis seedings under different abiotic stress conditions. (a) Phenotypes of MdABCG25 transgenic and Col-0 Arabidopsis seedings treated with 1/2 MS medium, 1/2 MS + 5% PEG 6000, 1/2 MS + 150 mmol·L −1 NaCl and 1/2 MS + 30 μmol·L −1 ABA. Bar = 1 cm. (b) Root length and (c) fresh weight of MdABCG25 transgenic and Col-0 Arabidopsis. FW = fresh weight. Data are mean ± SD of three independent replicates. Different lowercase letters indicate a significant difference at p < 0.05.
-
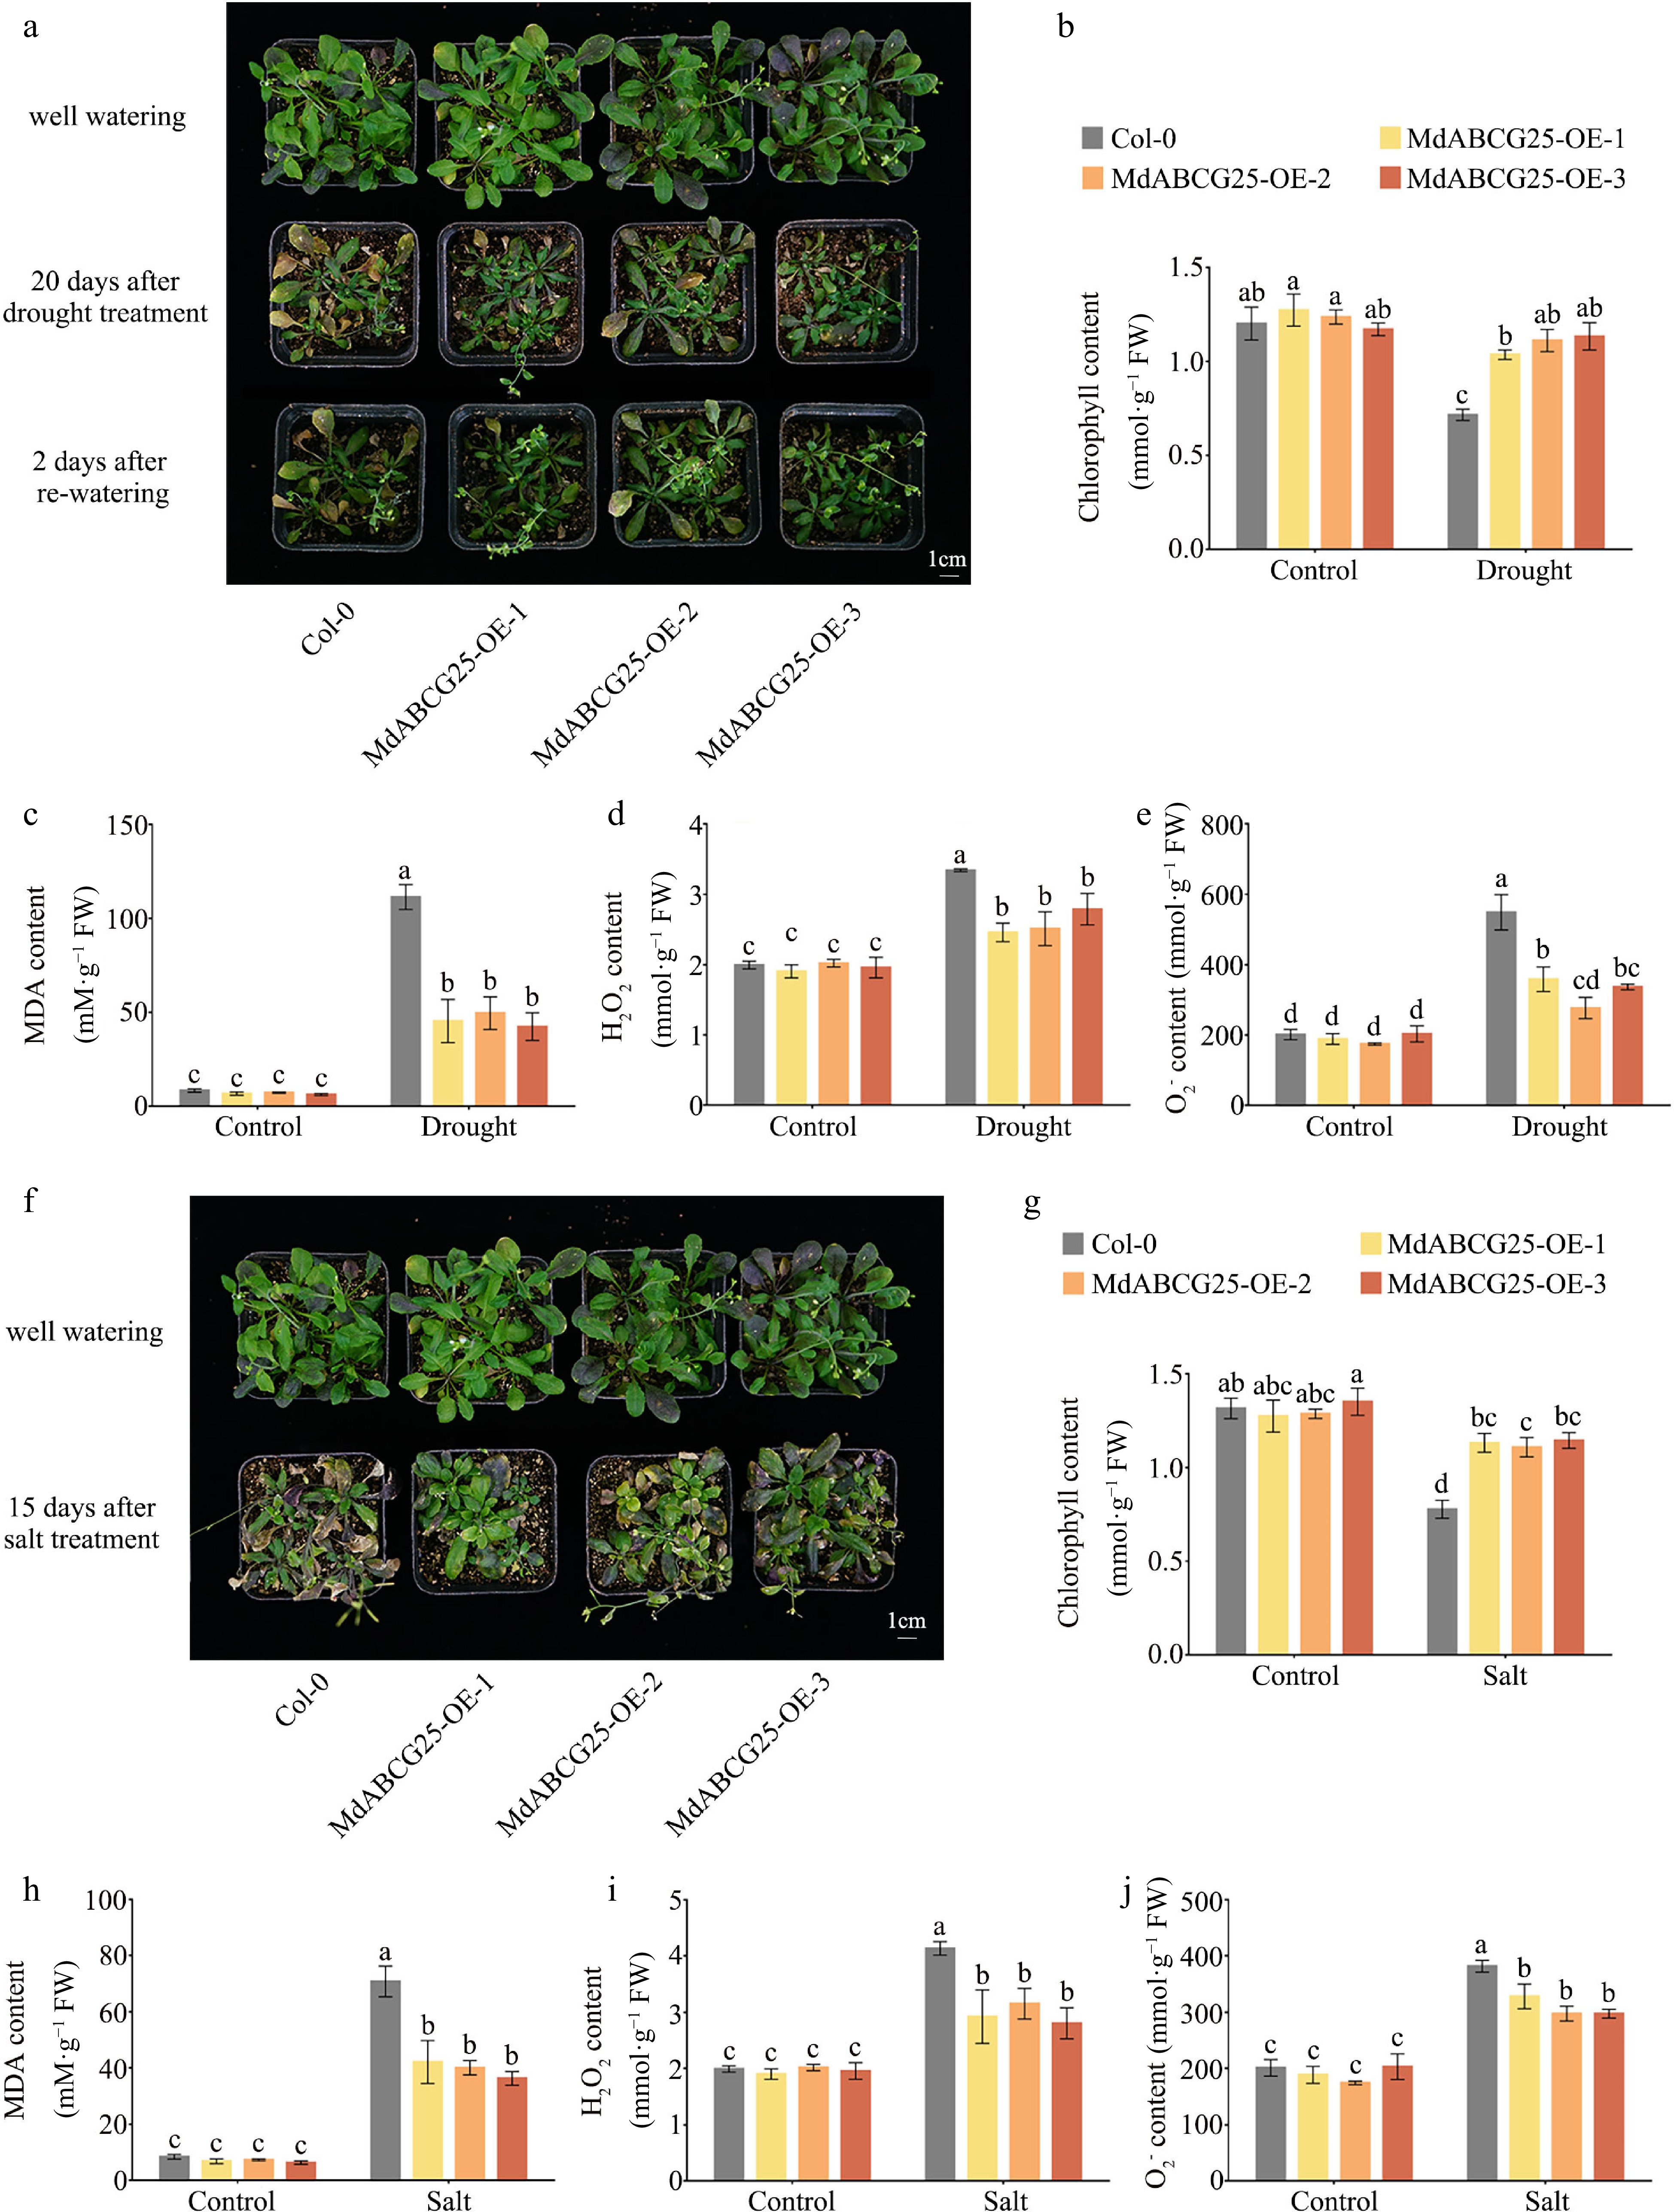
Figure 9.
MdABCG25 can enhance tolerance to drought and salt in Arabidopsis. (a) Phenotypes of MdABCG25 transgenic and Col-0 Arabidopsis in normal conditions or 20 d of drought treatment. Physiological indicators in MdABCG25 transgenic and Col-0 Arabidopsis in normal conditions and drought treatment; (b) chlorophyll content, (c) MDA content, (d)
${\text{O}^-_2} $ ${\text{O}^-_2} $ -
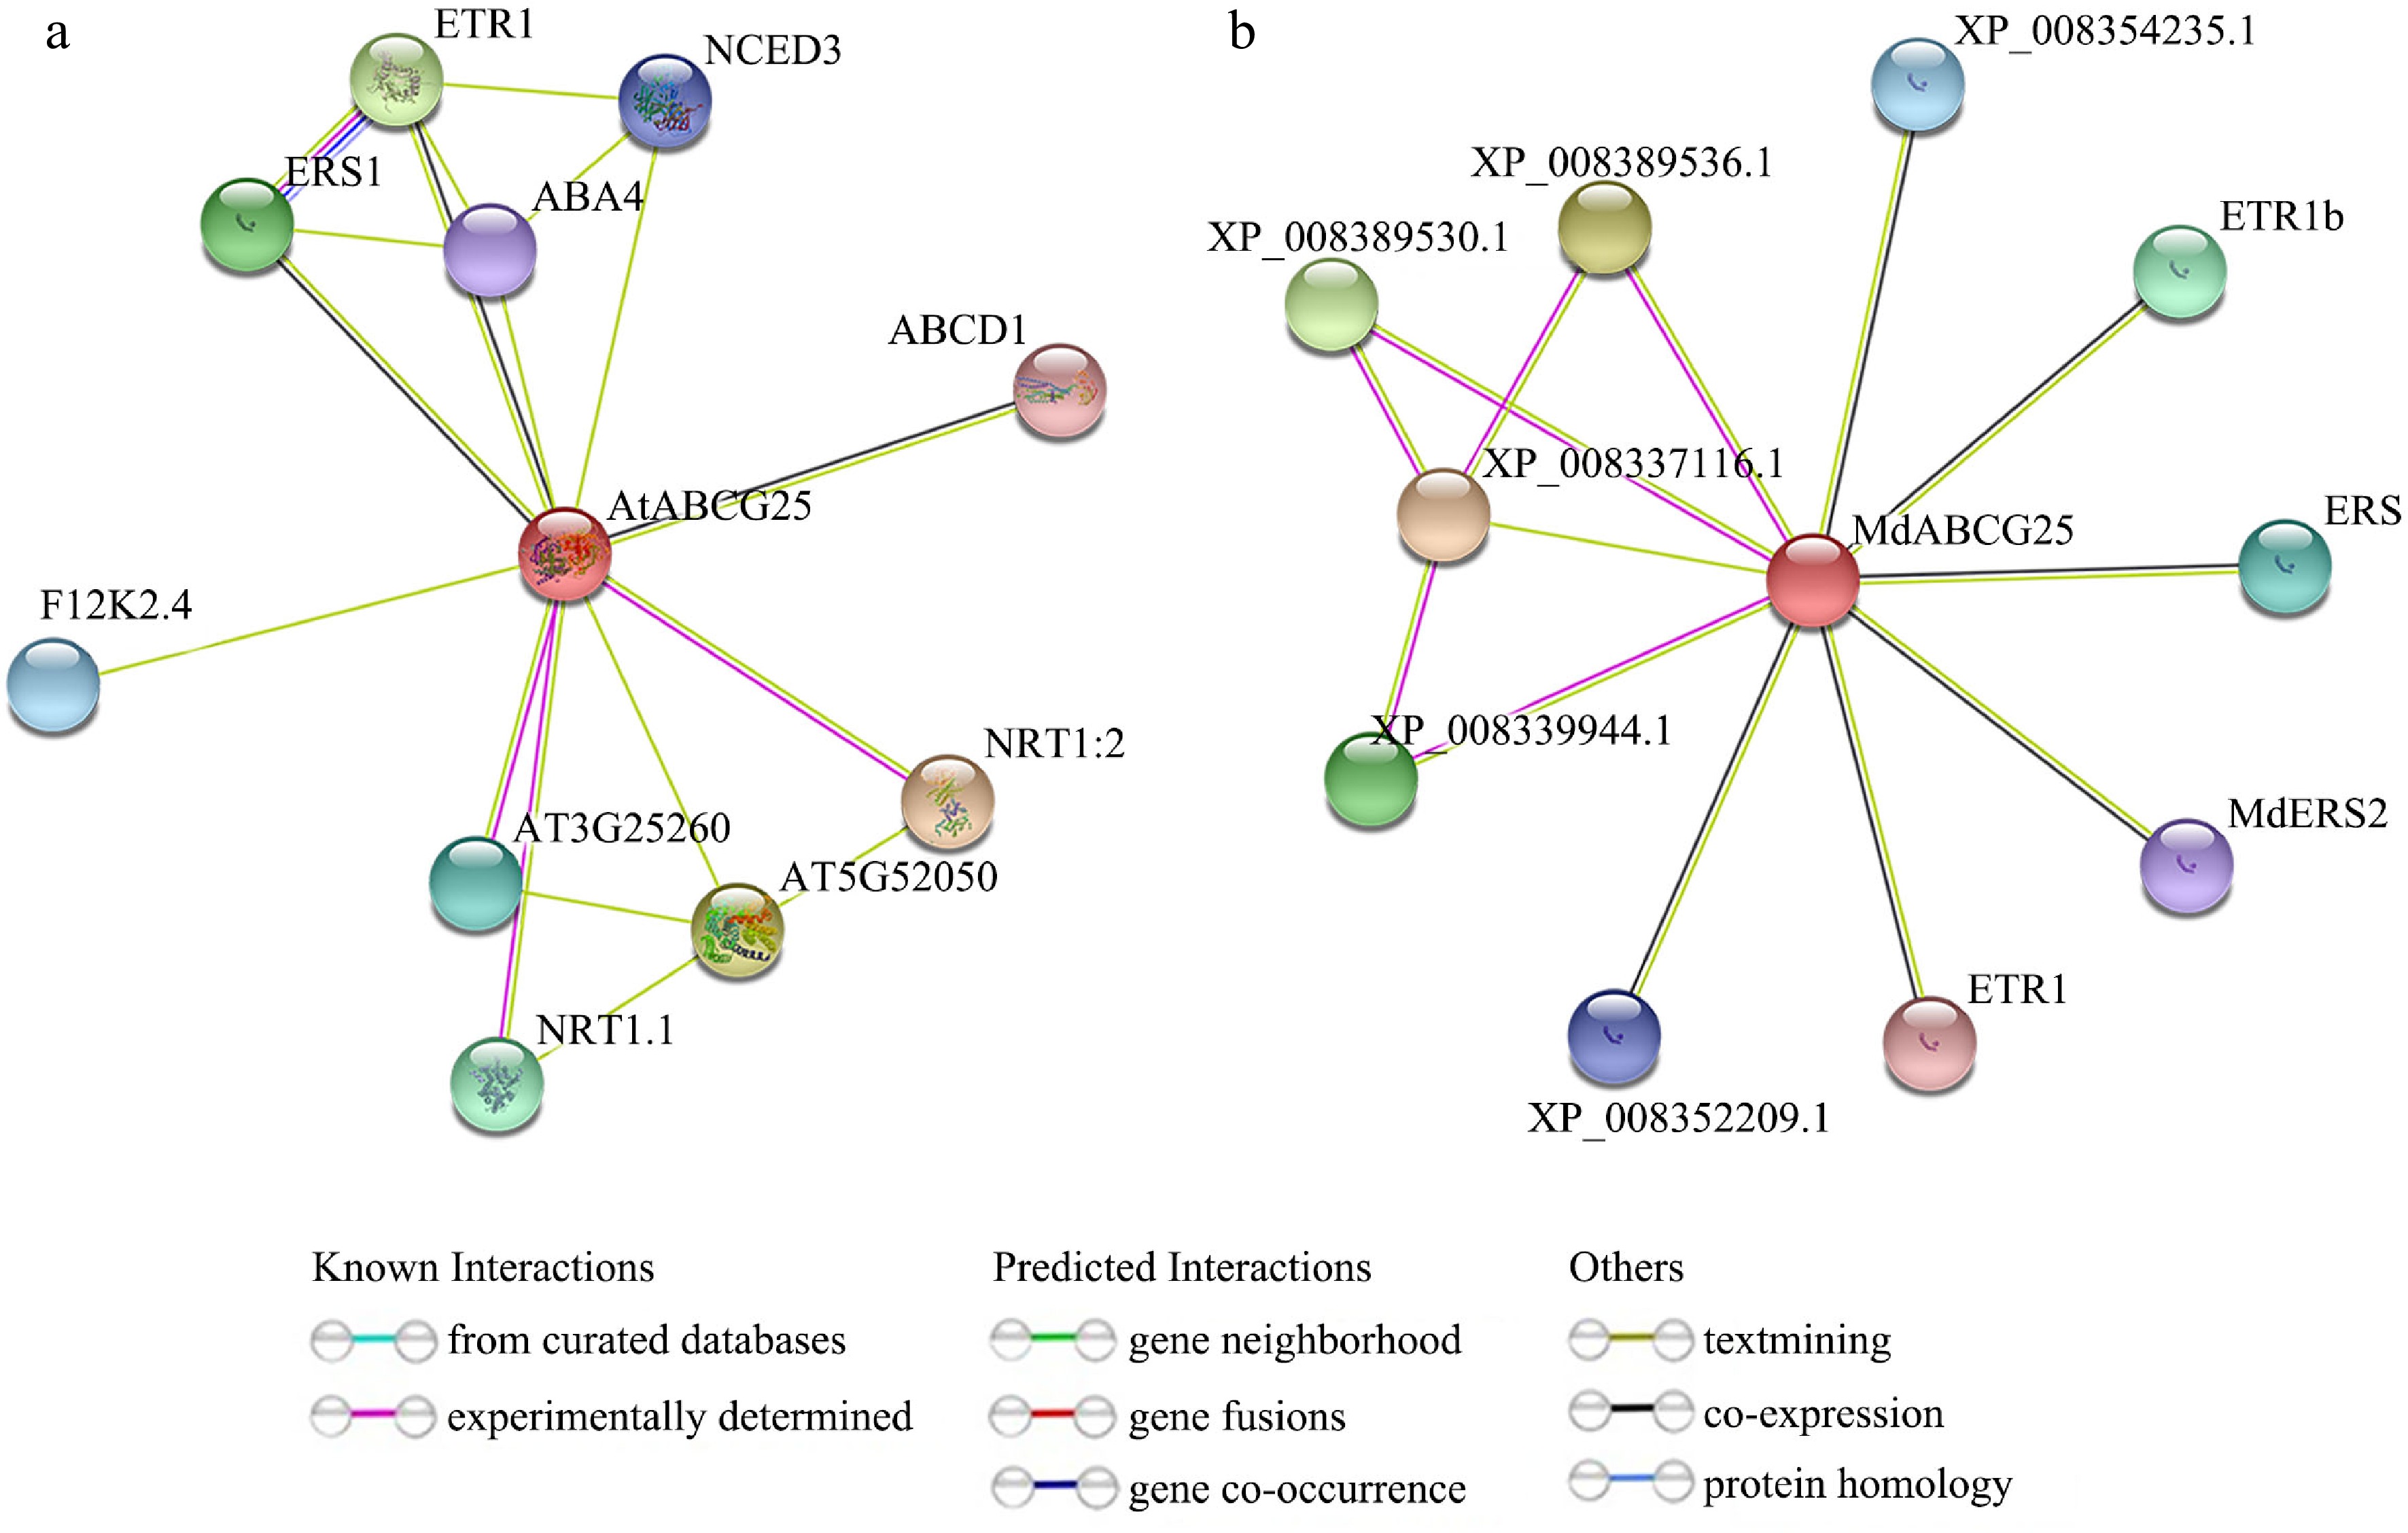
Figure 10.
Protein interaction networks for the AtABCG25 and MdABCG25 proteins. Predicted interaction networks for the (a) AtABCG25 and (b) MdABCG25 proteins generated using the online software STRING.
-
Cis-element name Sequence Function Start site (bp) Termination site (bp) P-box CCTTTTG Gibberellin-responsive element 271 277 MBS CAACTG MYB binding site involved in drought-inducibility 531 536 CGTCA-motif CGTCA cis-acting regulatory element involved in the MeJA-responsiveness 723 727 LTR CCGAAA cis-acting element involved in low-temperature responsiveness 1,122 1,127 TGA-element AACGAC Auxin-responsive element 1,324 1,329 ACE CTAACGTATT cis-acting element involved in light responsiveness 1,458 1,467 ABRE ACGTG cis-acting element involved in the abscisic acid responsiveness 1,856 1,860 Table 1.
MdABCG25 promoter cis-acting element analysis.
Figures
(10)
Tables
(1)