-
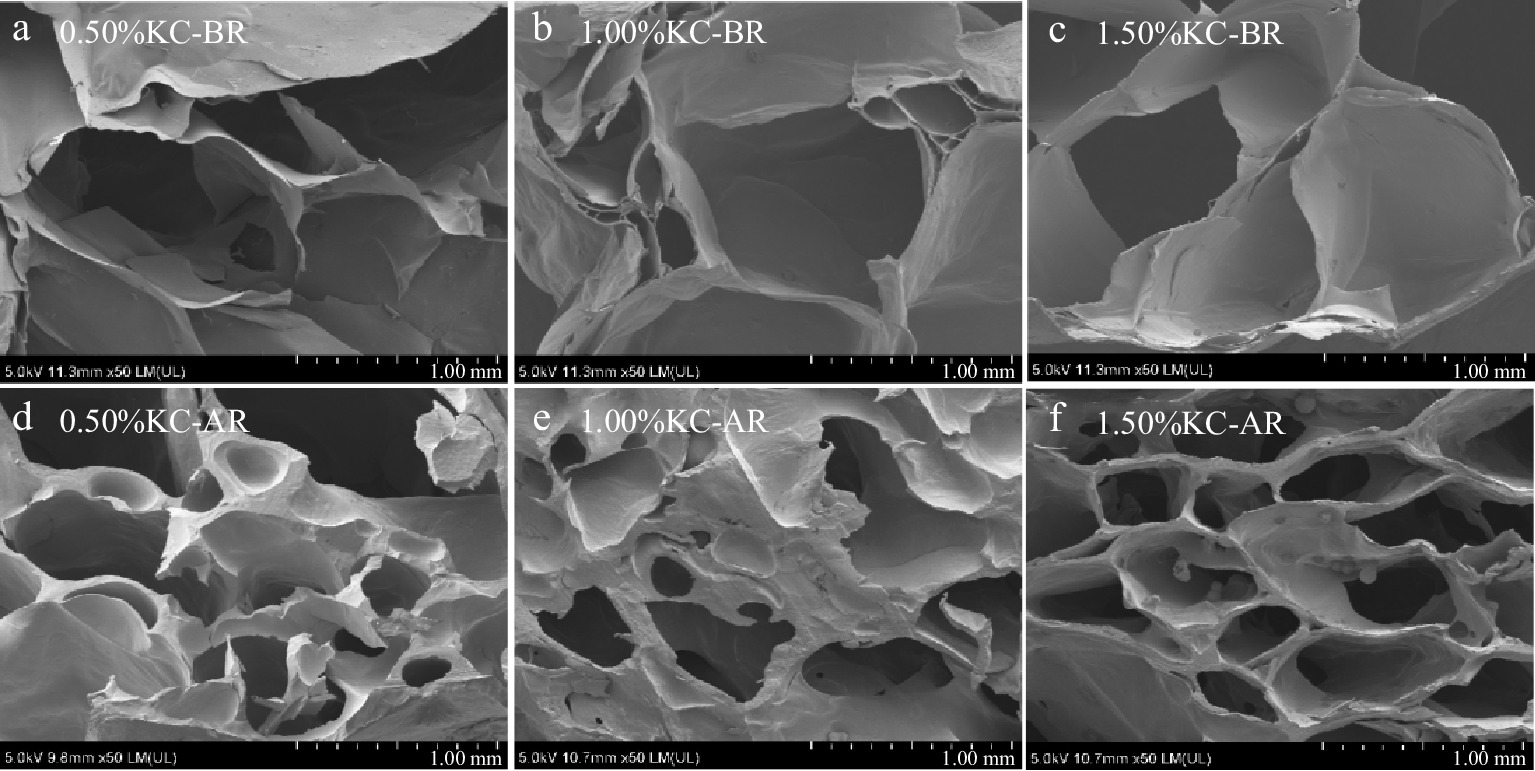
Figure 1.
SEM micrographs at a magnification of ×50 of KC hydrogels.
-

Figure 2.
FTIR spectra of (a) KC-BR and (b) KC-AR.
-
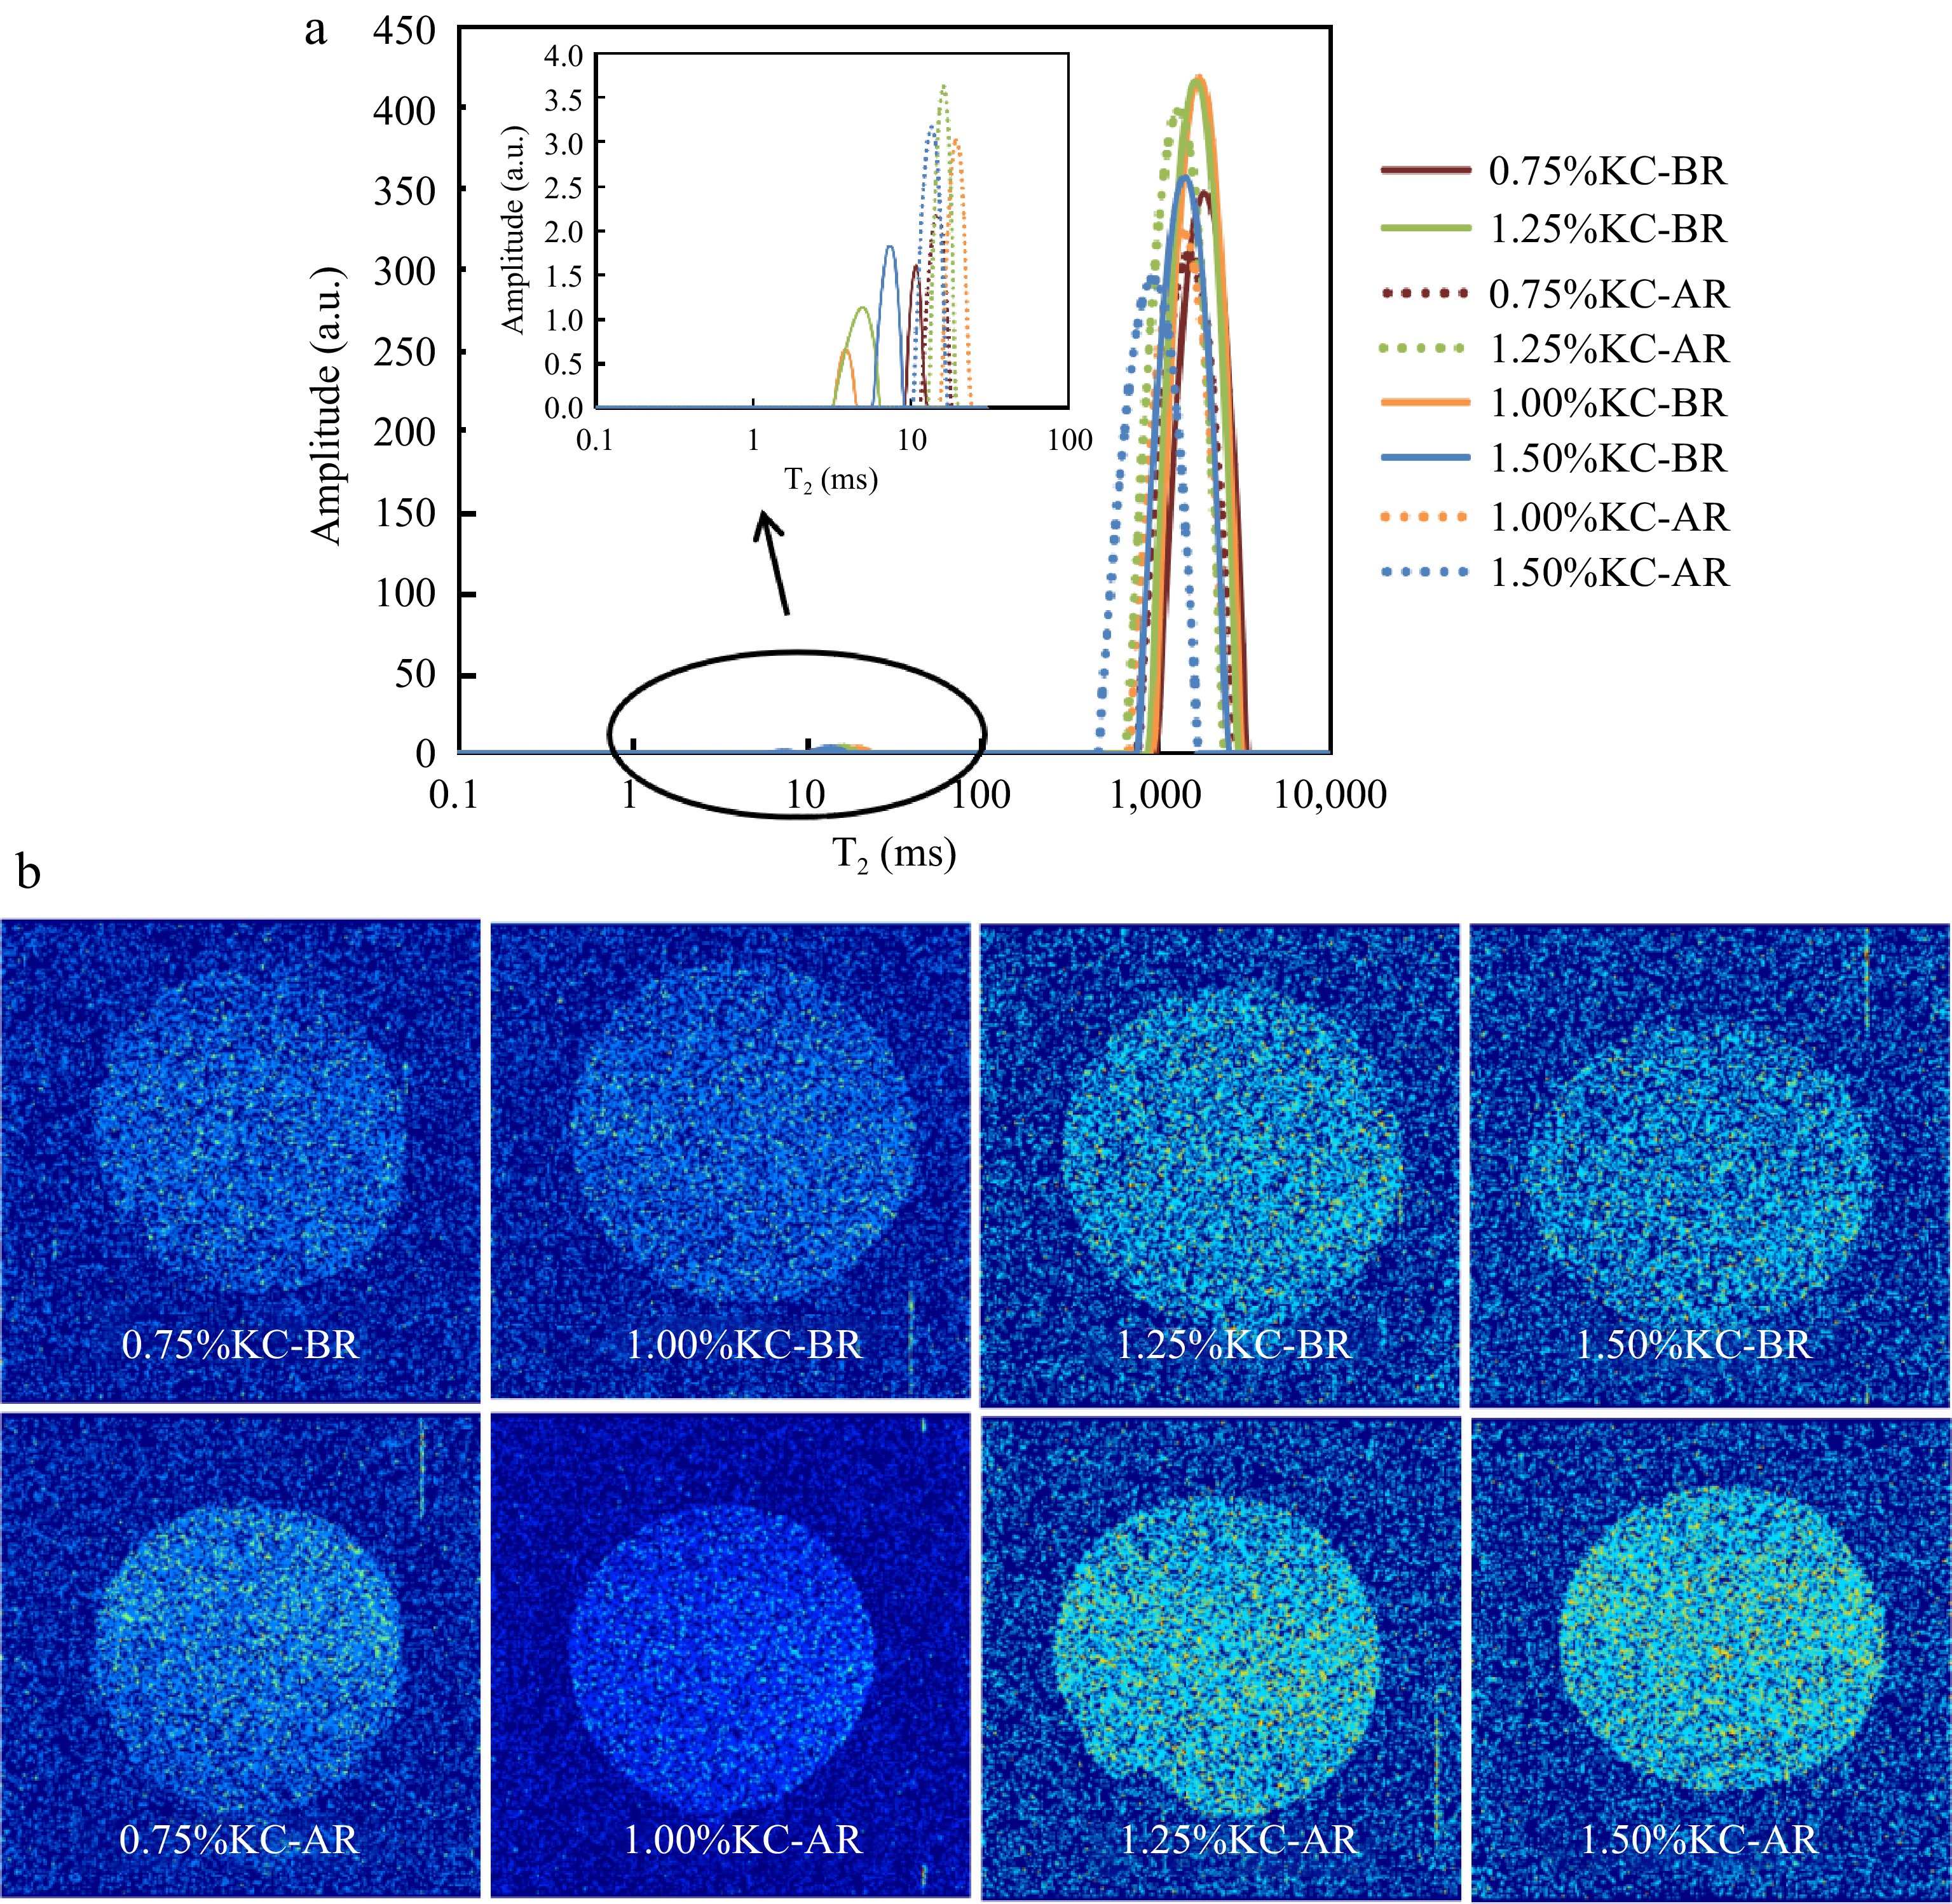
Figure 3.
(a) T2 relaxation distribution curves and (b) pseudo-color MRI images of KC hydrogels.
-

Figure 4.
(a) Hardness, (b) cohesiveness and (c) chewiness of KC hydrogels.
-

Figure 5.
Rheological behavior of (a) KC-BR and (b) KC-AR during strain sweep; rheological behavior of (c) KC-BR and (d) KC-AR during frequency sweep; (e) rheological behavior of KC hydrogels during temperature sweep.
-
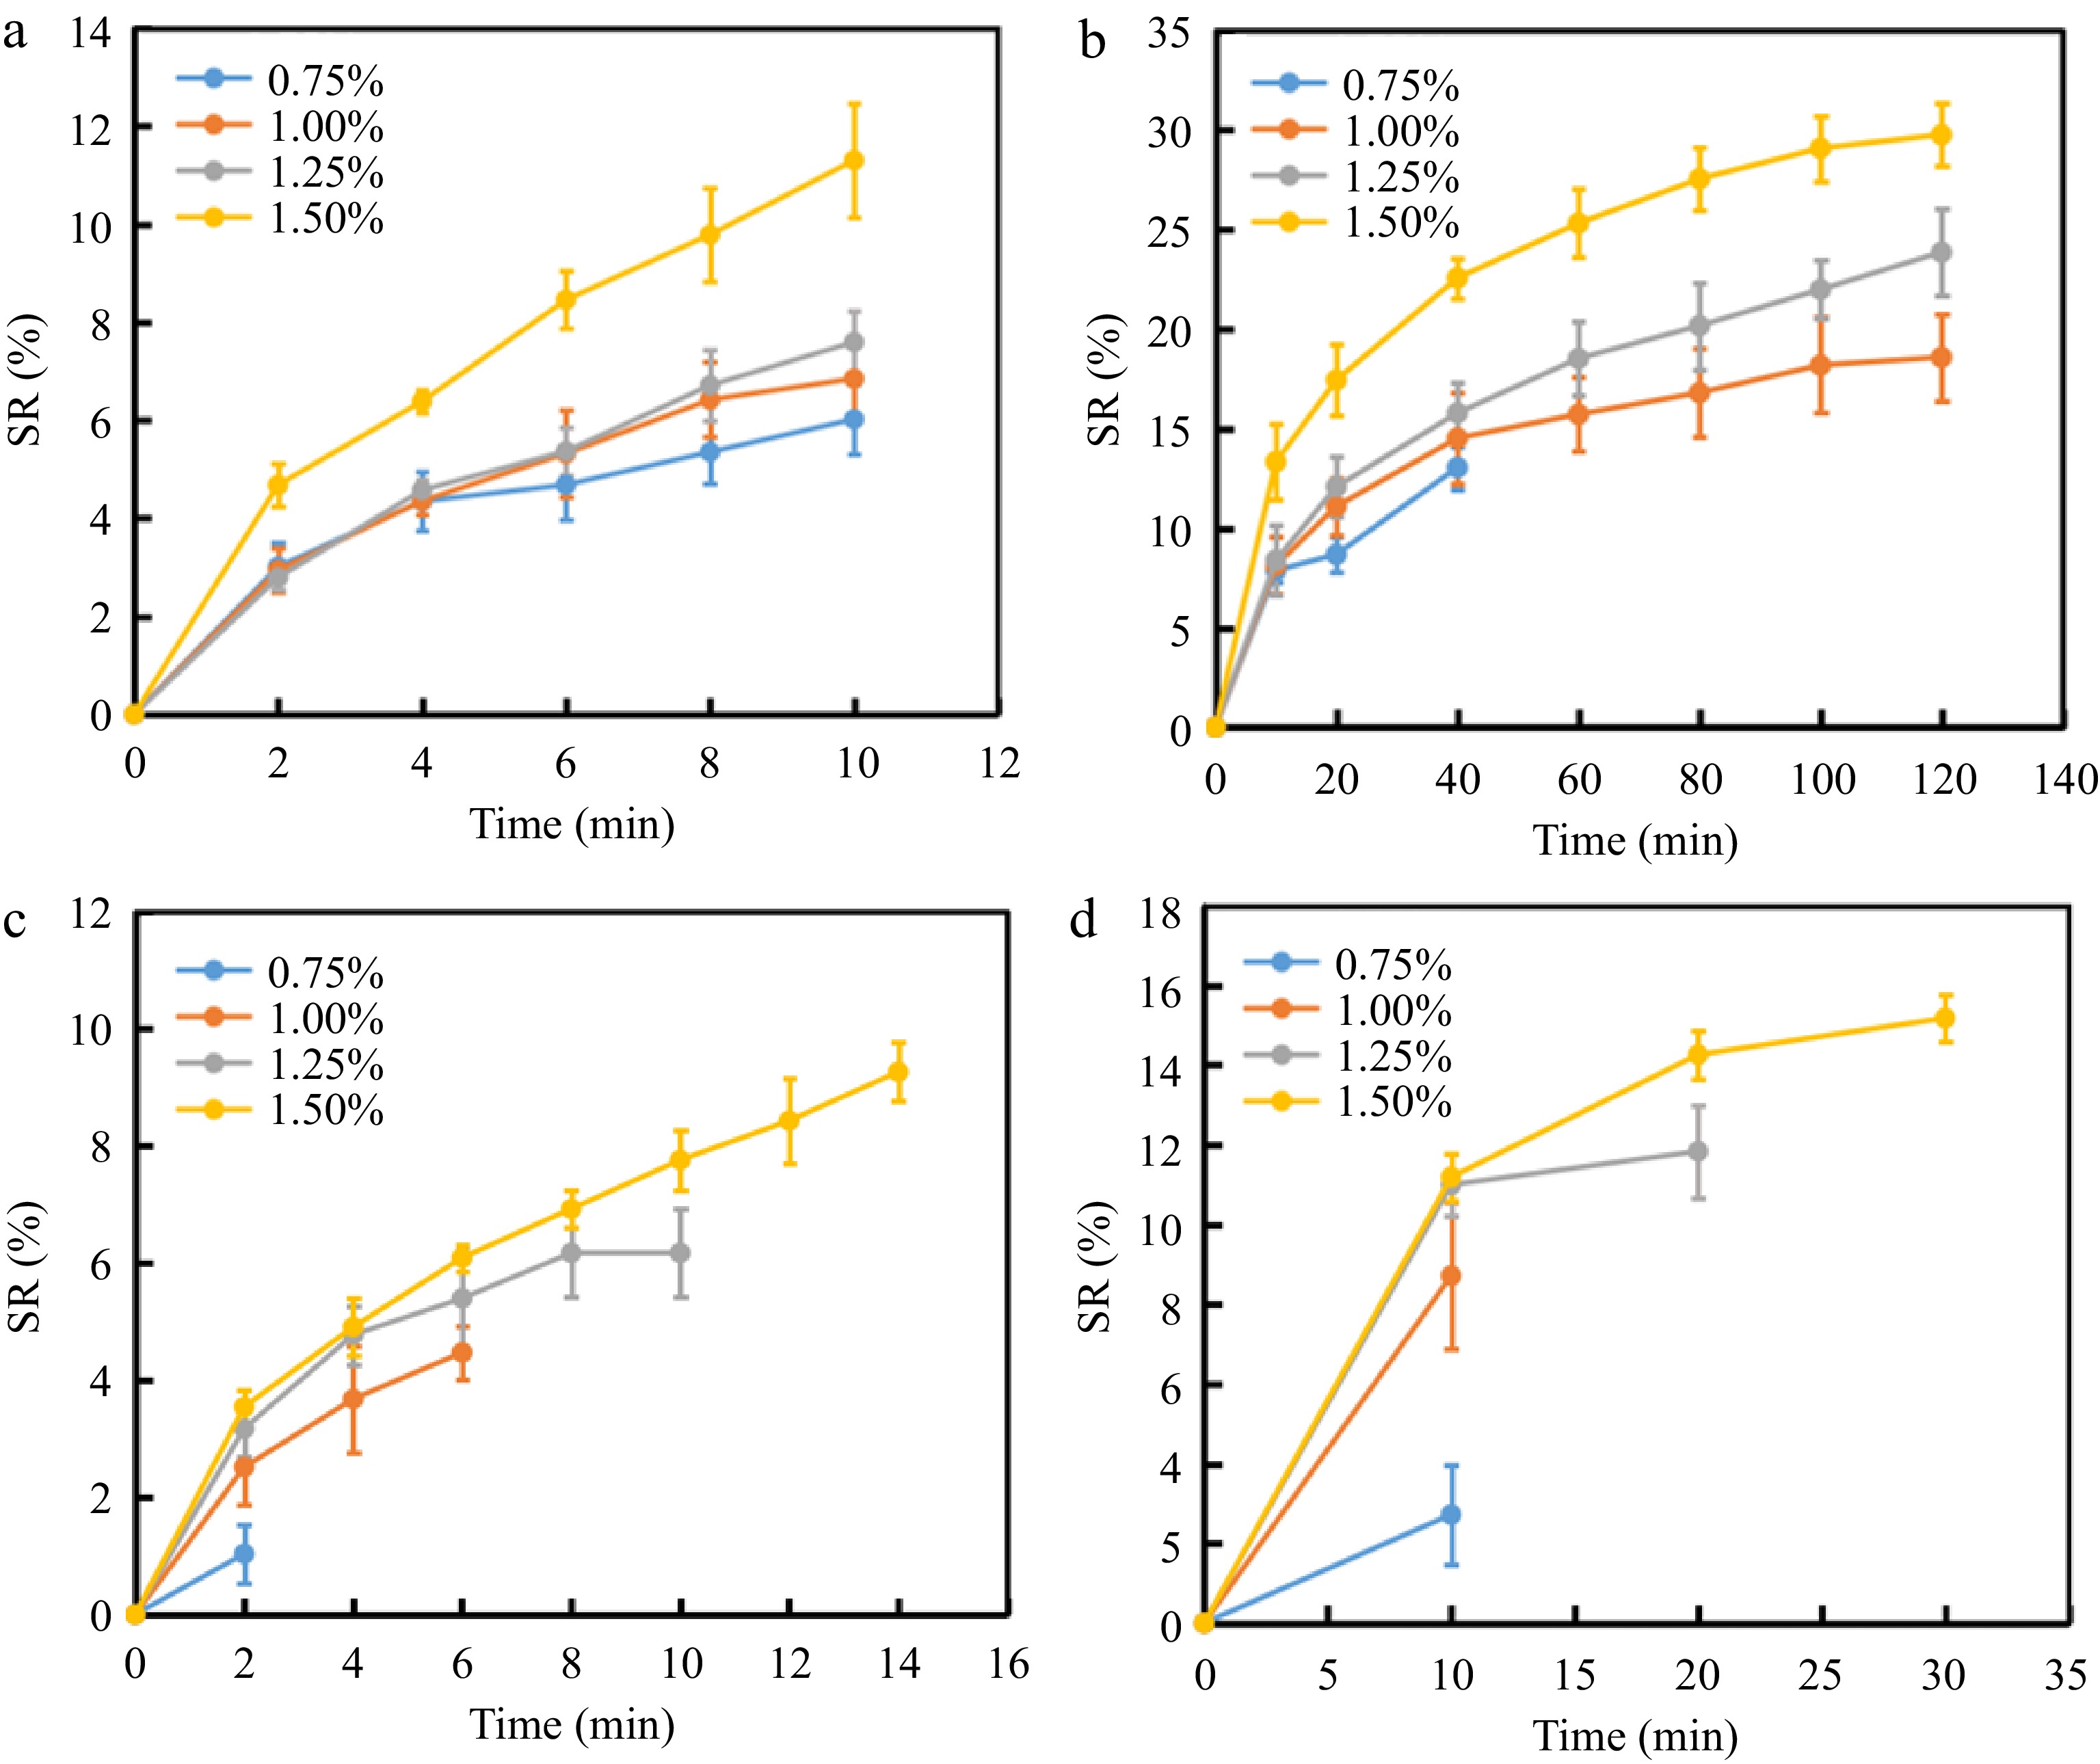
Figure 6.
Swelling ratio of KC-AR. (a) 0−10 min in solution (pH = 7). (b) 0−120 min in solution (pH = 7). (c) Solution (pH = 3). (d) Solution (pH = 11).
-

Figure 7.
Syneresis of (a) KC-BR and (b) KC-AR. Syneresis of (c) KC-BR and (d) KC-AR after freeze-thawing cycle.
-
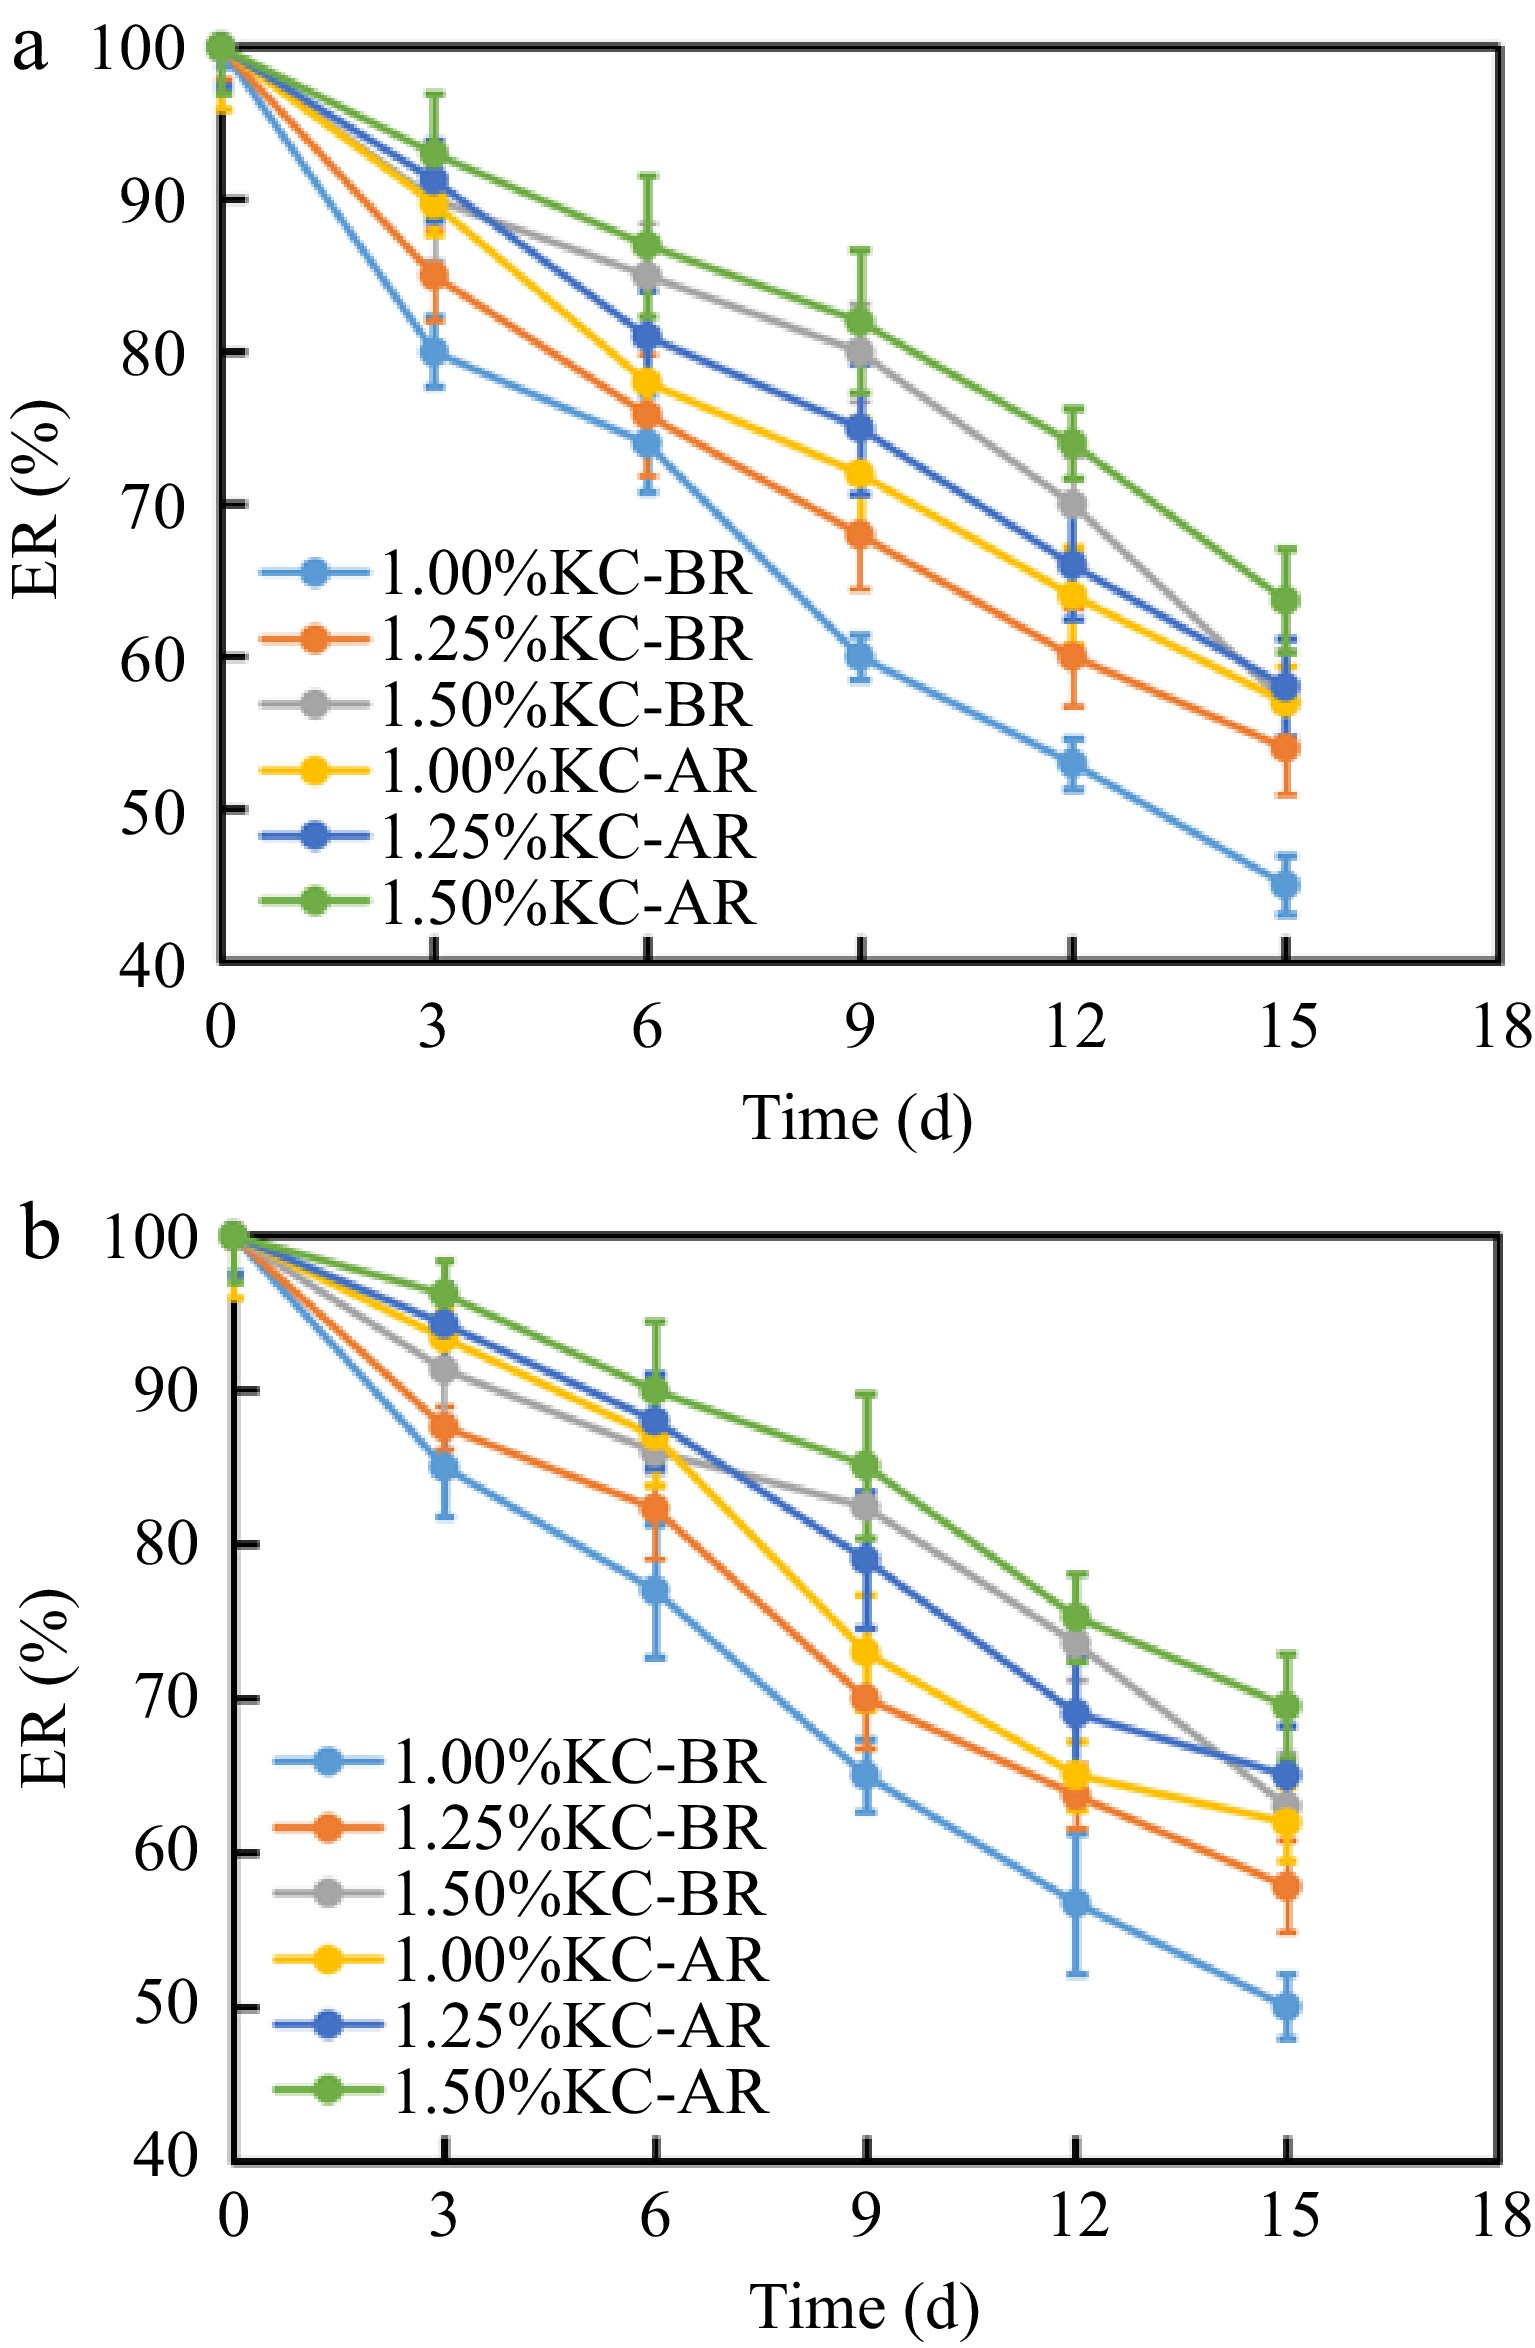
Figure 8.
Retention of EGCG in KC hydrogels at (a) 25 °C and (b) 4 °C.
-
Sample Proportion of peak area P1 (%) P2 (%) 0.75% KC-BR 0.119 99.881 1.00% KC-BR 0.138 99.862 1.25% KC-BR 0.160 99.840 1.50% KC-BR 0.194 99.806 0.75% KC-AR 0.247 99.753 1.00% KC-AR 0.284 99.716 1.25% KC-AR 0.304 99.696 1.50% KC-AR 0.409 99.591 Table 1.
The peak area proportion of KC hydrogels.
Figures
(8)
Tables
(1)