-
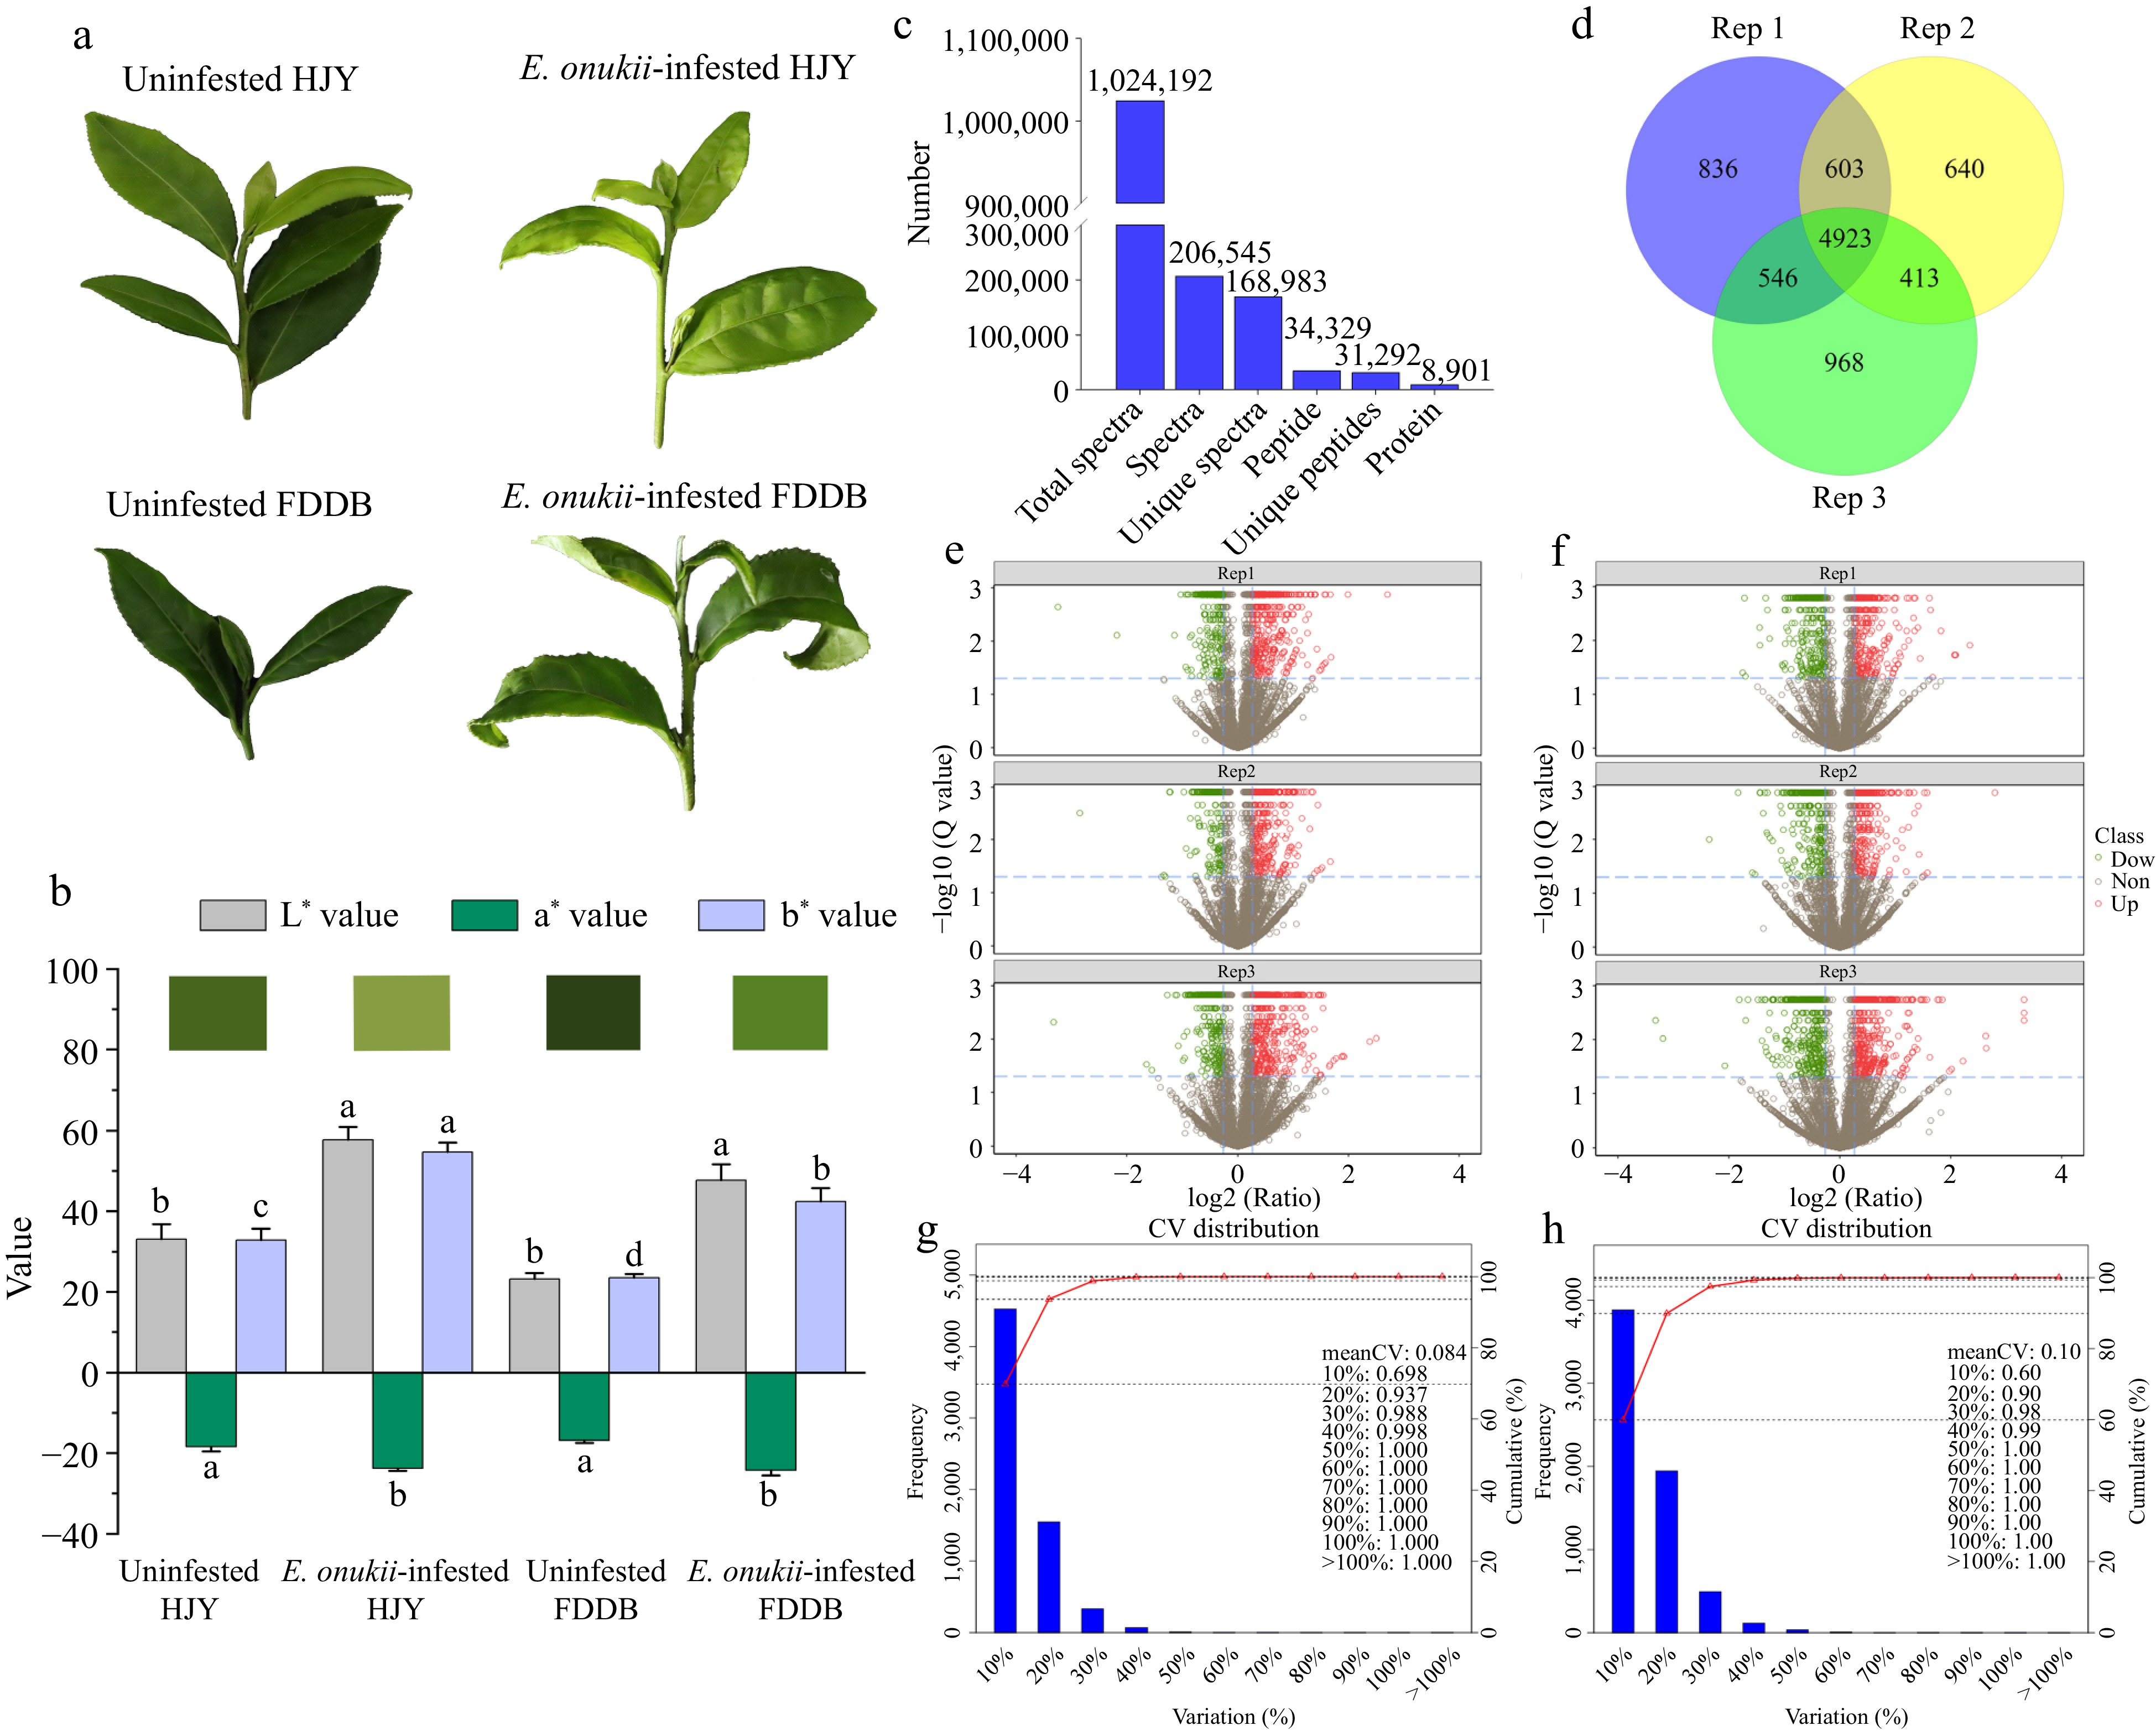
Figure 1.
Identification of DEPs in HJY and FDDB infested with E. onukii. (a) Physiological status of HJY and FDDB before and after E. onukii-infestation. (b) Chromatic aberration of HJY and FDDB leaves under uninfested and after E.onukii-infestation. Note: Different letters indicate significant differences between the different treatments (Tukey's HSD test, p < 0.05). (c) Total number of proteins identified by HJY and FDDB. (d) Number of proteins identified in three biological replicates. (e), (f) Volcano plots of significantly different proteins in three biological replicates in HJY and FDDB. Note: The X-axis of this plot was the protein difference folds (taken as log2) and the Y-axis was the corresponding -log10 (Q value). Q value < 0.05 and Fold change > 1.3 were the screening conditions for significantly different proteins. Red dots in the graph are up-regulated significantly proteins, green dots are down-regulated significantly proteins, and gray dots were proteins with no significant change. (g), (h) Coefficient of variation of protein analysis in HJY and FDDB.
-
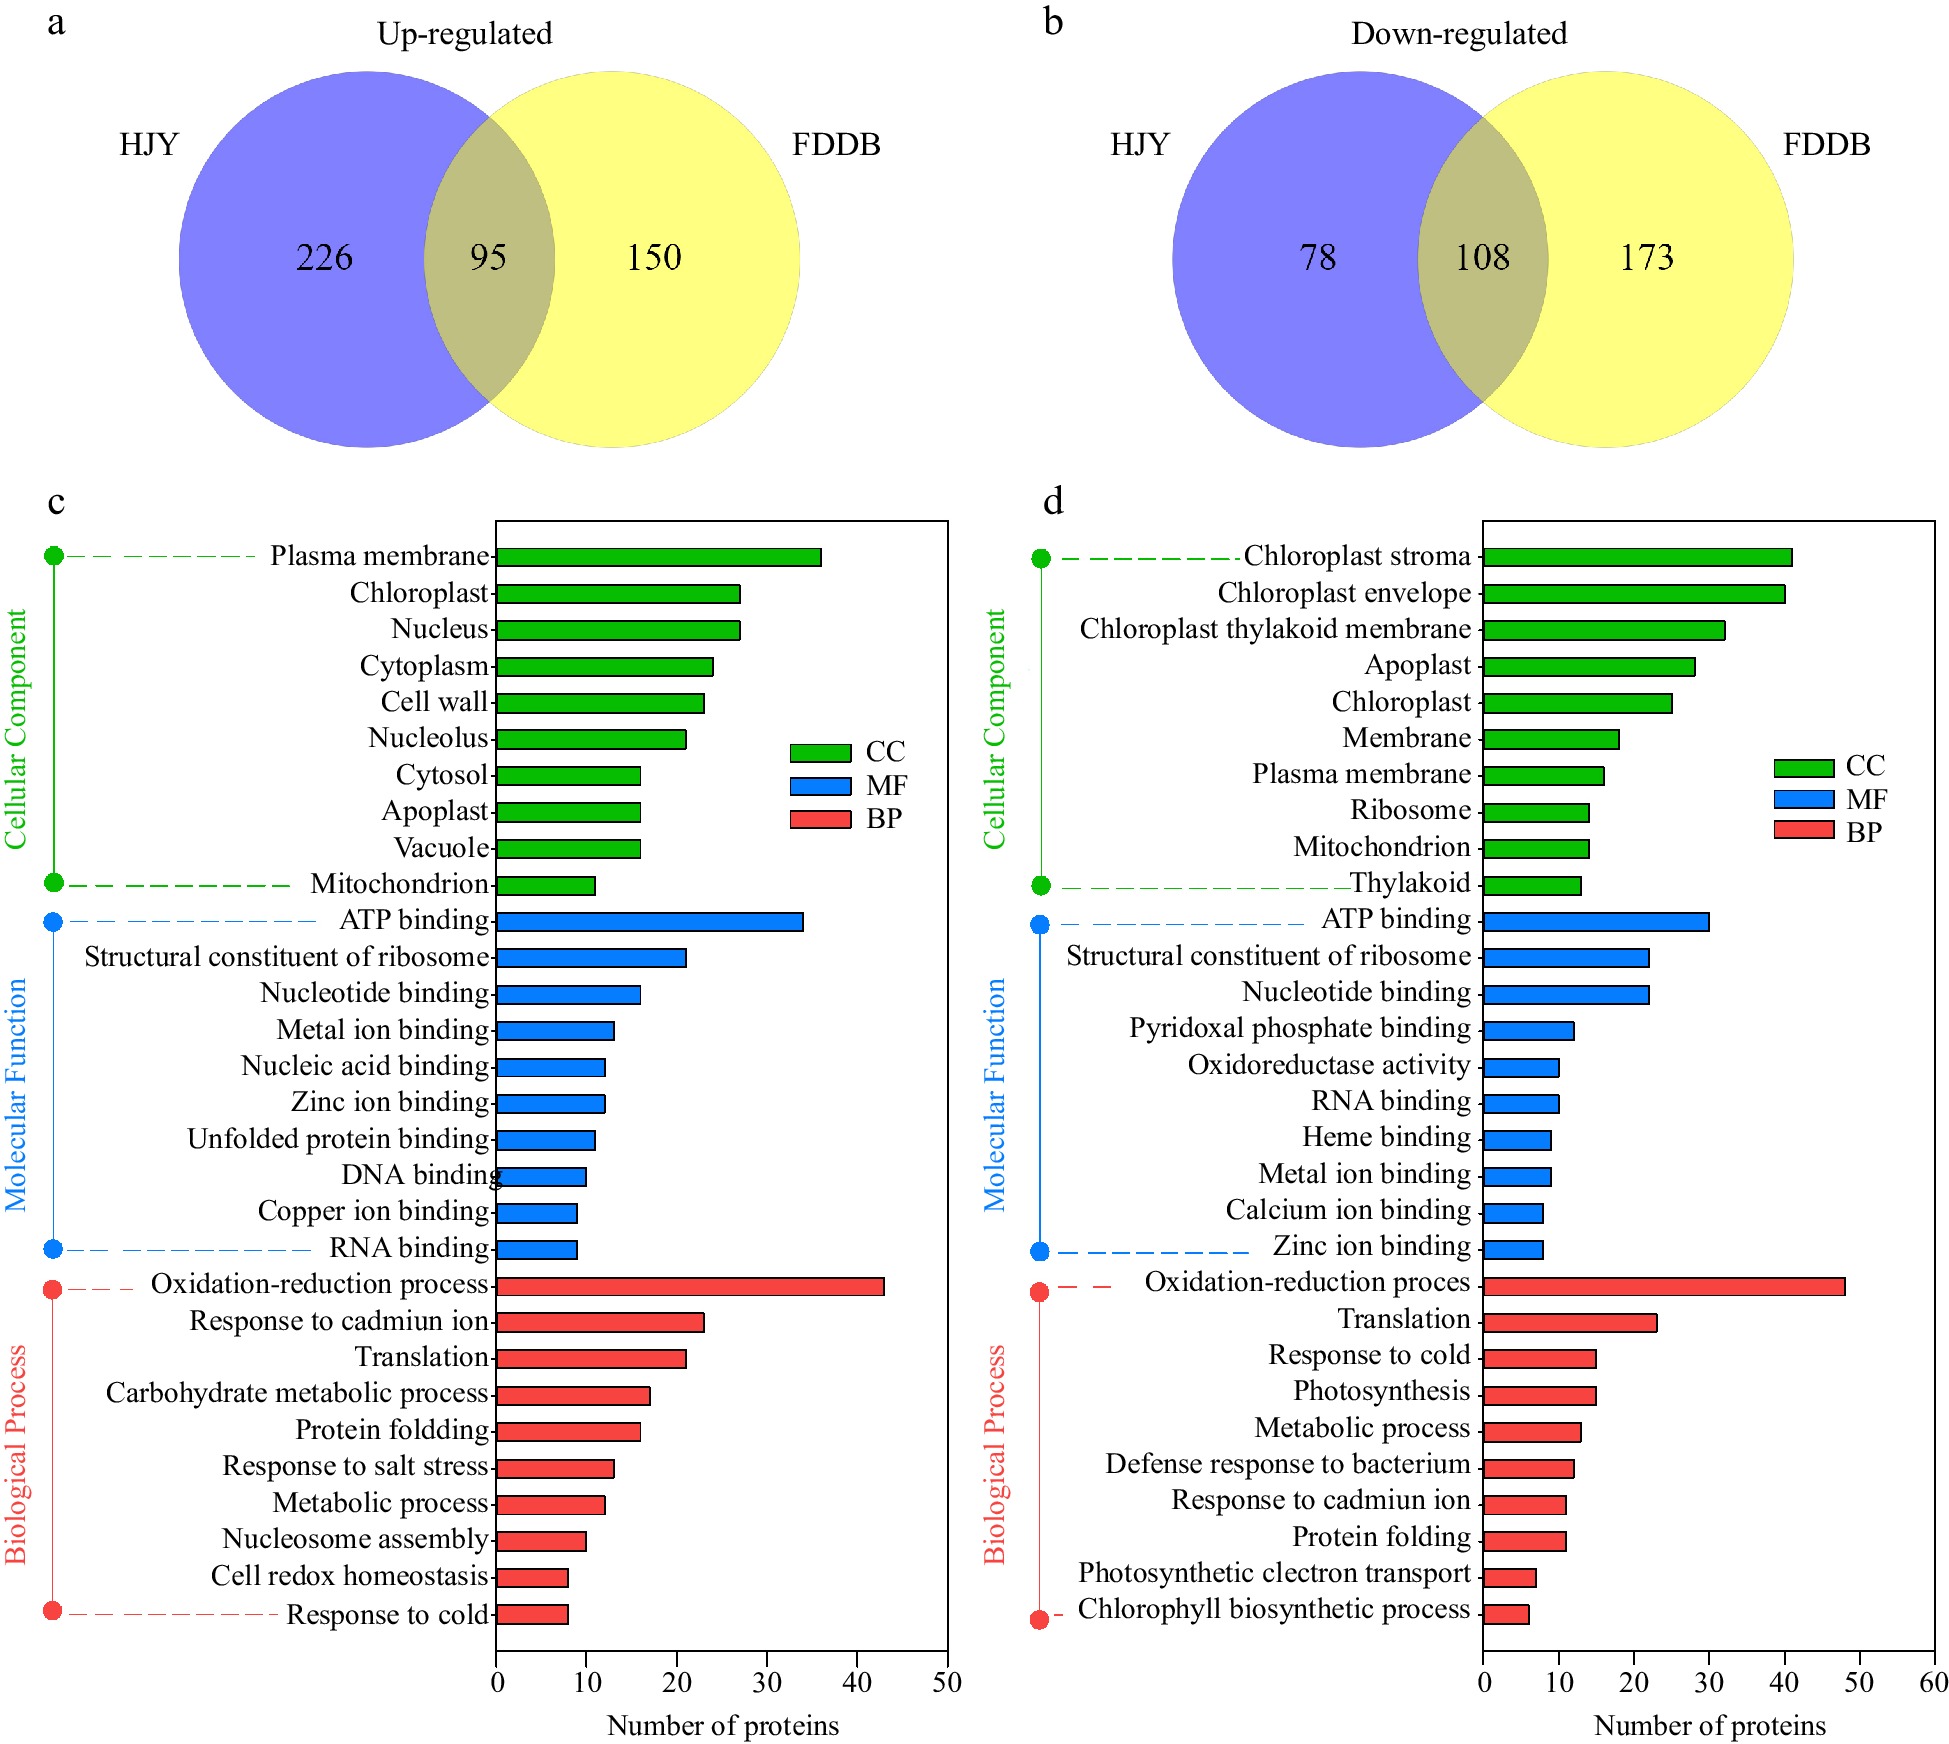
Figure 2.
GO annotation analysis of DEPs in HJY and FDDB infested with E. onukii. (a) Venn diagram of up-regulated significantly expressed proteins (1.3-fold) in HJY and FDDB. (b) Venn diagram of down-regulated significantly expressed proteins (0.77-fold) in HJY and FDDB. (c) GO analysis of 95 co-upregulated proteins. (d) GO analysis of 108 co-downregulated proteins.
-
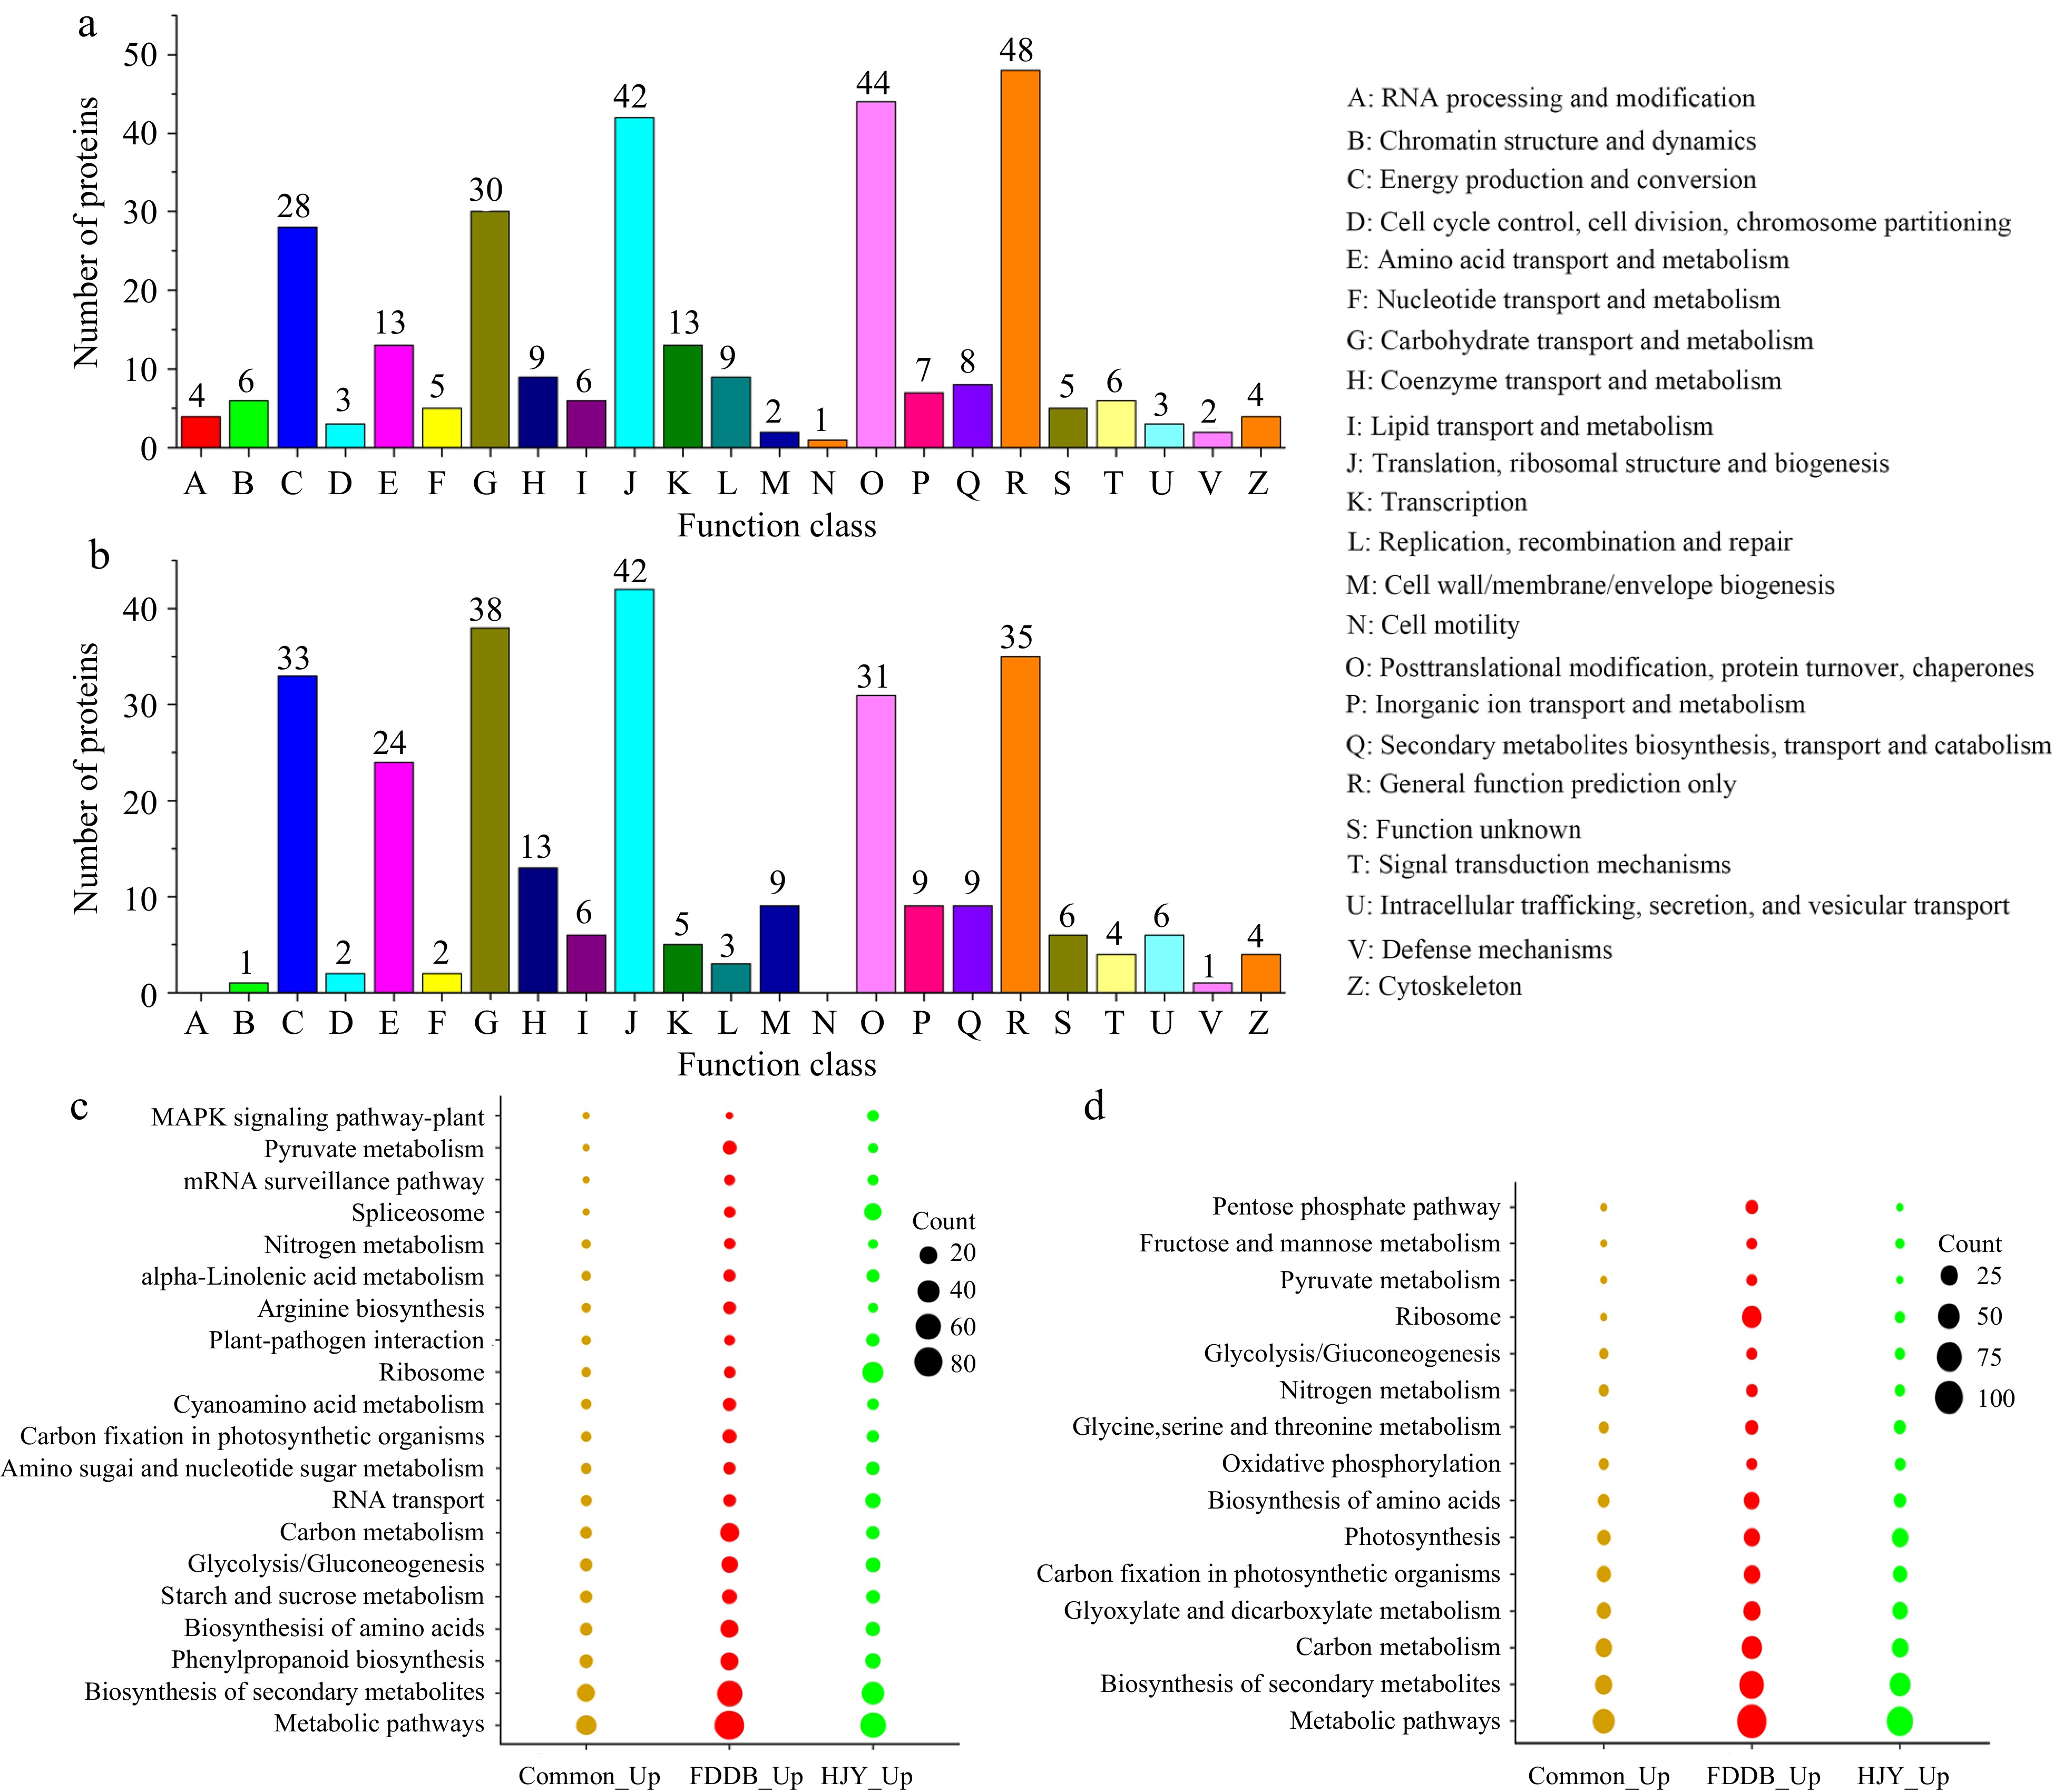
Figure 3.
COG analysis and KEGG enrichment analysis of DEPs in HJY and FDDB infested with E. onukii. (a) COG analysis of up-regulated significantly expressed proteins (1.3-fold). (b) COG analysis of down-regulated significantly expressed proteins (0.77-fold). (c) KEGG enrichment analysis of up-regulated significantly expressed proteins (1.3-fold). (d) KEGG enrichment analysis of down-regulated significantly expressed proteins (0.77-fold).
-
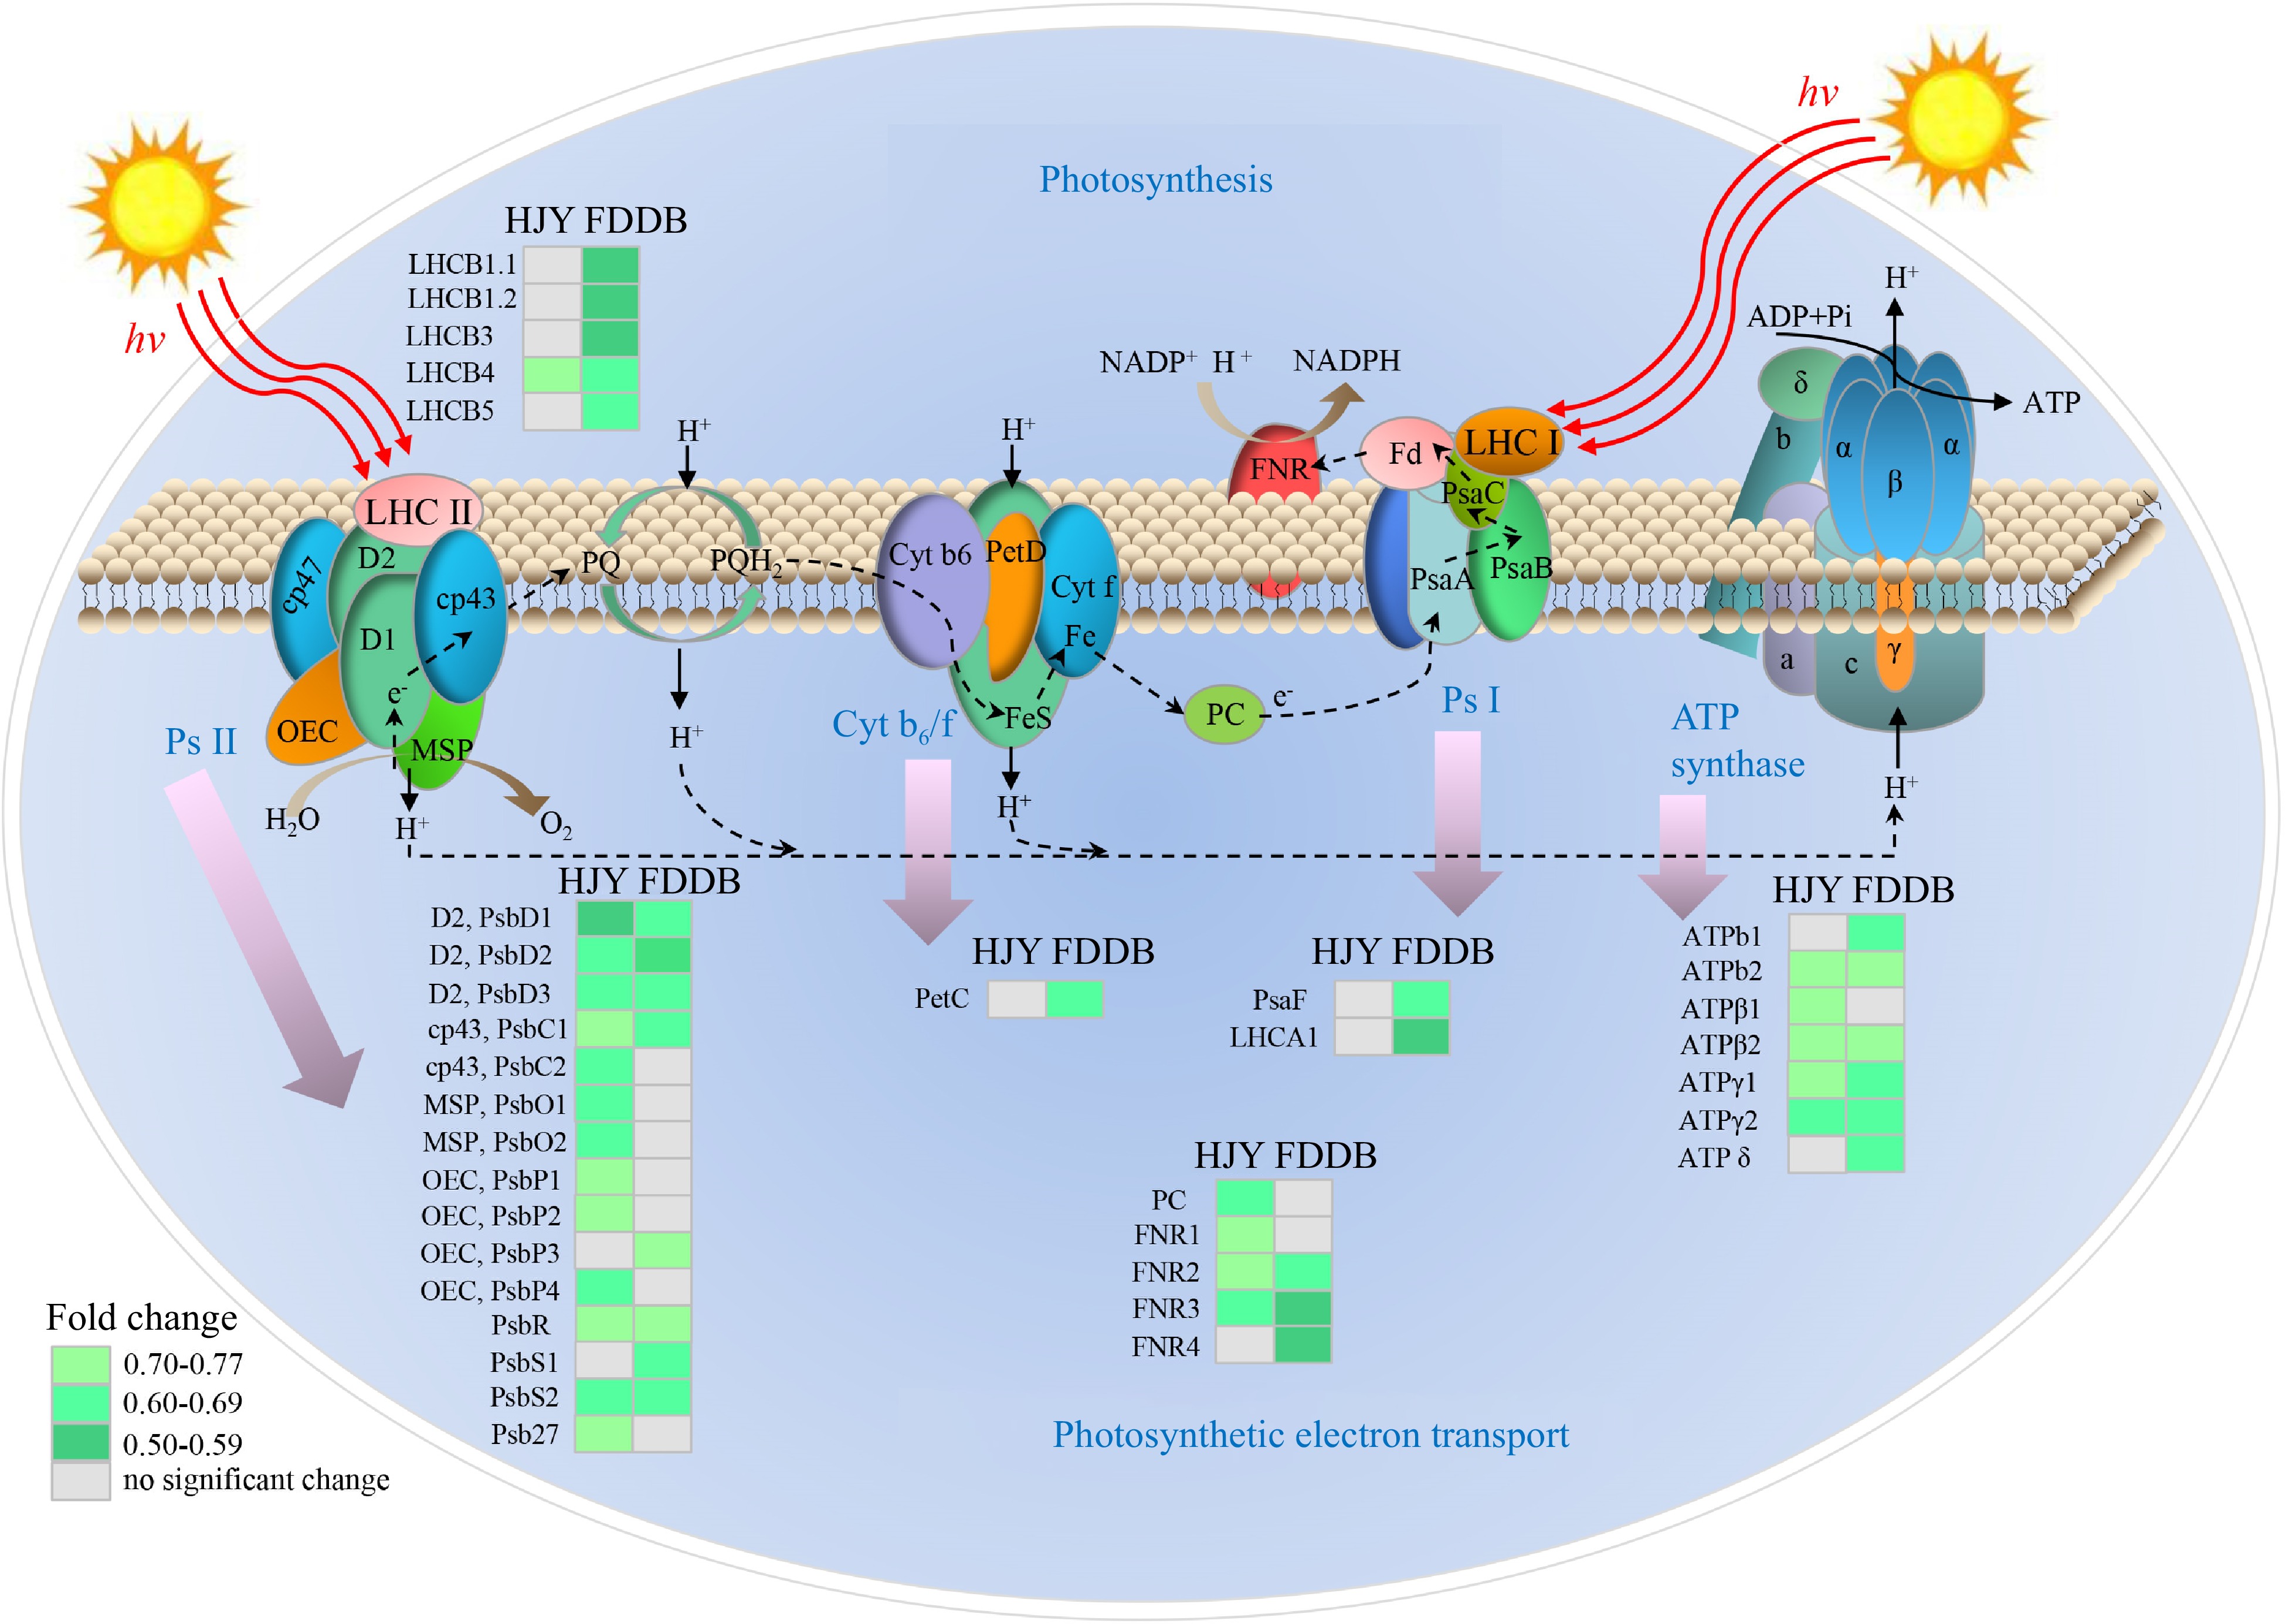
Figure 4.
Analysis of DEPs in the photosynthetic pathway of HJY and FDDB infested with E. onukii. Note: The multiplicative changes of DEP are presented in different colors, green represents down-regulation; gray represents no significant difference. LHC: Light harvesting complex; Psa: Photosynthetic apparatus; Psb: Photosynthetic bacteria; PC: Plastocyanin; FNR: Ferredoxin-NADP + Oxidoreductase; ATP: Adenosine 5'-triphosphate; Pet: Photoinduced electron transfer; Cyt b6/f: Cytochrome b6-f complex; Ps I: Photosystem I; Ps II: Photosystem II; OEC: Oxygen-evolving center; MSP: Manganese stabilizing protein; PQ: Plastoquinone; ADP: Adenosine-diphosphate; NADPH: Nicotinamide adenine dinucleotide phosphate. The serial numbers of the protein names in the figure are shown in Supplemental Table S6.
-
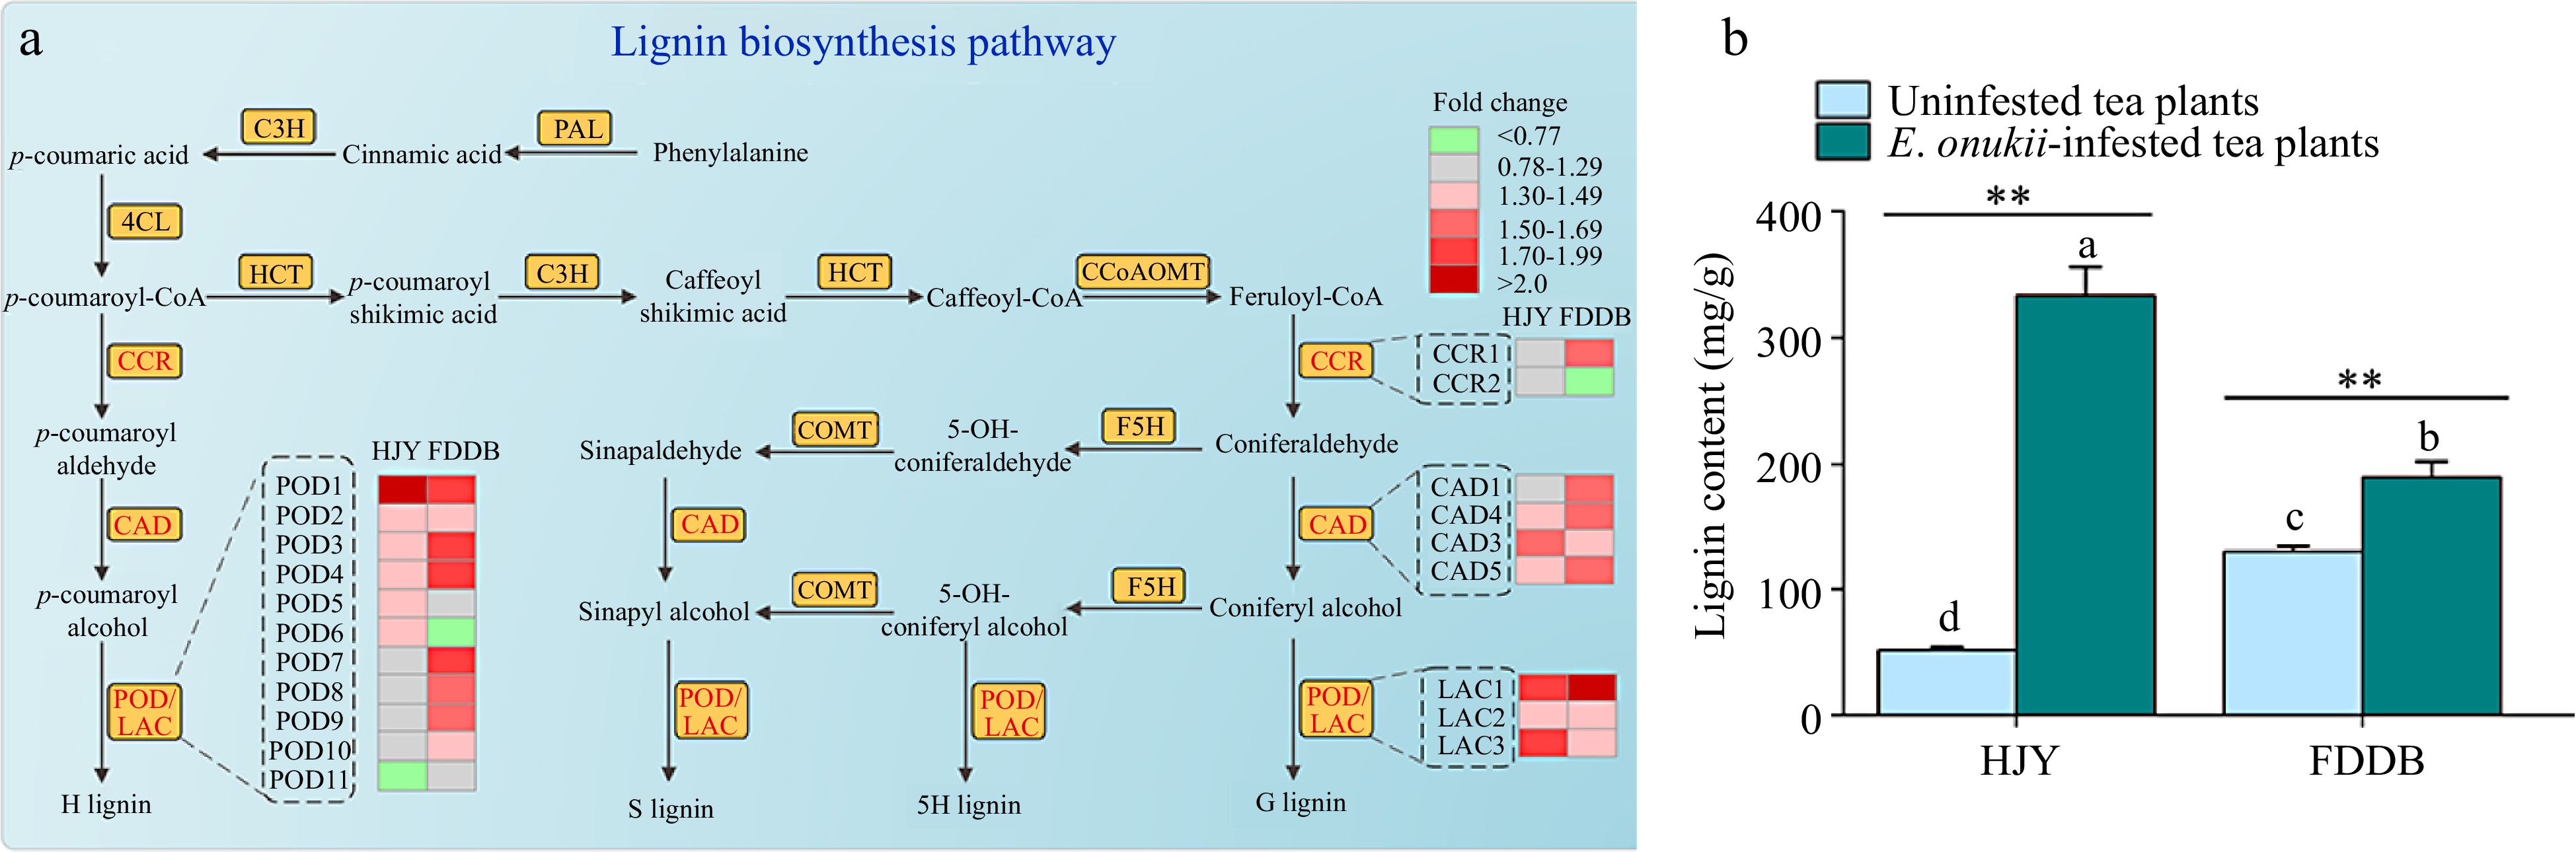
Figure 5.
Effect of E. onukii infestation on lignin synthesis in HJY and FDDB. (a) Analysis of DEPs in the lignin biosynthesis pathway of HJY and FDDB infested with E. onukii. Note: The multiplicative changes of DEPs were presented in different colors, green indicated down-regulated DEPs; red indicated up-regulated DEPs; and gray indicated proteins with no significant difference. POD: Peroxidase; CCR: Cinnamoyl-CoAreductase; CAD: Cinnamyl-alcohol dehydrogenase; LAC: Laccase; HCT: Hydroxycinnamoyl transferase; C3H: Coumaric acid3-Hydroxylase; C4H: Cinnamic acid-4-hydroxylase; COMT: Catechol O-methyltransferase; F5H: Ferulate 5-hydroxylase; CCoAOMT: Caffeoyl-CoA 3-O-methyltransferase; G lignin: guaiacyl-type lignin; 5H lignin: 5-Hydroxy-guaiacyl lignin; S lignin: Syringyl monolignol lignin; H lignin: p-hydroxyphenyl lignin. The serial numbers of the protein names in the figure are shown in Supplemental Table S6. (b) Lignin content of two tea cultivars before and after E. onukii infestation. Note: Different letters indicate significant differences between the different treatments (Tukey' s HSD test, p < 0.05). Asterisks designate a significant difference between control and E. onukii-infested plants of the same cultivar (independent samples t-test, p < 0.01).
-
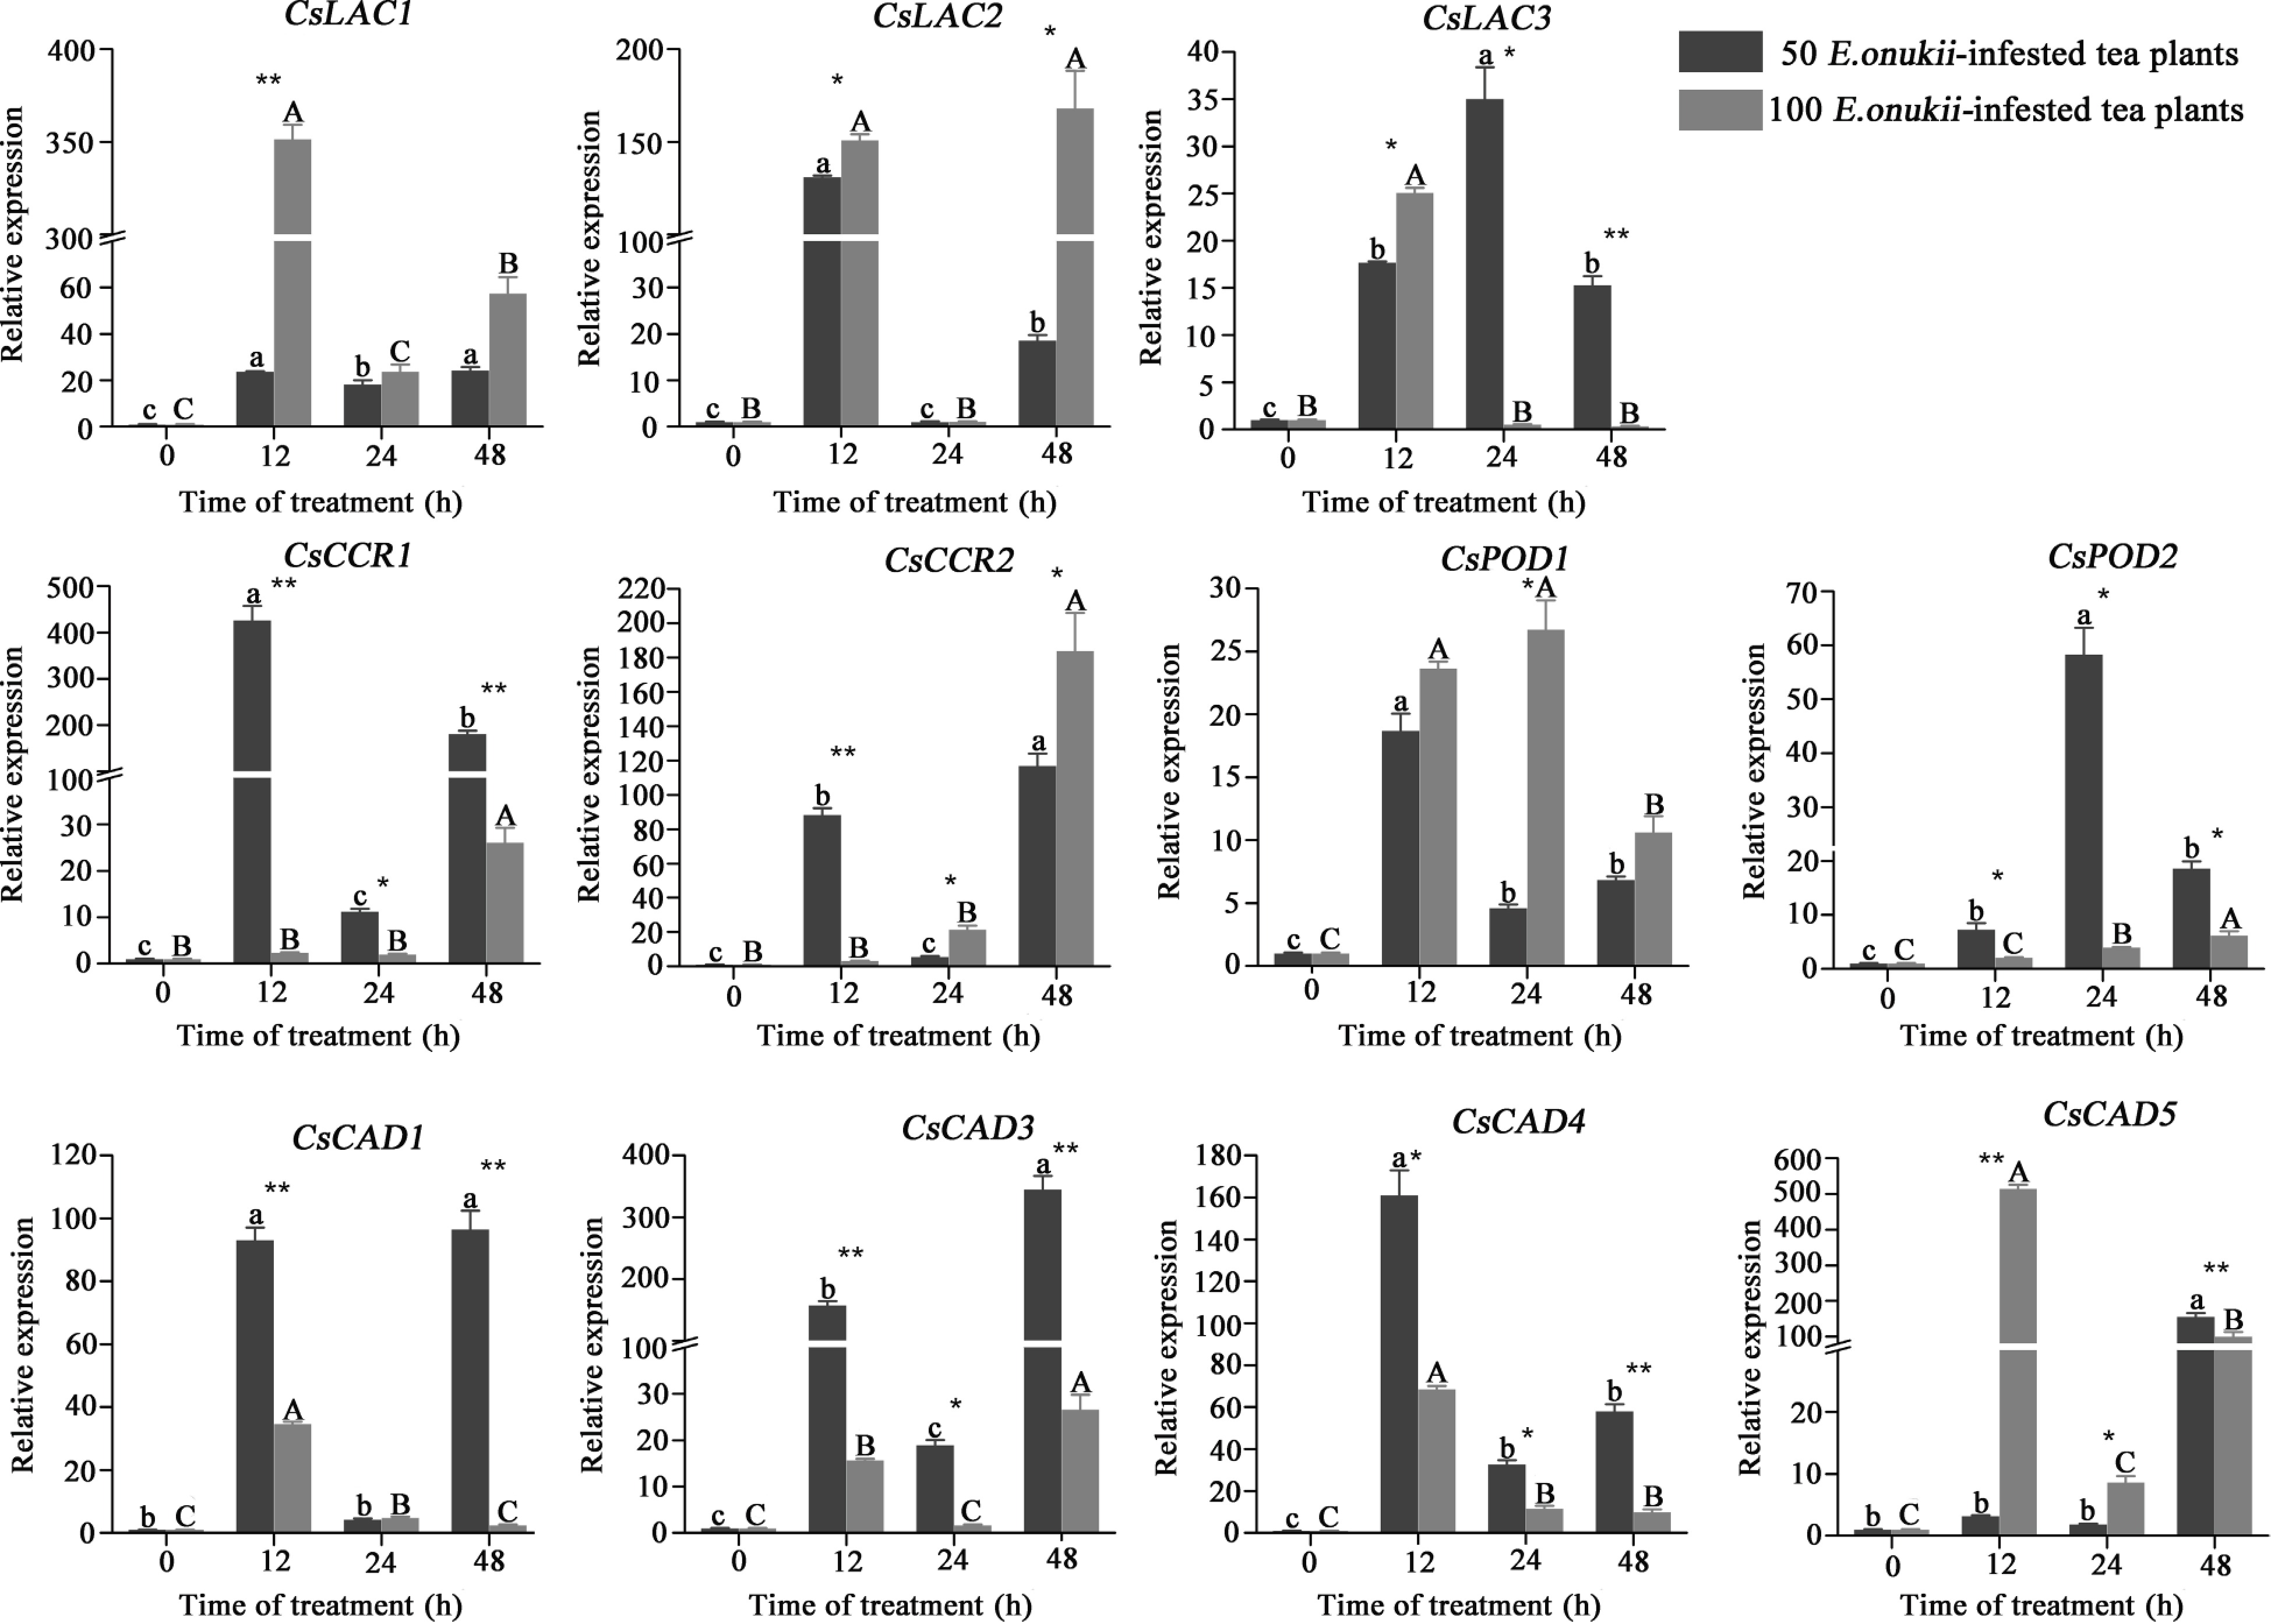
Figure 6.
Expression of differential protein-coding genes in tea plants infested by E. onukii at two different densities. Note: Different lowercase letters indicate the differences between diverse times under 50 E. onukii-infested treatment, and different capital letters indicate the differences between diverse times under 100 E. onukii-infested treatment. Asterisk indicates a significant group difference on expression levels of genes at different densities, * indicates p ≤ 0.05, ** indicates p ≤ 0.01. Transcriptional expression level of differential protein-coding genes in tea plants after E. onukii feeding, and sampling time was 0, 12, 24 and 48 h. Light gray represents the tea plants fed by 100 E. onukii, as the high-density E. onukii-infested tea plant treatments; dark gray represents the tea plants fed by 50 E. onukii, as the low-density E. onukii-infested tea plant treatments.
Figures
(6)
Tables
(0)