-
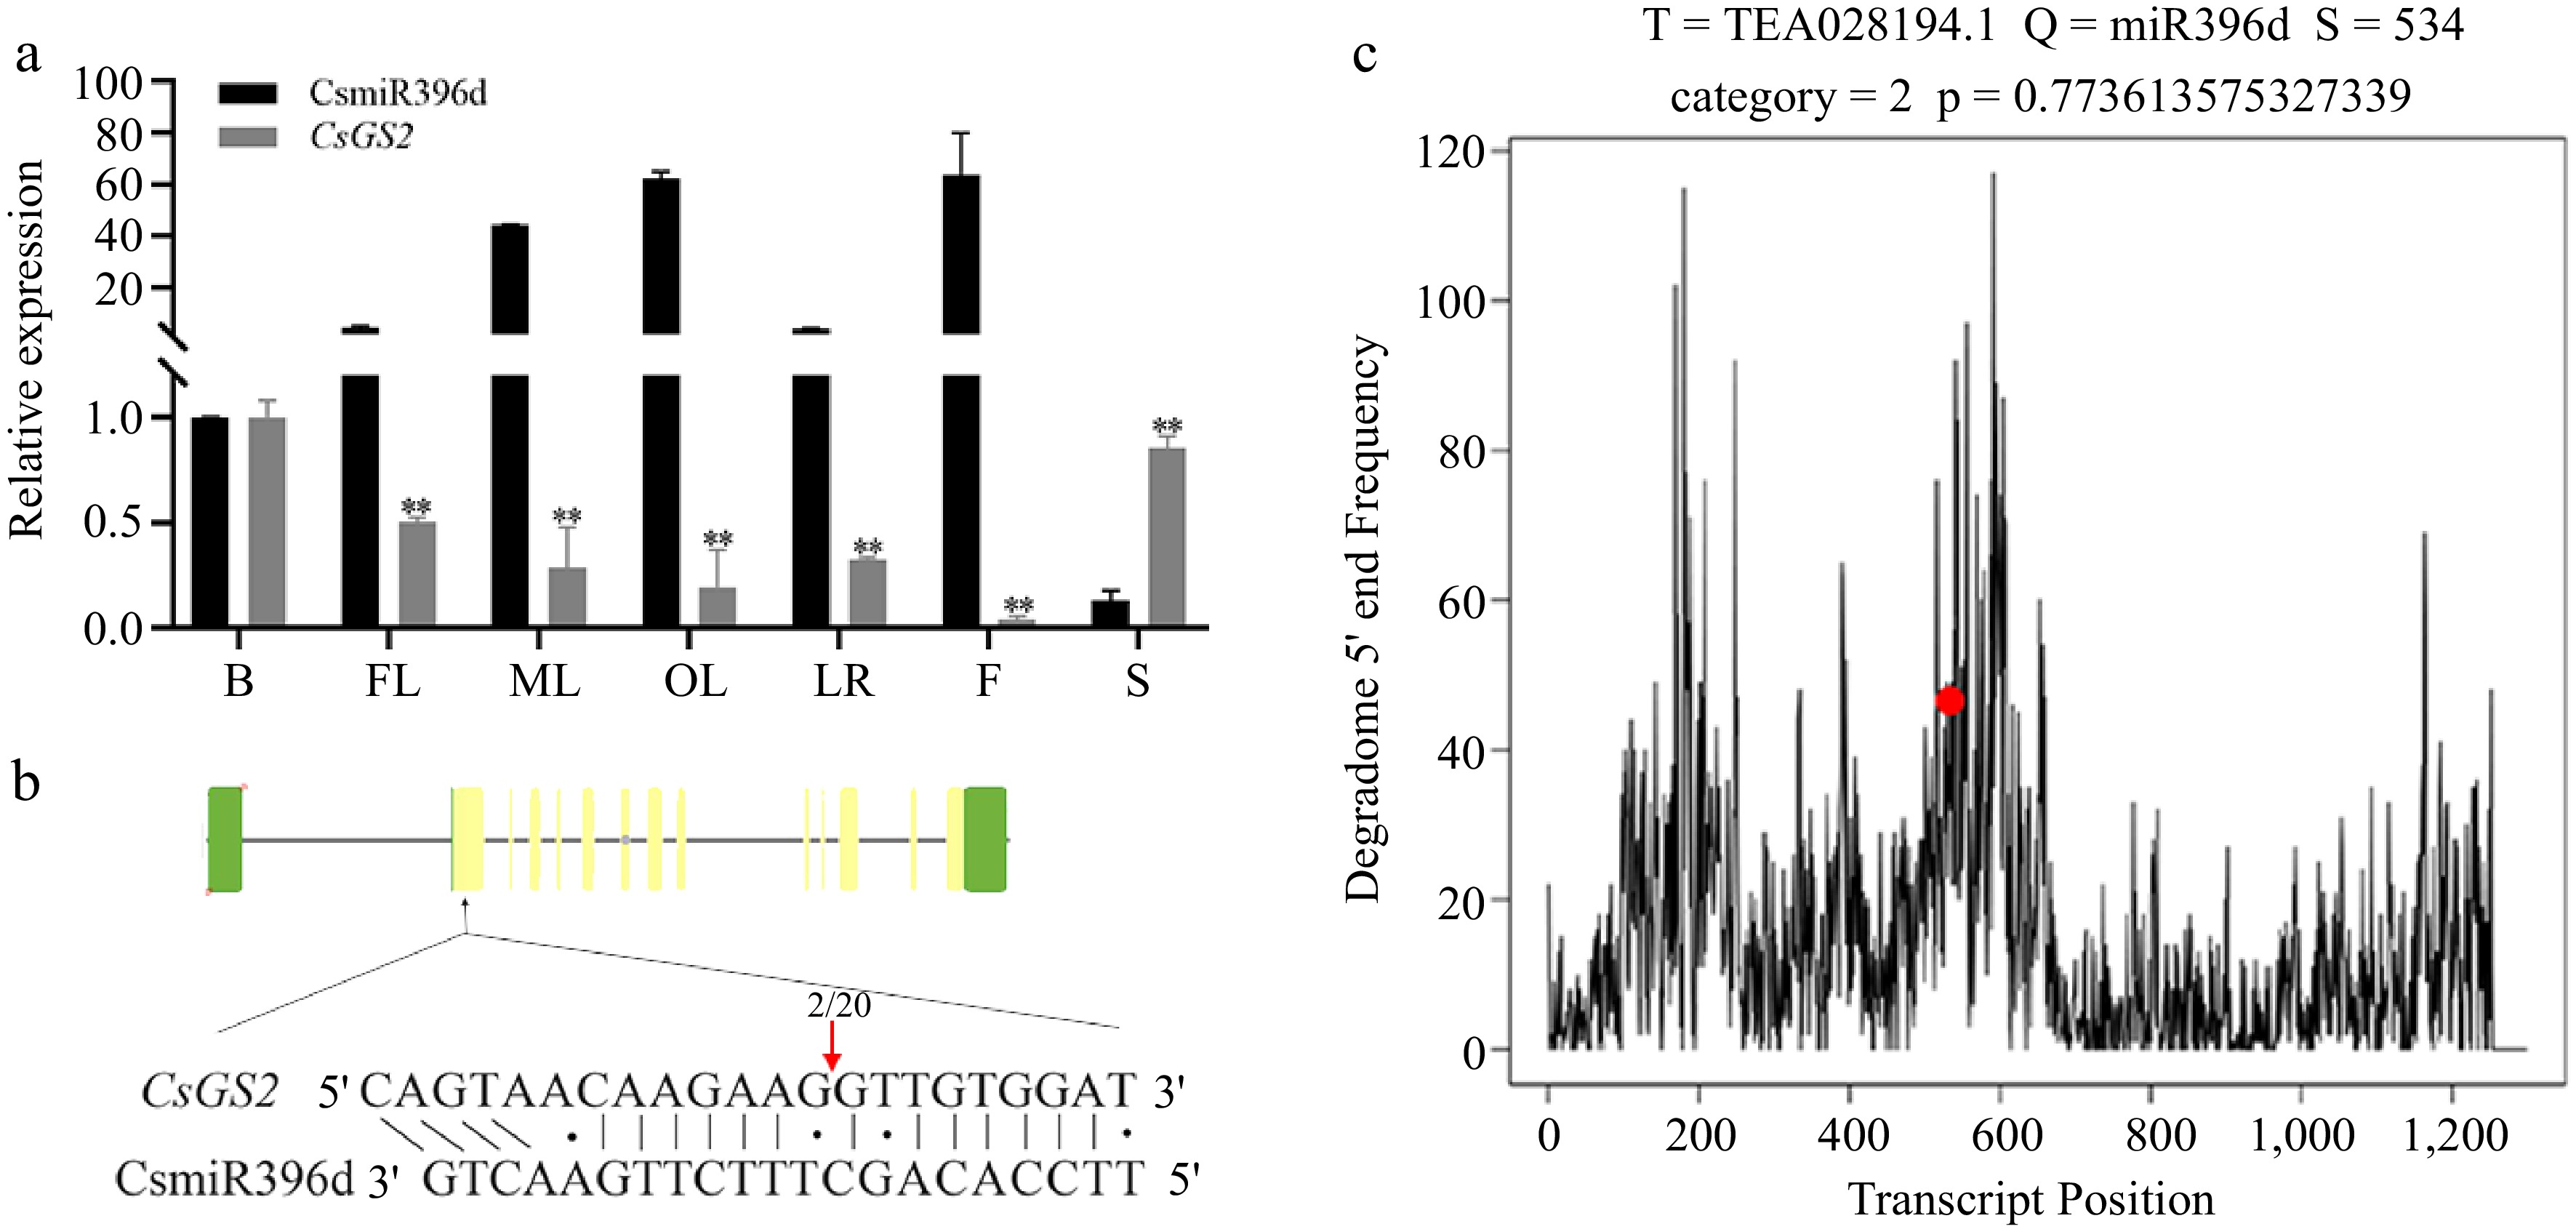
Figure 1.
Expression and relationship of CsmiR396d and CsGS2 of tea plant. (a) Expression of CsmiR396d and CsGS2 in seven tissues. B, bud; FL, first leaf; ML, mature leaf; OL, old leaf; LR, lateral root; F, flower; S, seed. (b) 5'RLM-RACE experiment. The frequency of clone corresponding to the cleavage site (arrow) is shown as a fraction, with the number of clones matching the target message in the denominator. (c) T-plot of degradome sequencing.
-
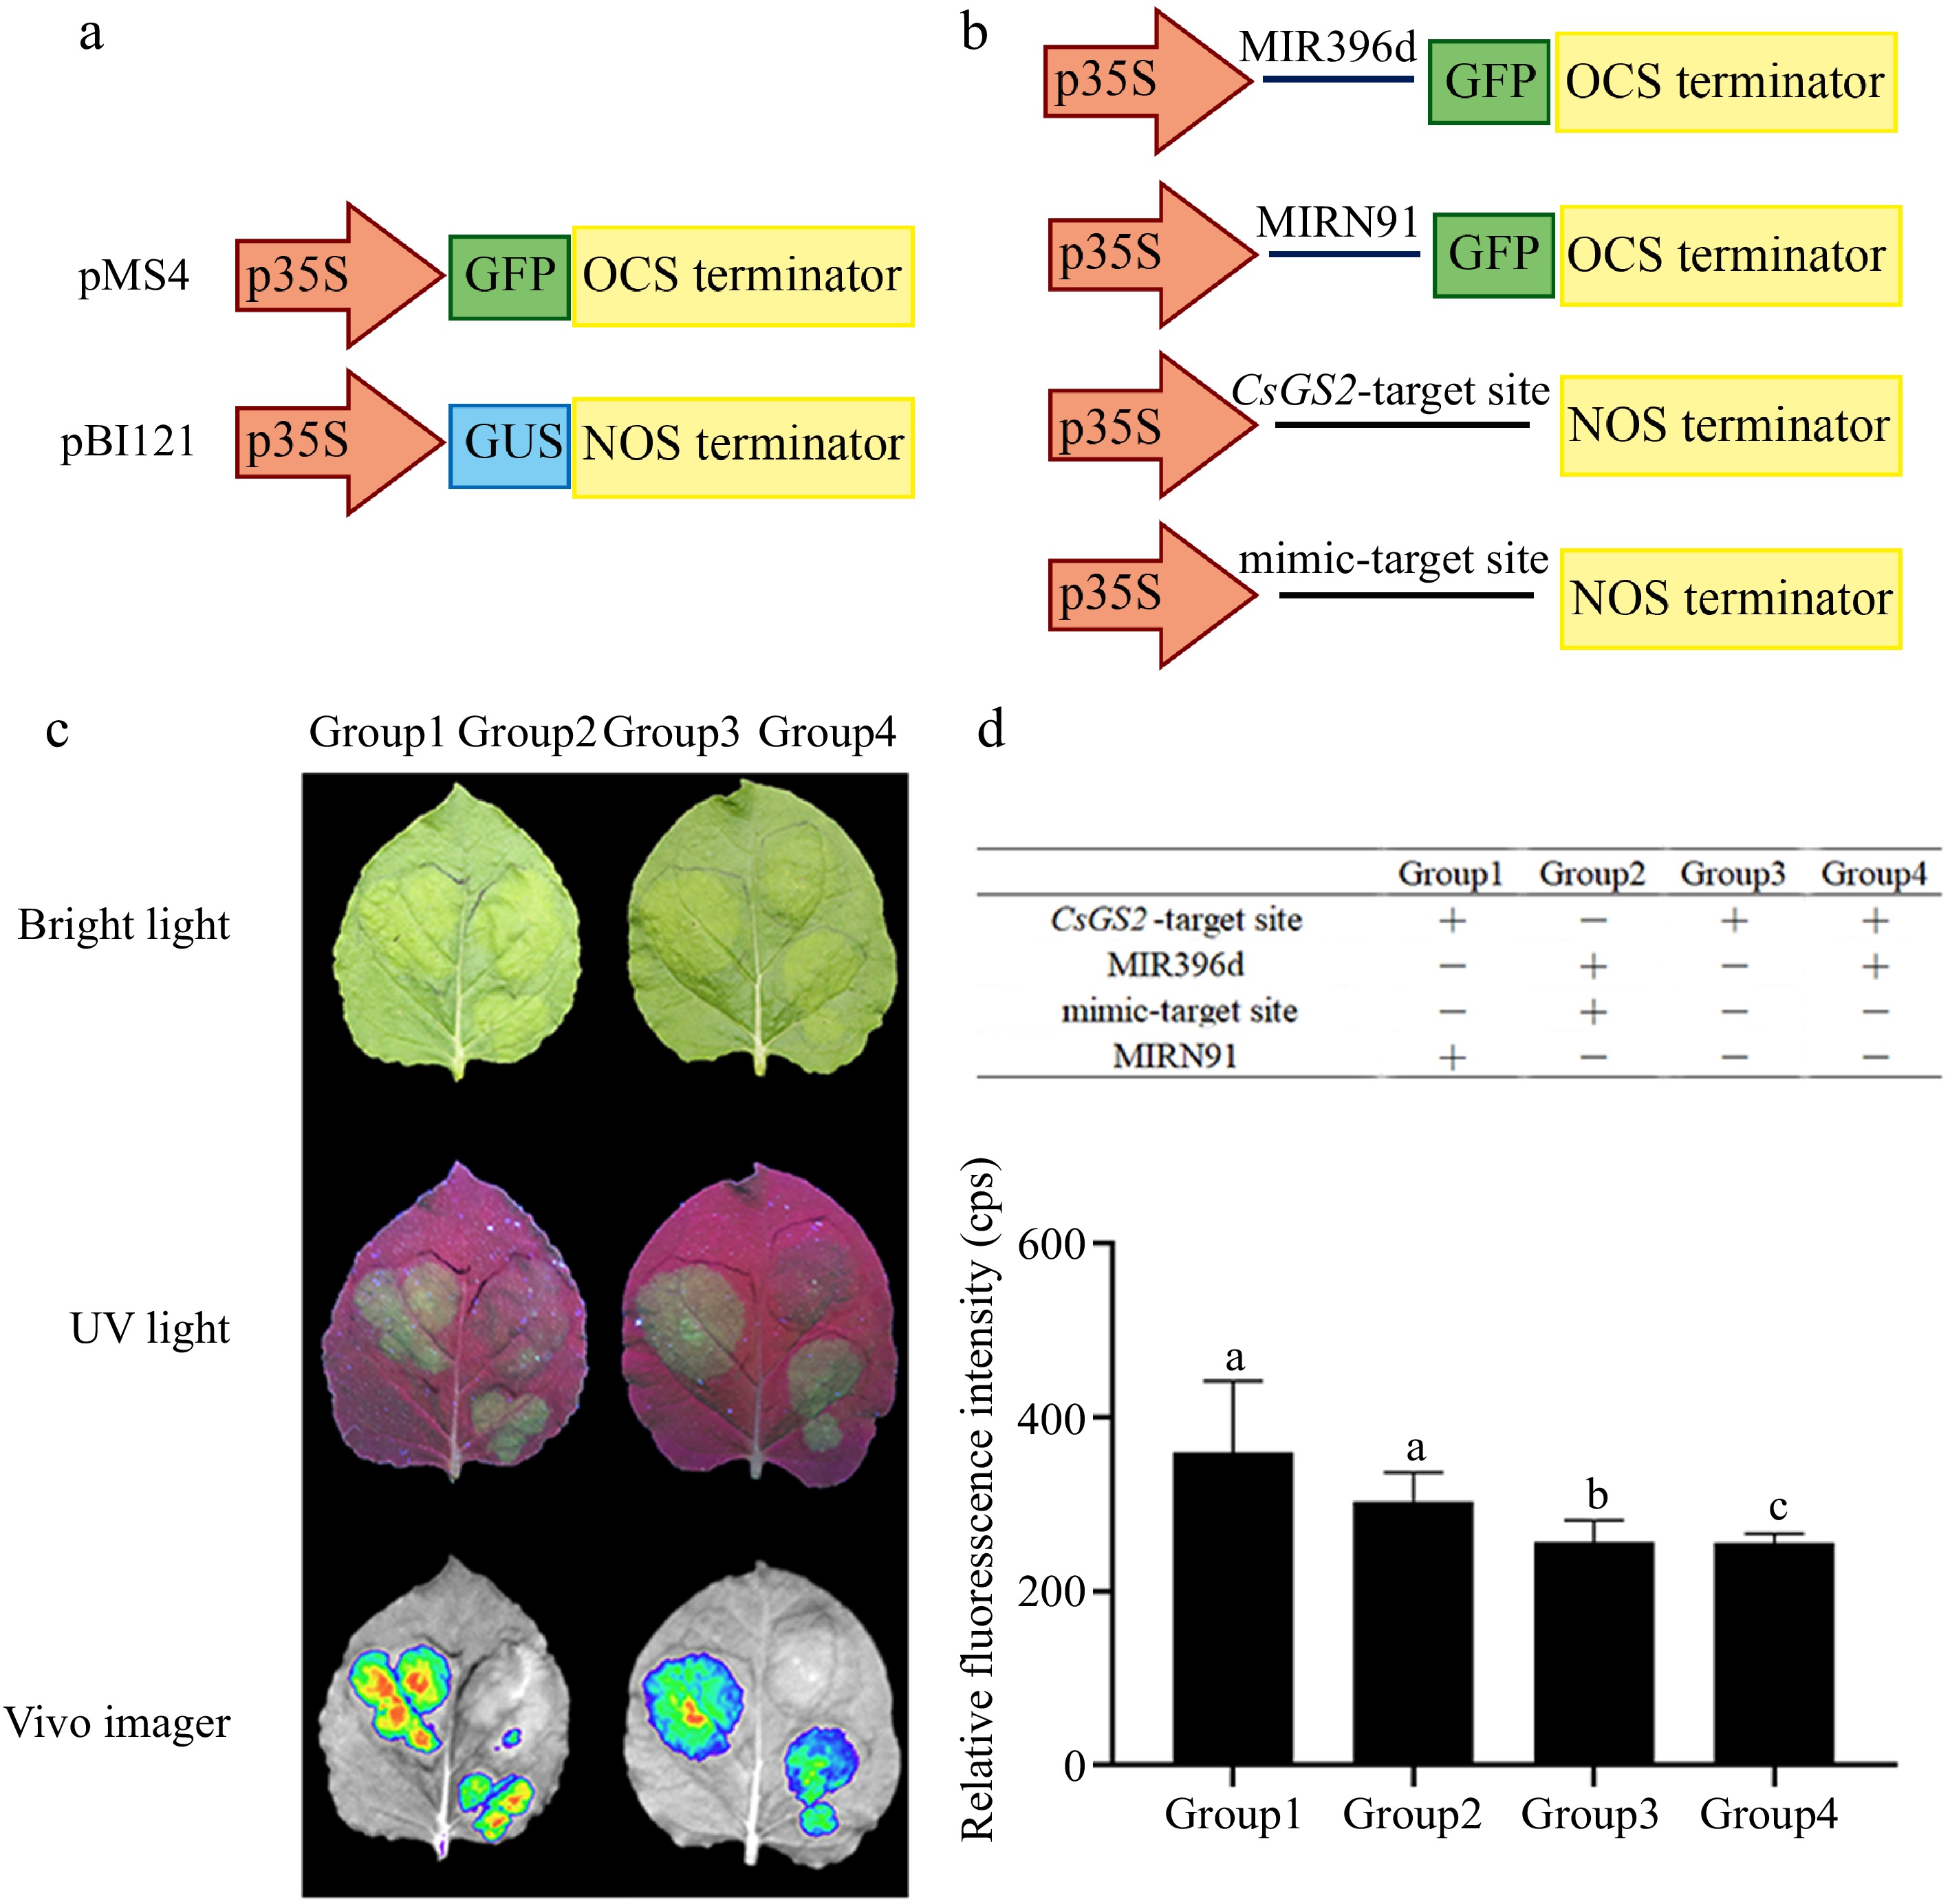
Figure 2.
Interaction between CsGS2 and CsmiR396d verified by tobacco transient system. (a), (b) Schematic of co-transformation vector construction. (c) The GFP fluorescence signals of different combinations under bright light, UV and vivo imager. (d) Relative fluorescence intensities in different combinations.
-
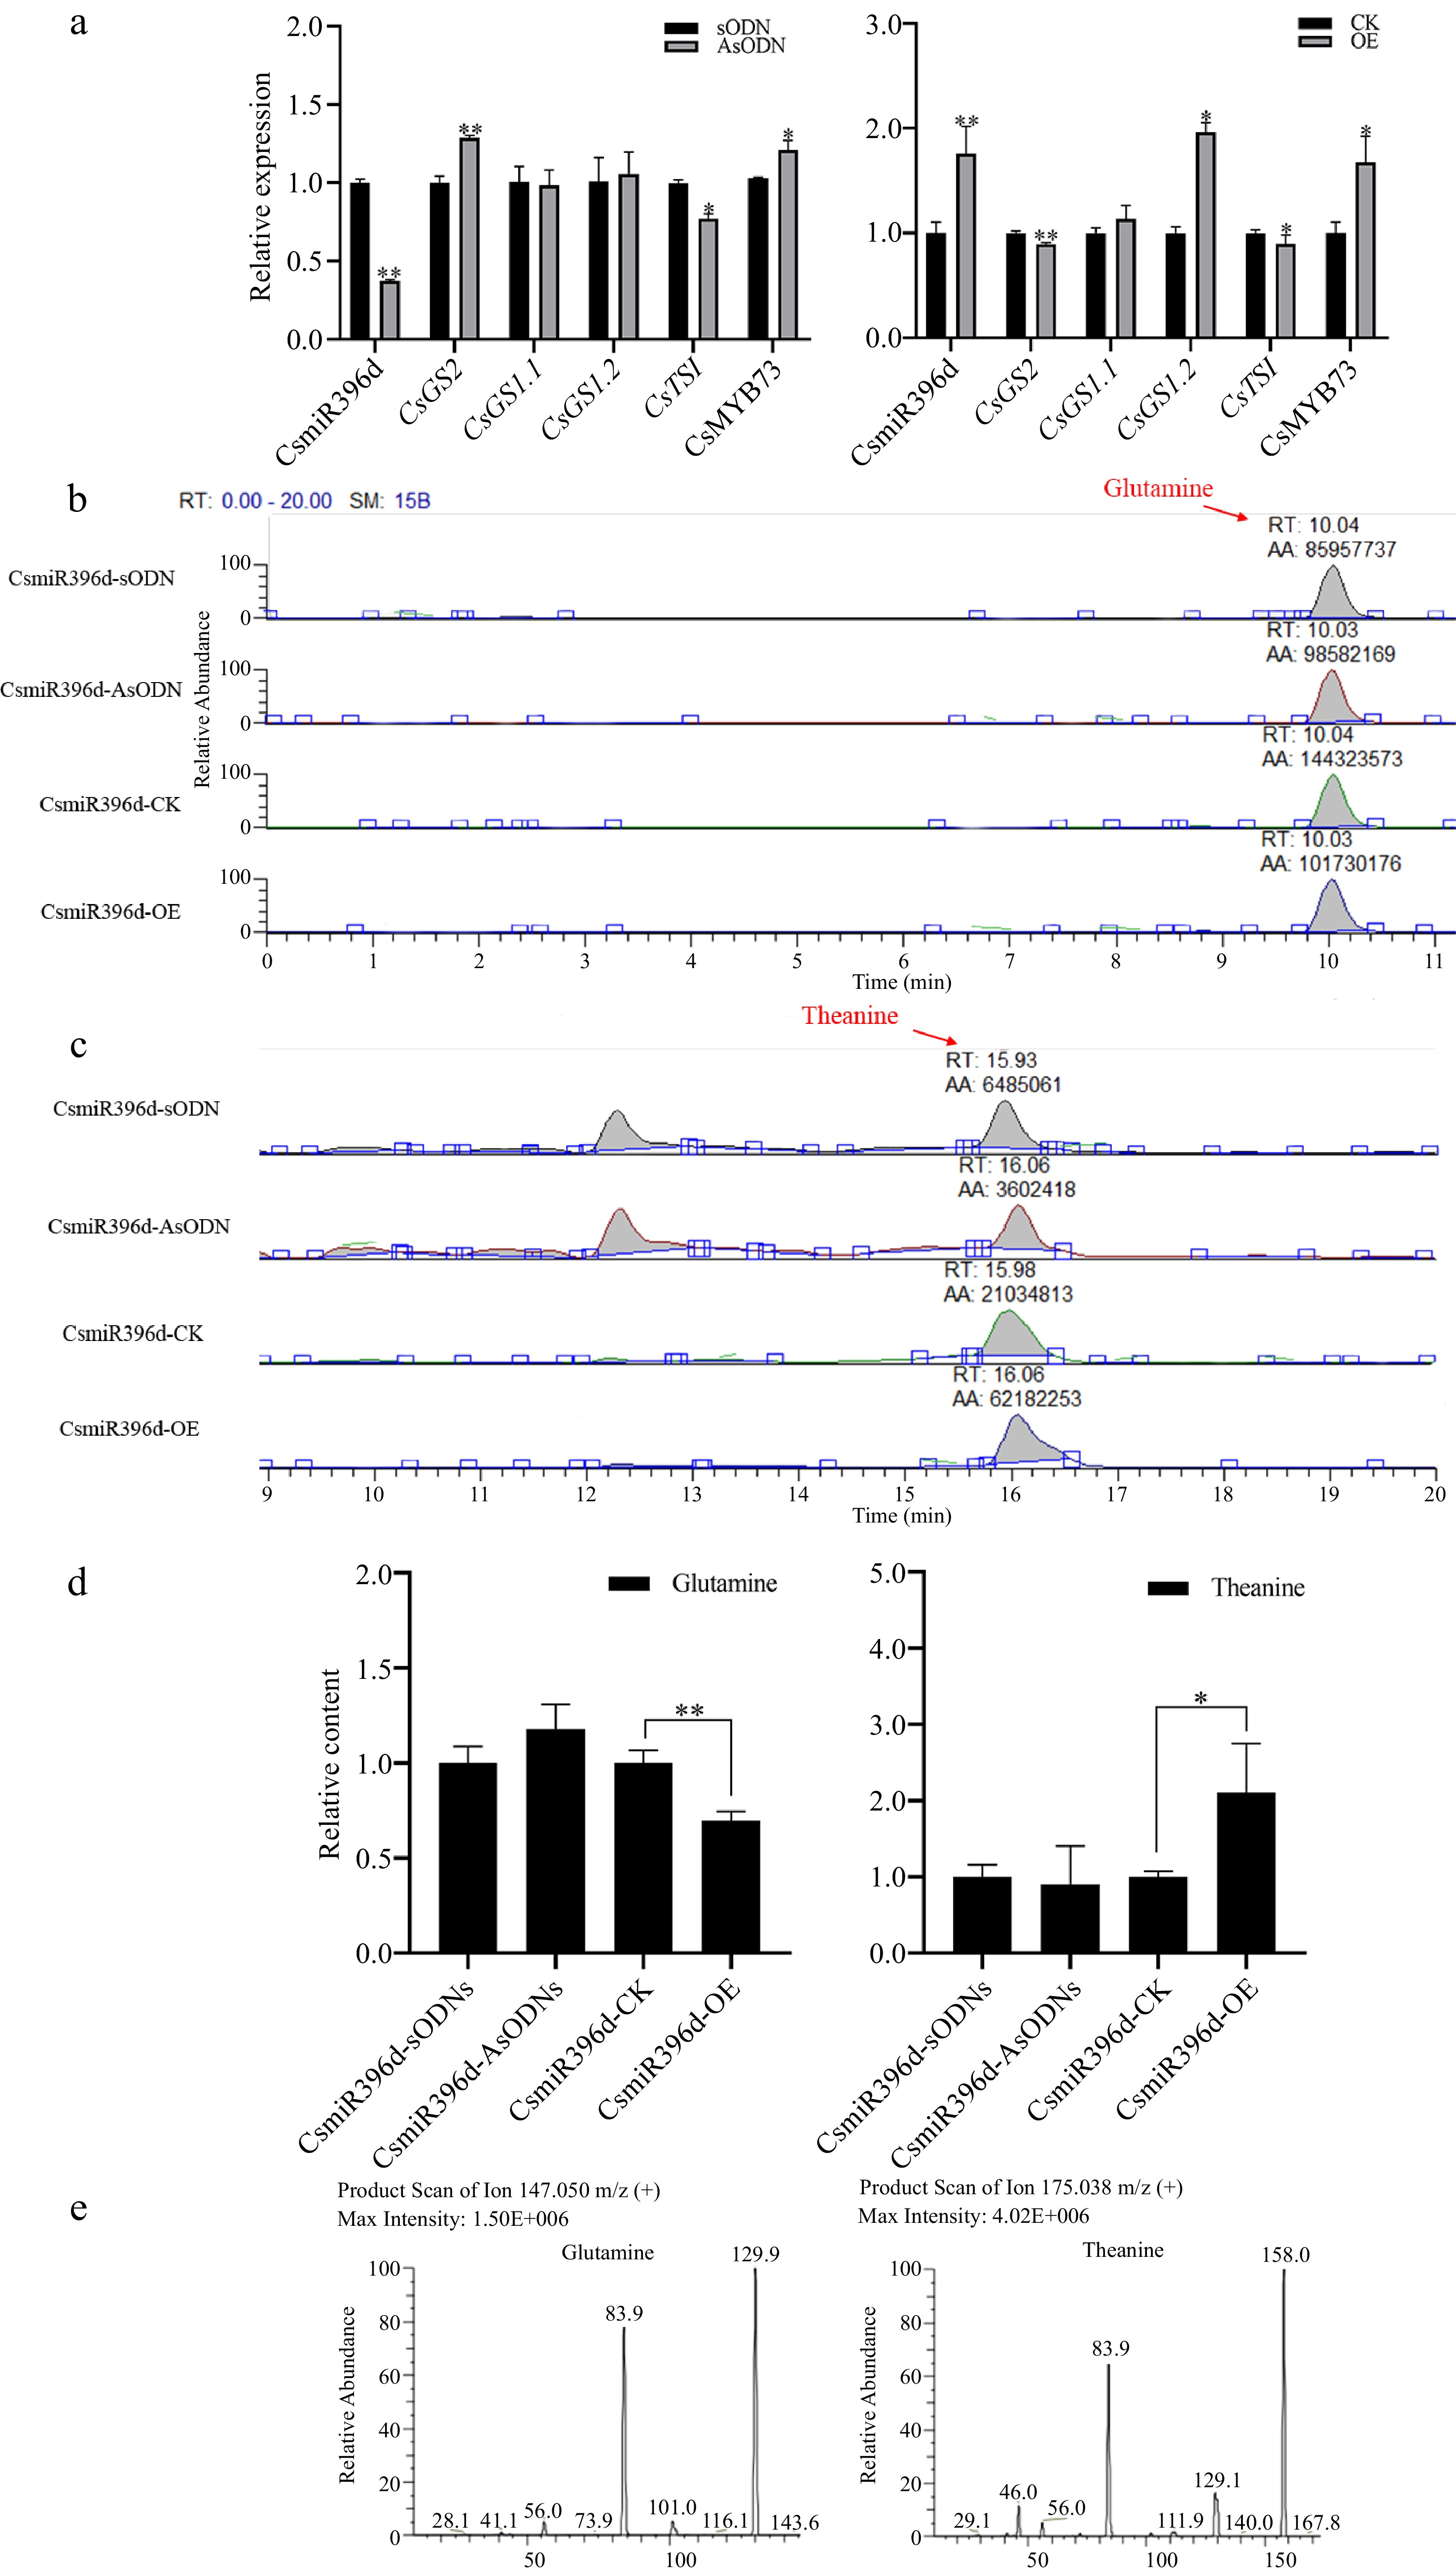
Figure 3.
The role of CsmiR396d in glutamine metabolism in tea plant. (a) Changes of glutamine metabolism-related genes in CsmiR396d silenced and over-expressed leaves. (b)−(d) HPLC analysis of glutamine and ʟ-theanine content in CsmiR396d silencing and over-expression leaves. (e) Mass spectra of glutamine (MS/MS of m/z 147) and theanine (MS/MS of m/z 175). *, ** indicate significant difference at p < 0.05 and p < 0.01, respectively.
-
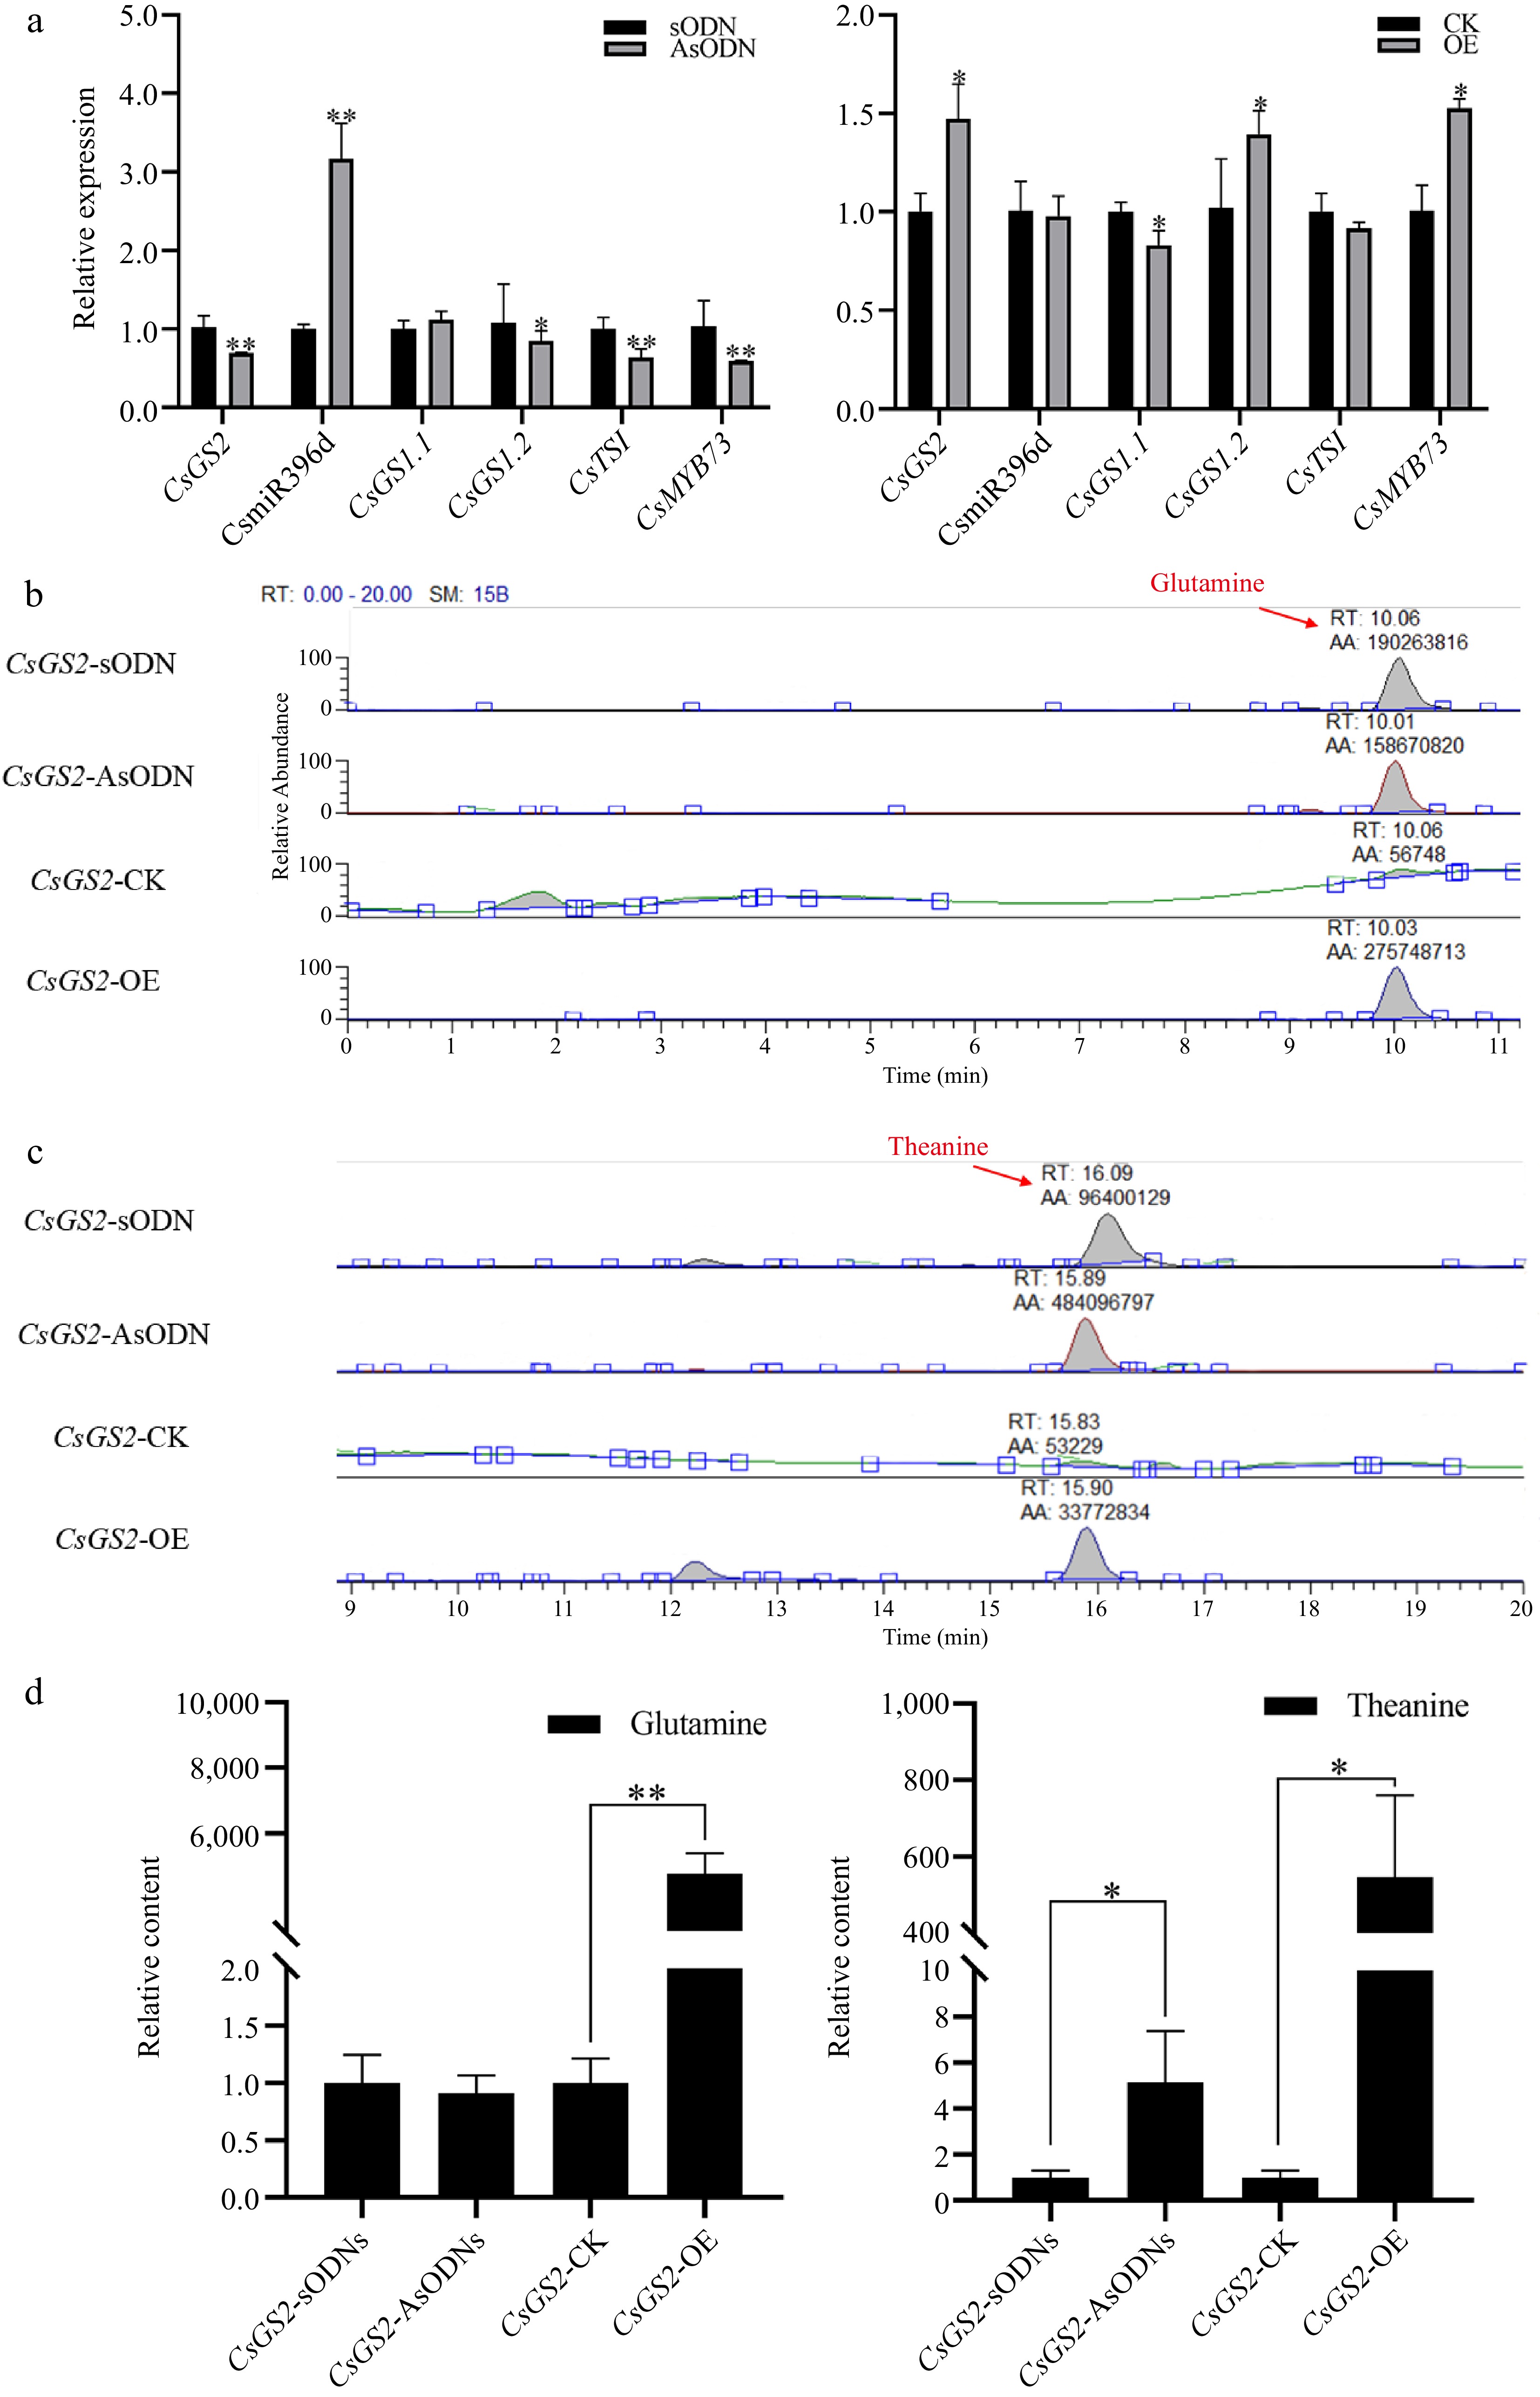
Figure 4.
The role of CsGS2 in glutamine metabolism in tea plant. (a) Changes of glutamine metabolism-related genes in CsGS2 silenced and over-expressed leaves. (b)−(d) HPLC analysis of glutamine and ʟ-theanine content in CsGS2 silenced and over-expressed leaves. *, ** indicate significant difference at p < 0.05 and p < 0.01, respectively.
-
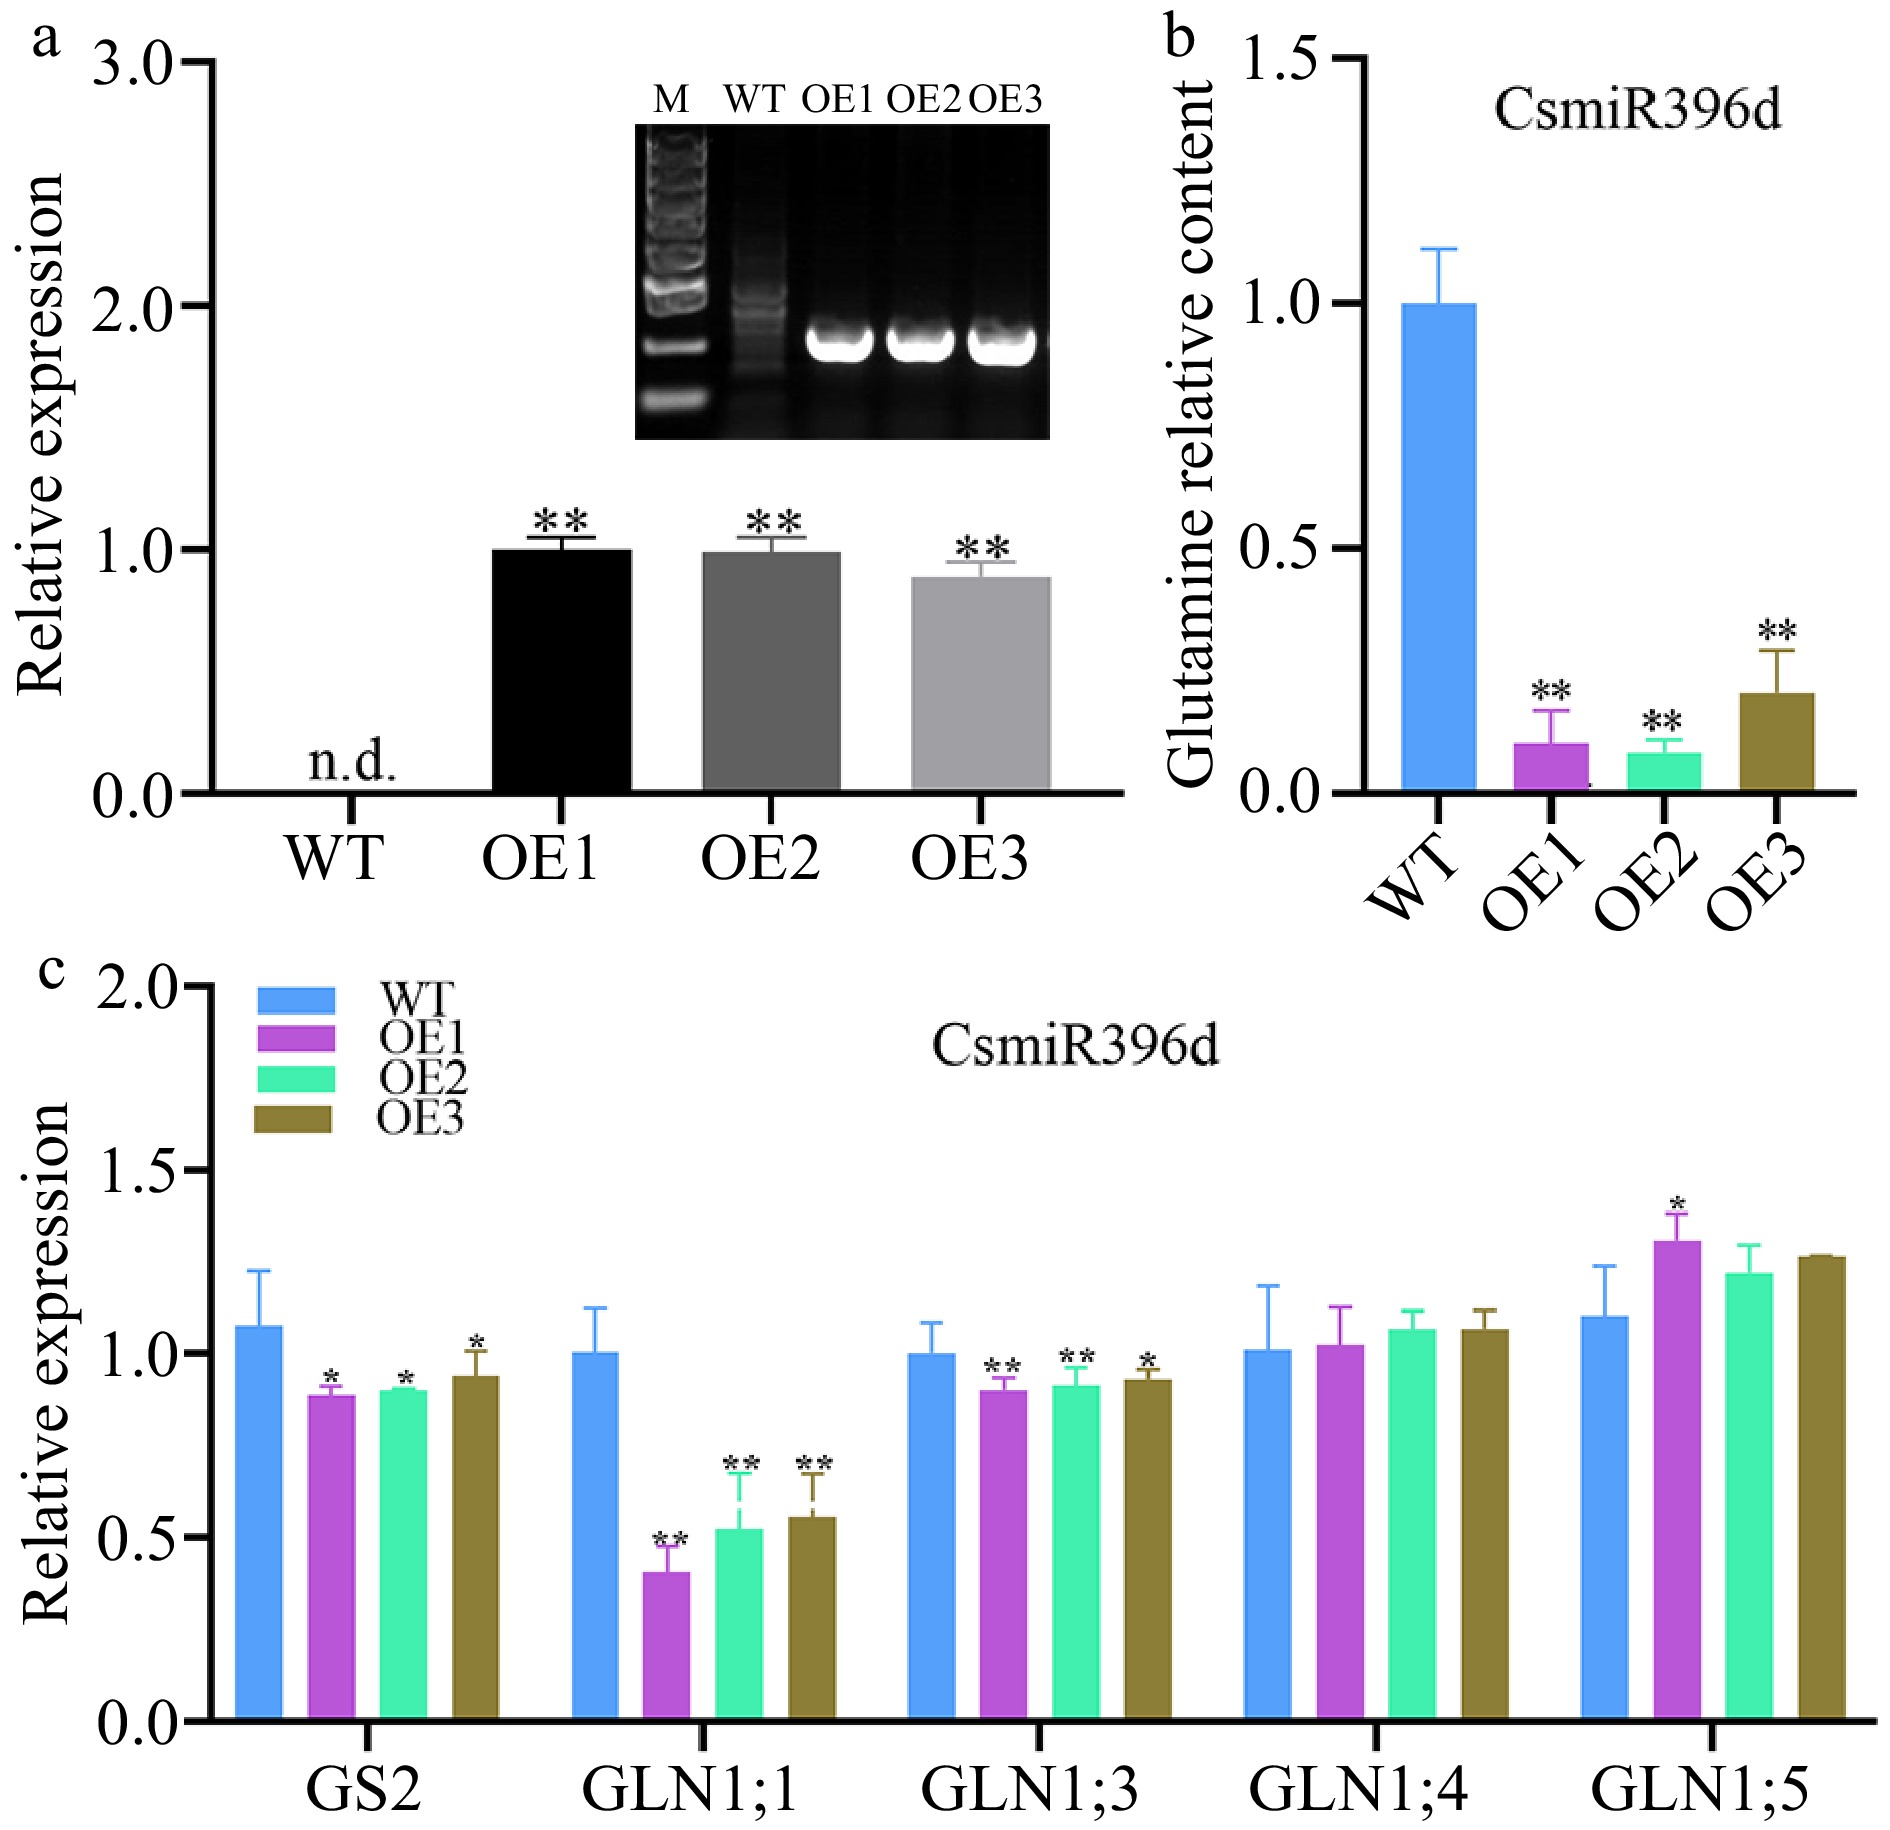
Figure 5.
The role of CsmiR396d in glutamine metabolism in Arabidopsis. (a) Positive identification in WT and CsmiR396d over-expressed lines. (b) Glutamine content in WT and CsmiR396d over-expressed lines. (c) Expression levels of glutamine metabolism related genes in WT and CsmiR396d over-expressed lines. *, ** indicate significant difference at p < 0.05 and p < 0.01, respectively.
-
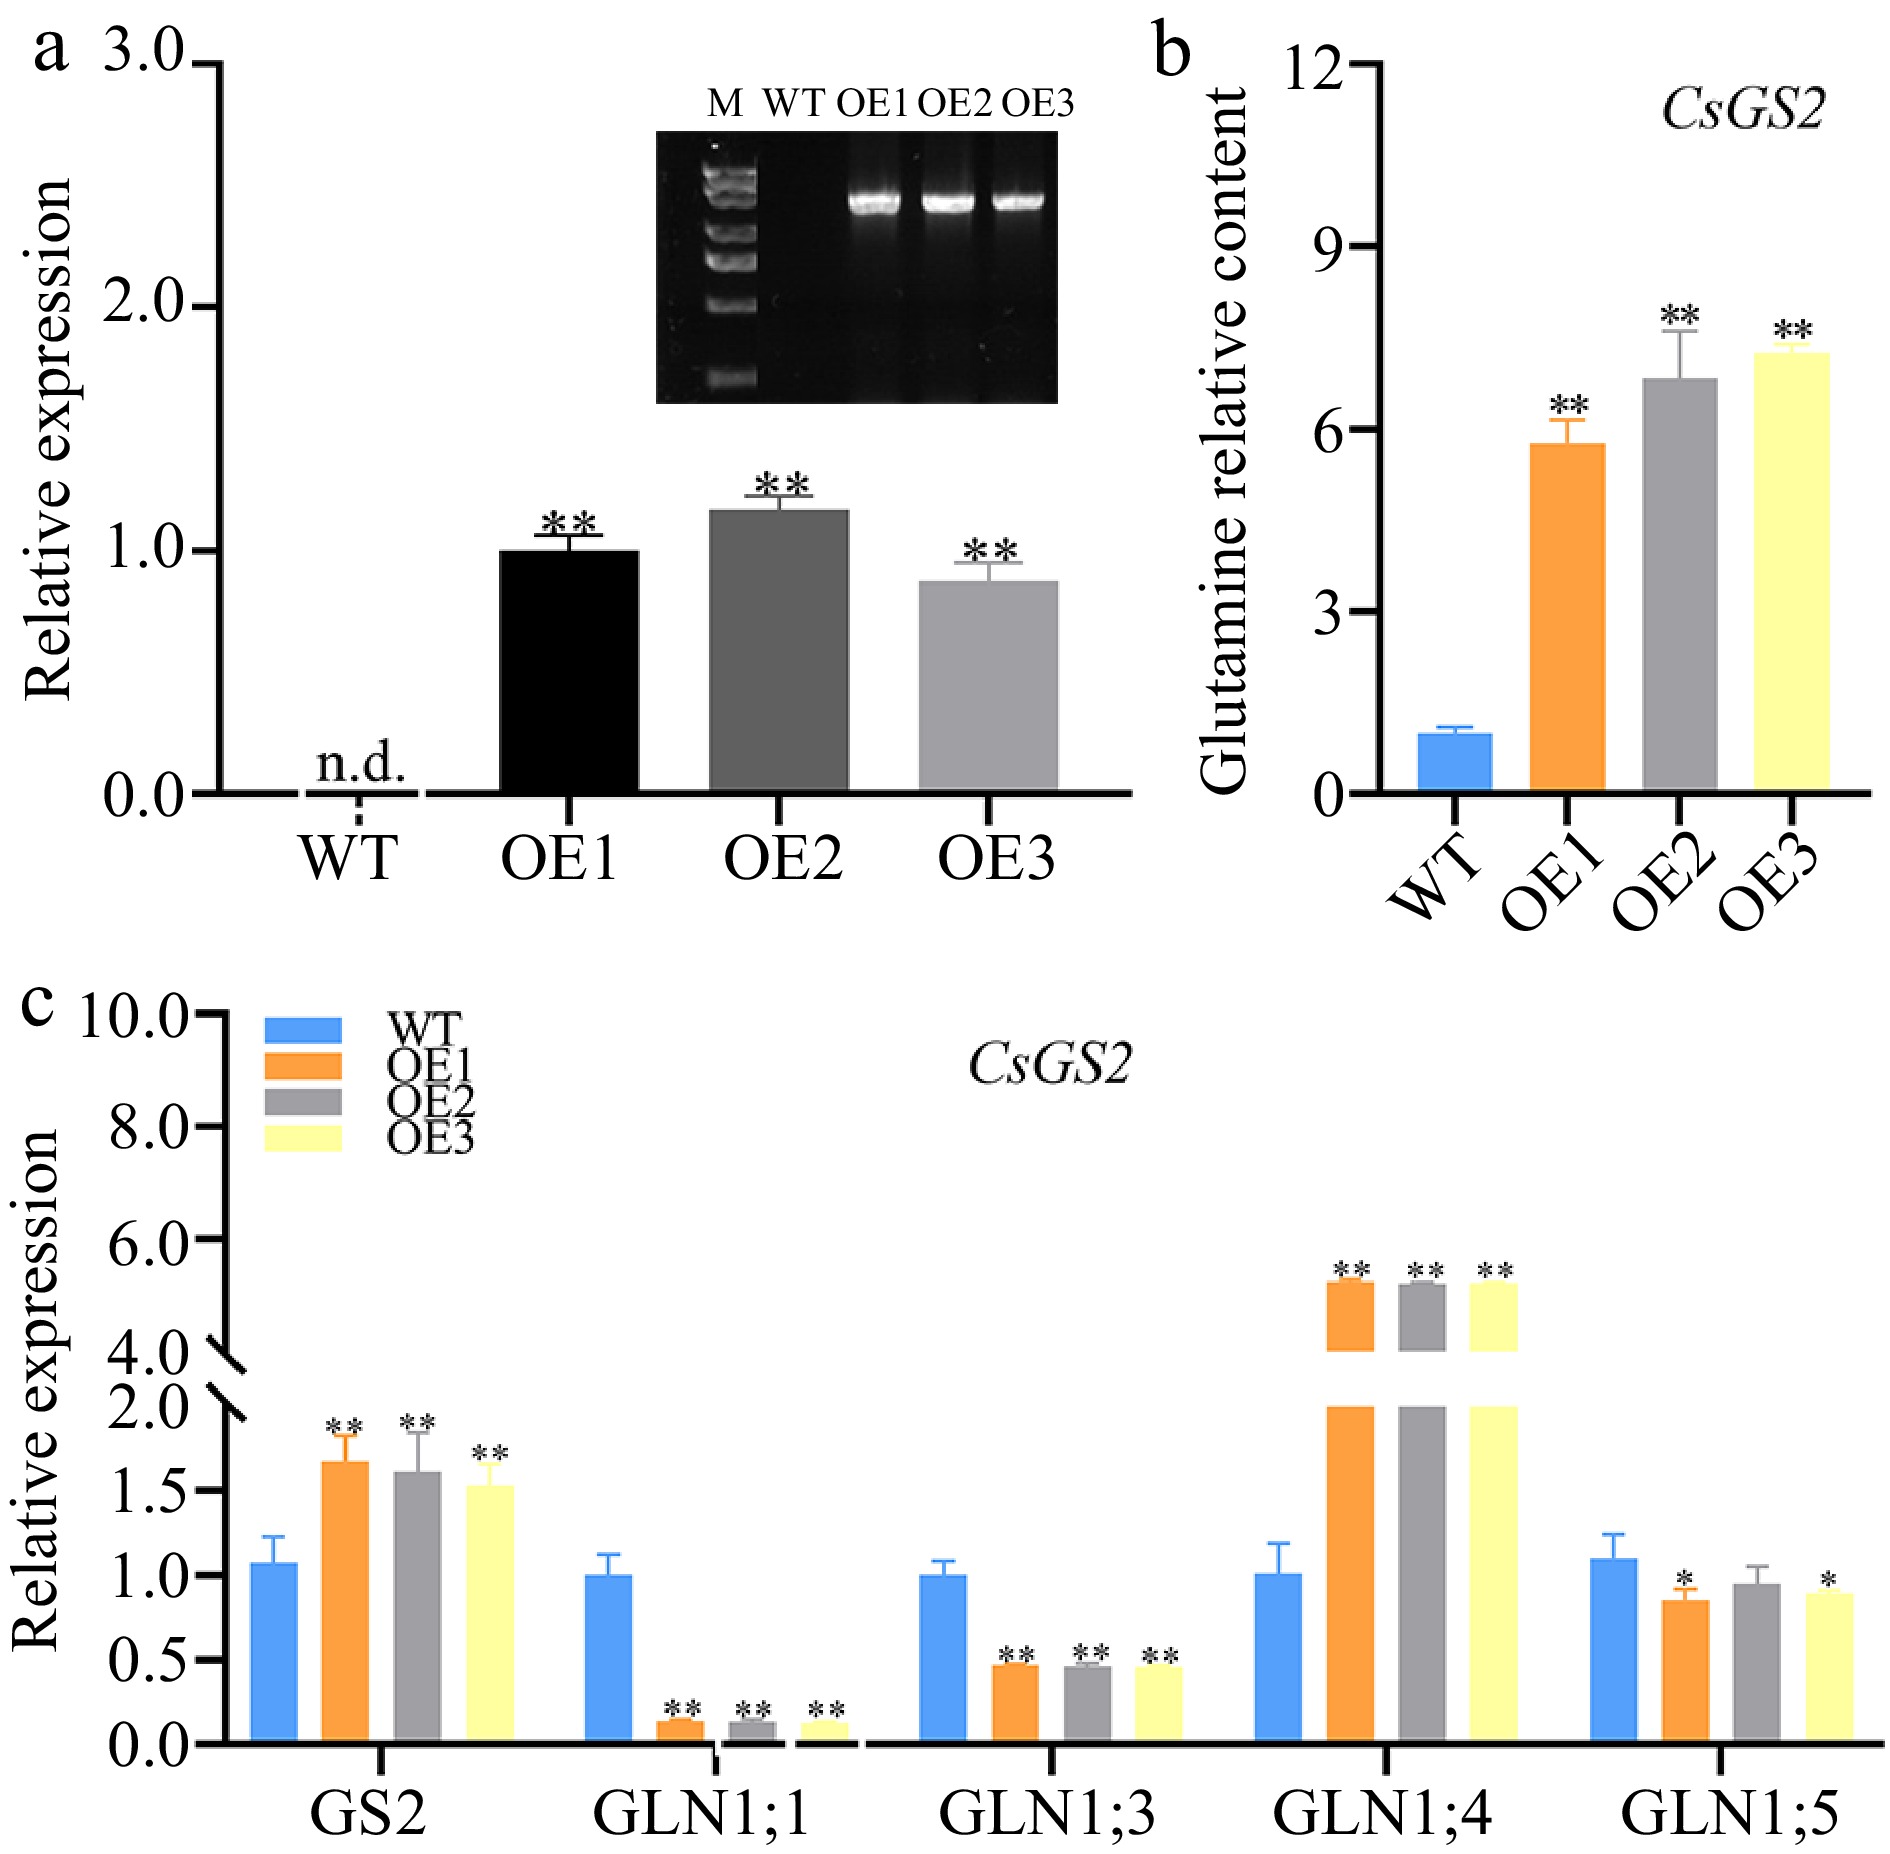
Figure 6.
The role of CsGS2 in glutamine metabolism in Arabidopsis. (a) Positive identification in WT and CsGS2 over-expressed lines. (b) Glutamine content in WT and CsGS2 over-expressed lines. (c) Expression levels of glutamine metabolism related genes in WT and CsGS2 over-expressed lines. *, ** indicate significant difference at p < 0.05 and p < 0.01, respectively.
Figures
(6)
Tables
(0)