-
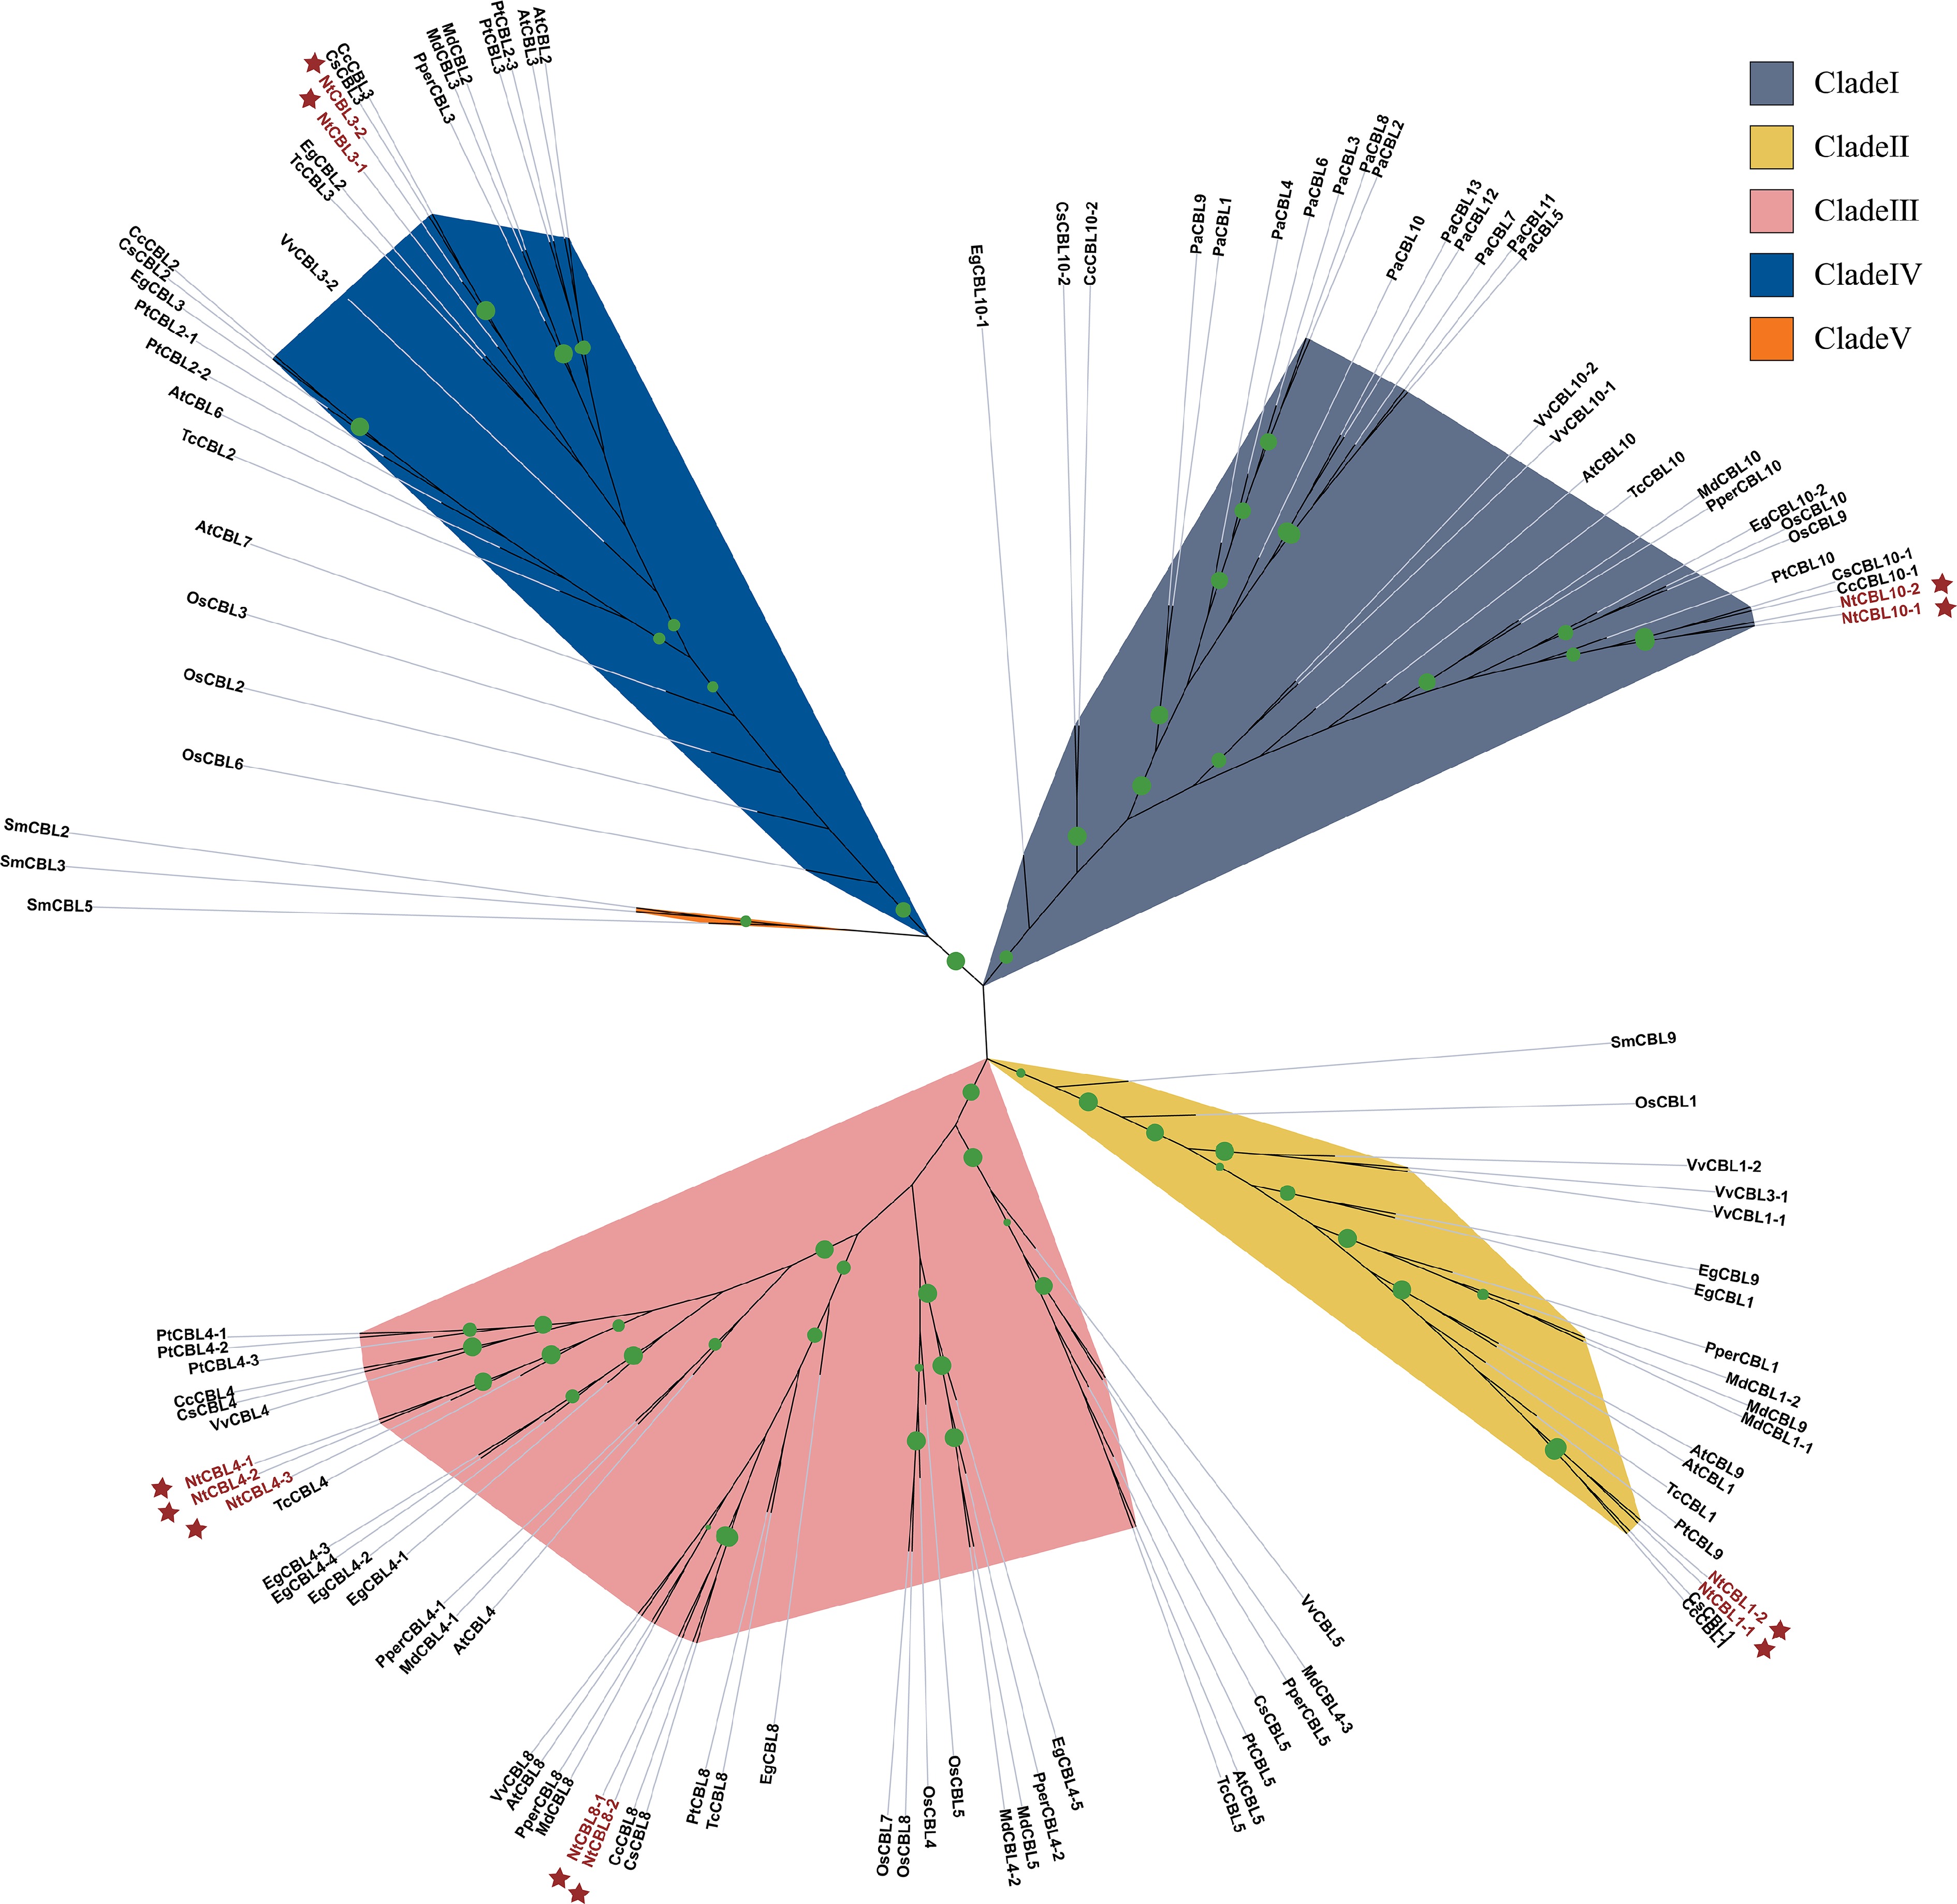
Figure 1.
The phylogenetic tree shows the relationships between CBL protein sequences from N. tangutorum and 12 other species. Phylogenetic analysis was performed using IQ-TREE software with maximum likelihood (ML) method and subjected to 1,000 bootstrap replicates. The modules are color coded to represent the five subclades of CBLs. NtCBLs are indicated by dark red stars. Green dots of different sizes indicate Bootstraps confidence levels above 80.
-
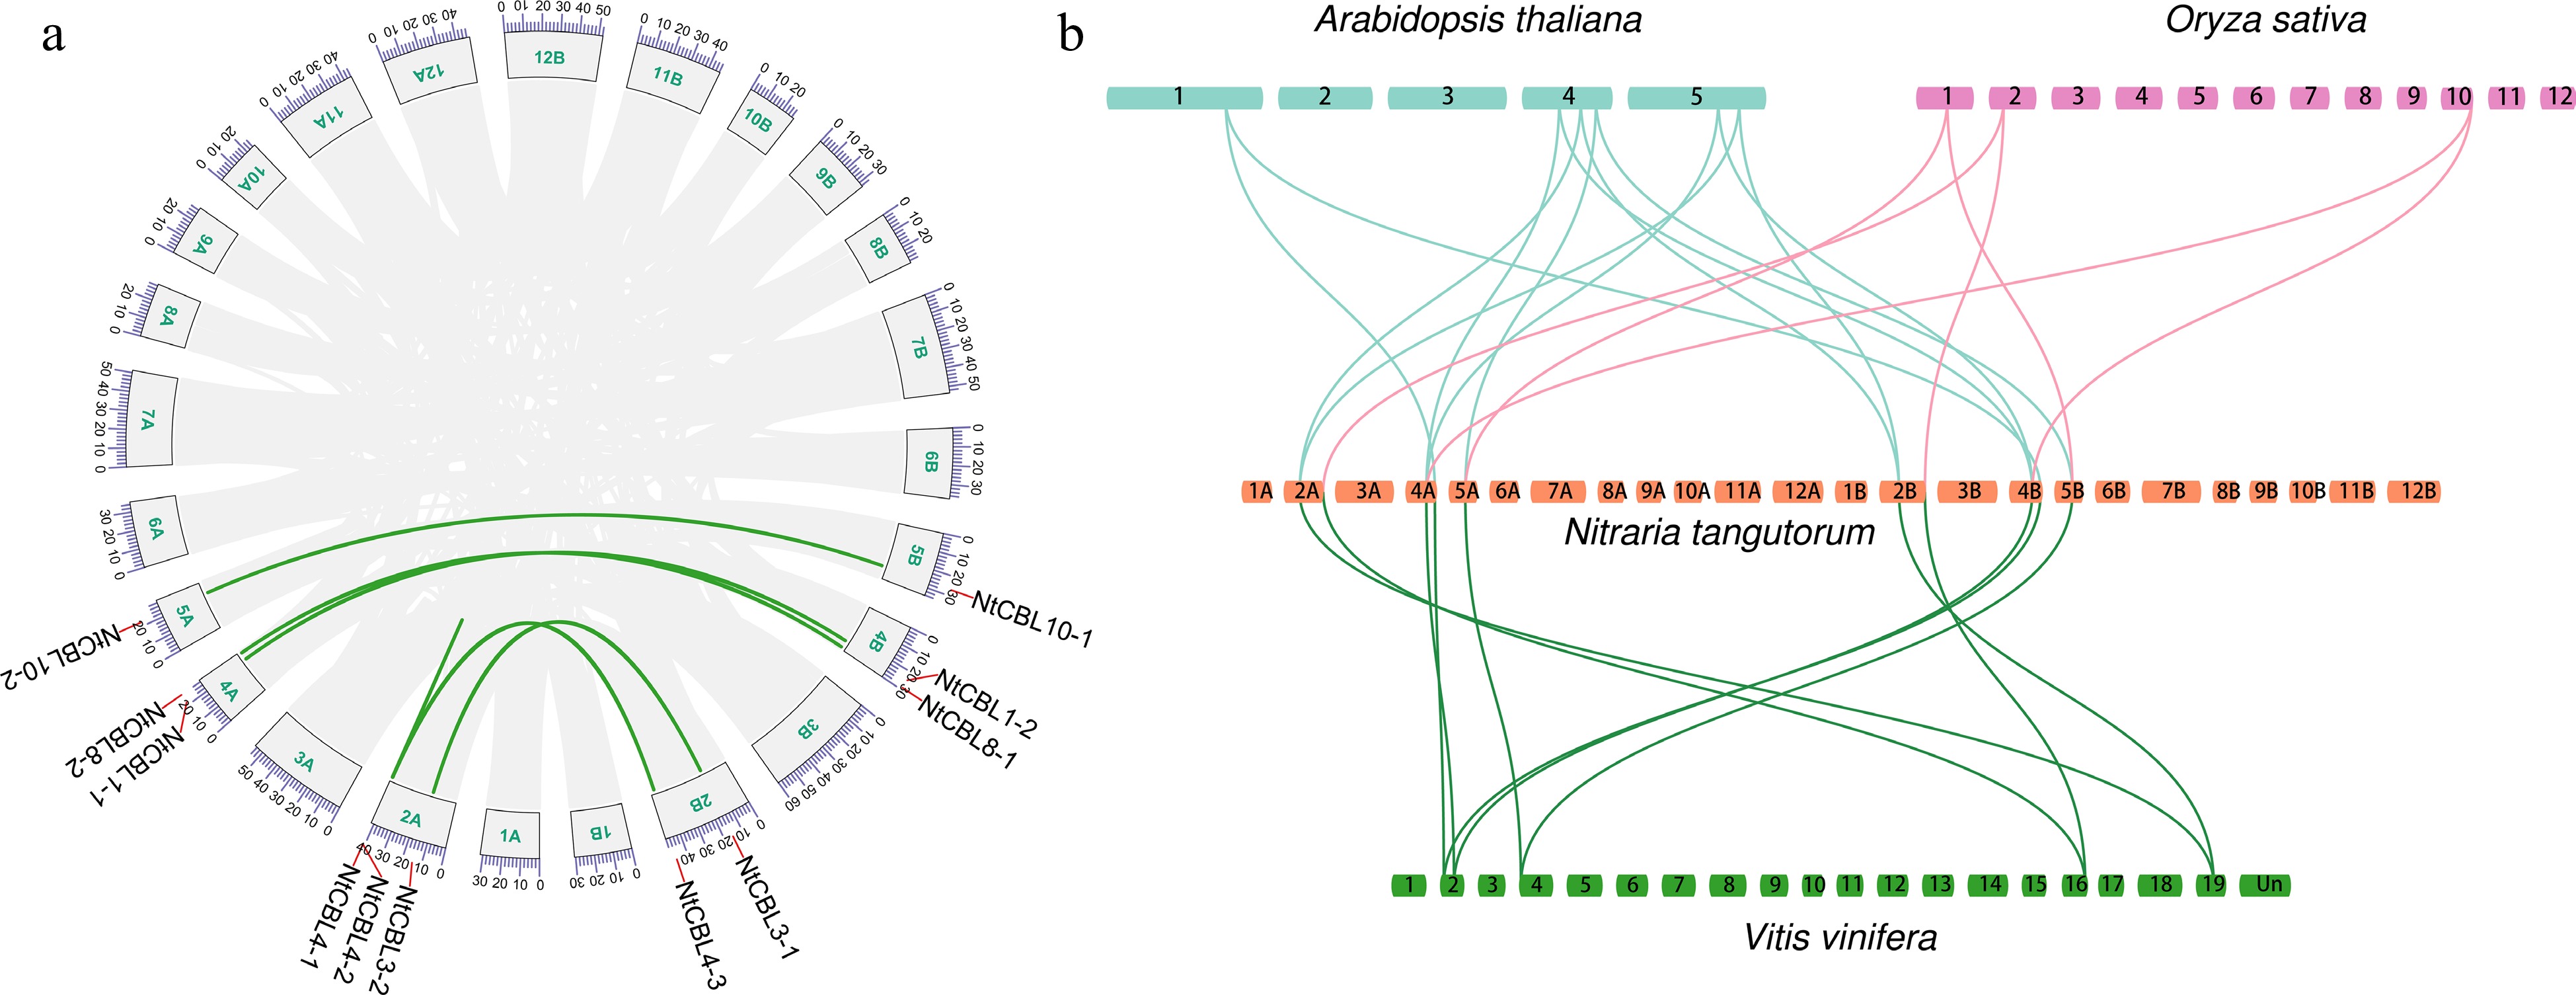
Figure 2.
Genome-wide synteny analysis of CBL gene family among N. tangutorum and three other species. (a) inter-chromosomal relationships of NtCBLs (the links on the green curve indicate synteny relationships between genes). (b) Synteny analyses between the CBLs of N. tangutorum, Arabidopsis, Vitis vinifera, and Oryza sativa, the links between species indicate homologous relationships between genes.
-
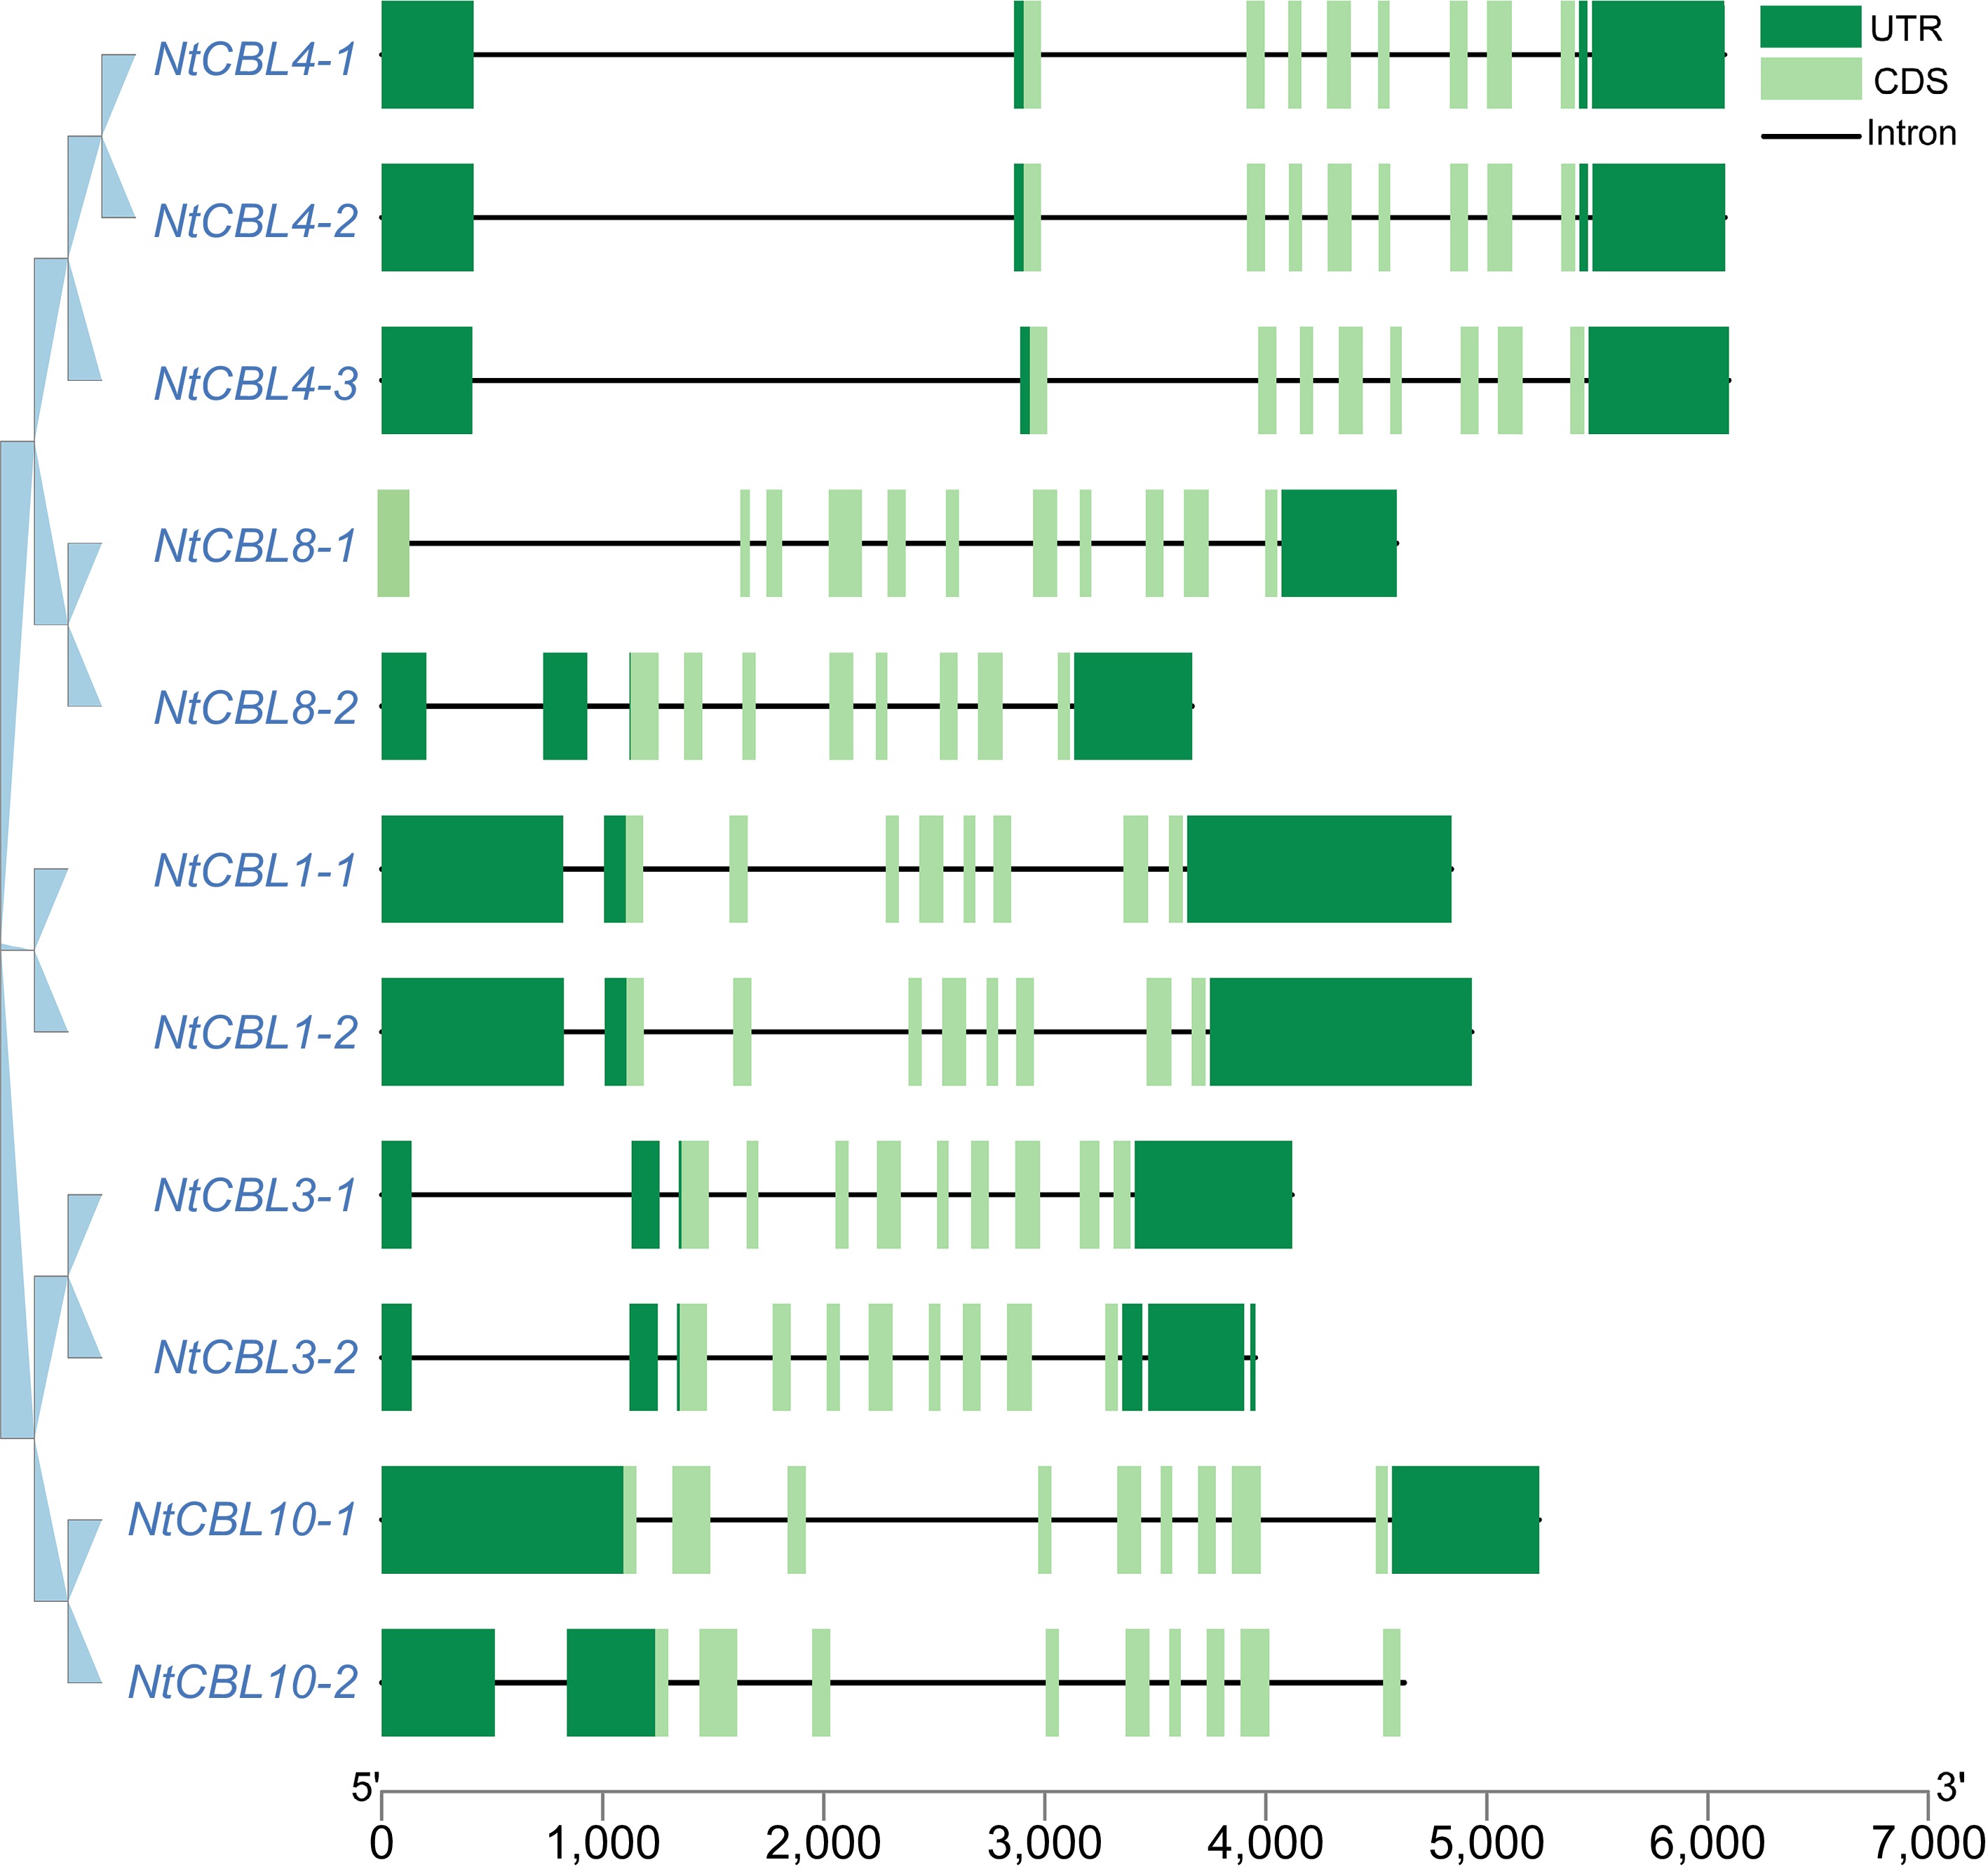
Figure 3.
Gene structure of the CBL gene family in N. tangutorum. The dark green boxes represent the UTR (Untranslated Region), the light green boxes represent the CDS (gene coding region), and the black lines represent the intron region.
-
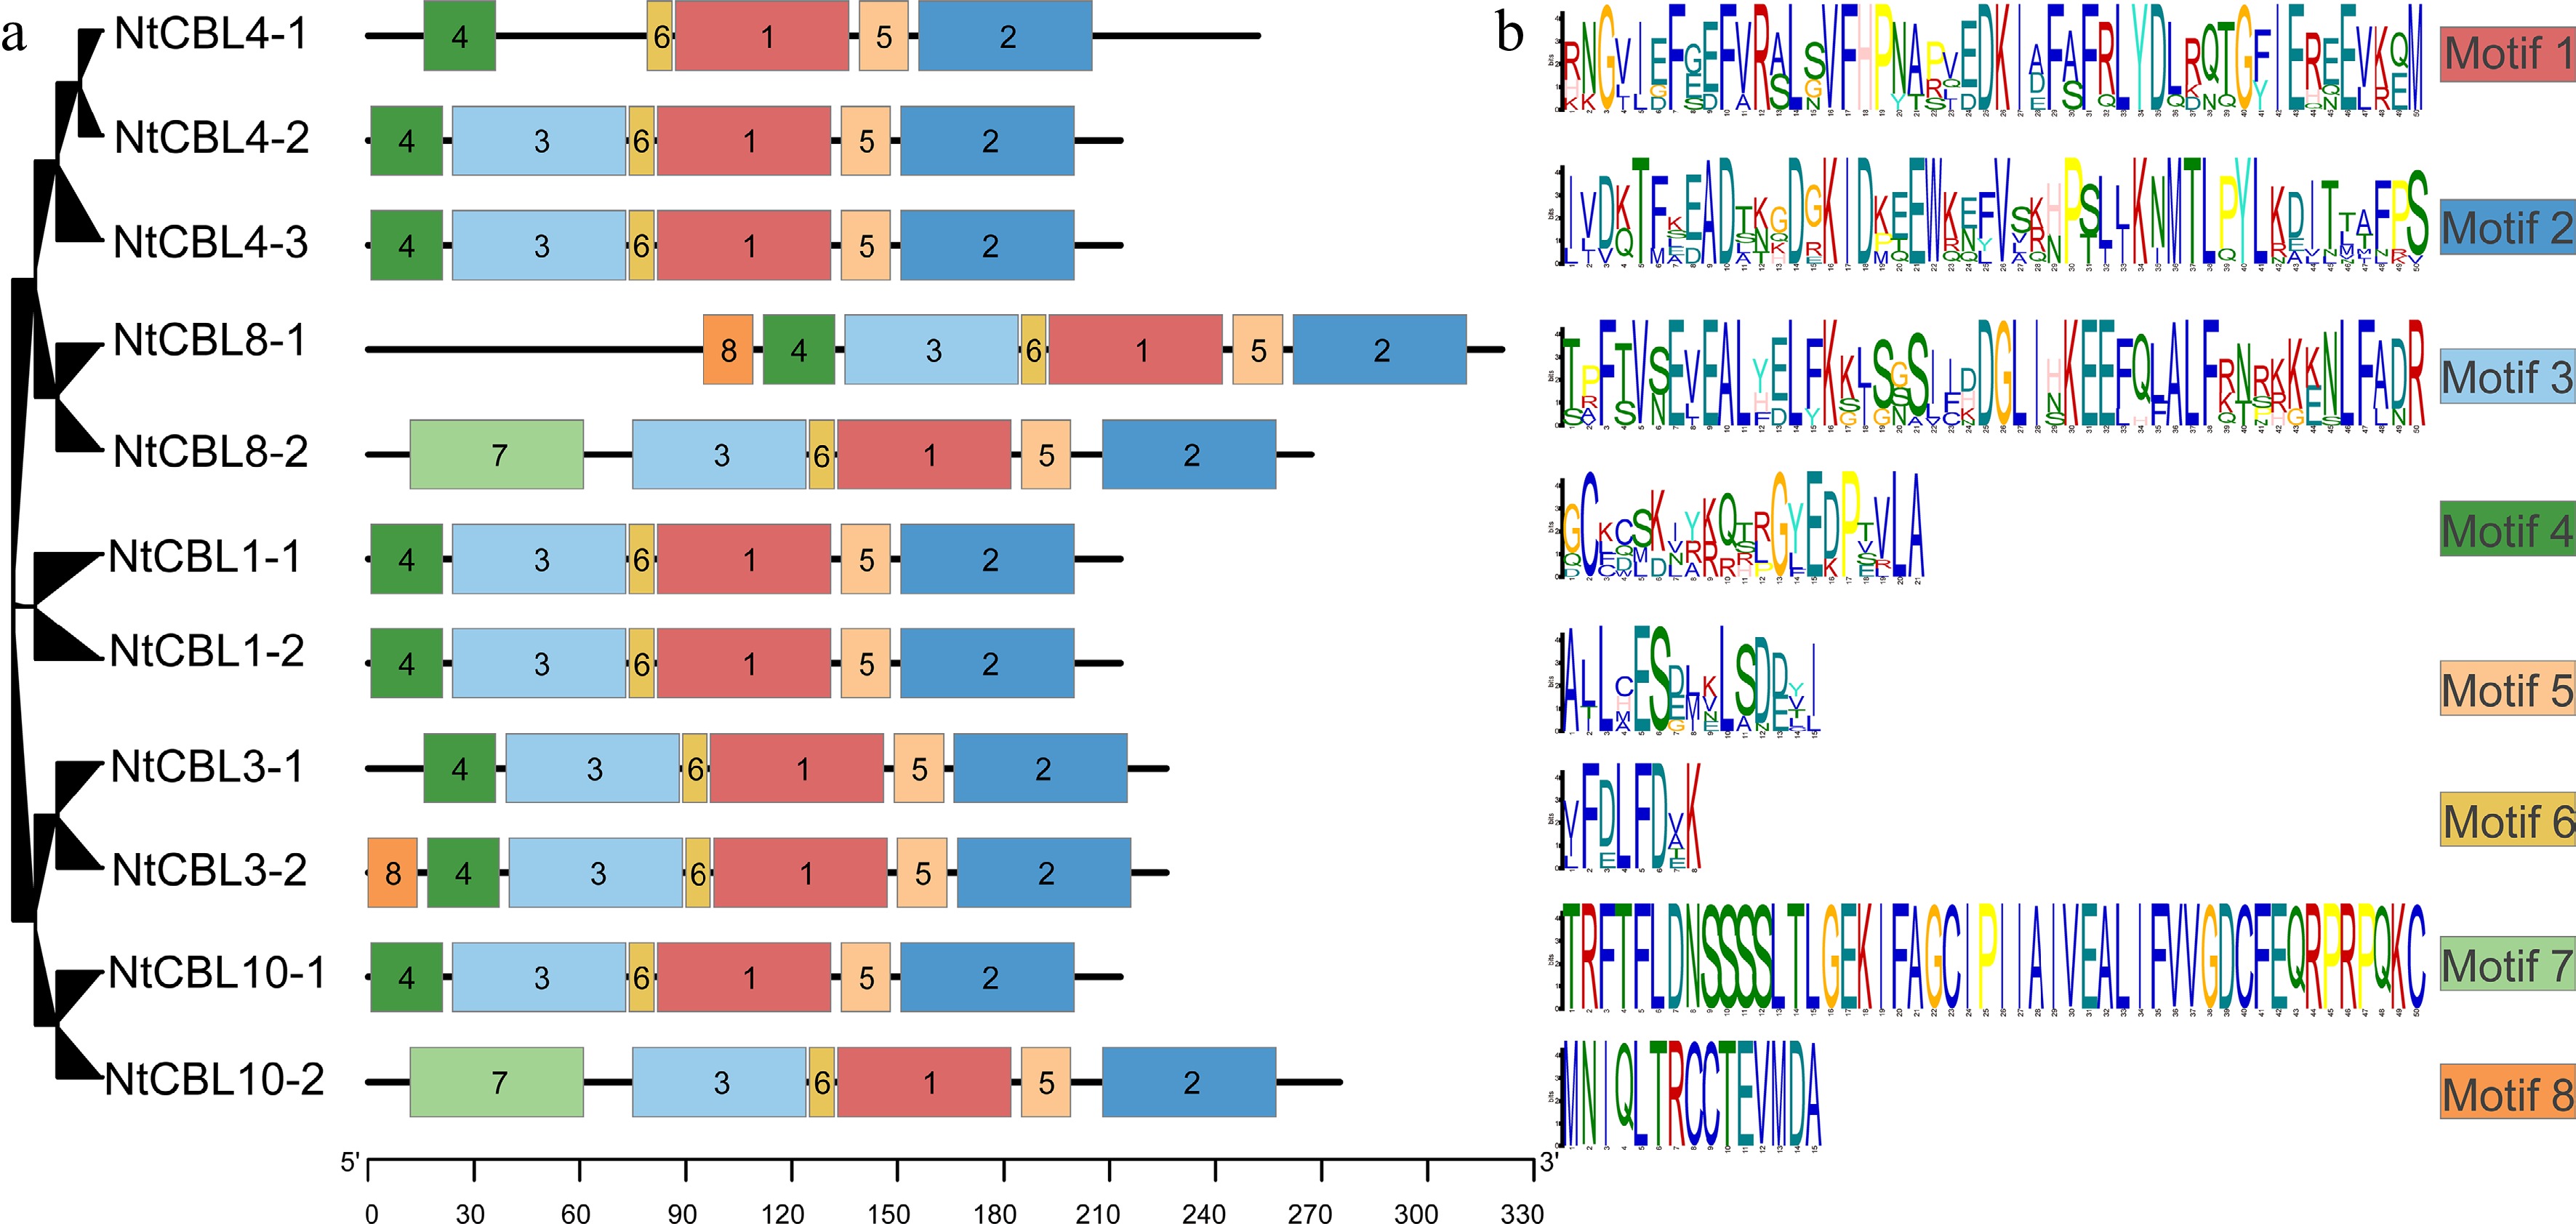
Figure 4.
Conservative motifs distribution in N. tangutorum. (a) Distribution of different motifs on NtCBL genes. (b) Specific sequence information of different motifs, with larger letters indicating higher conservation.
-
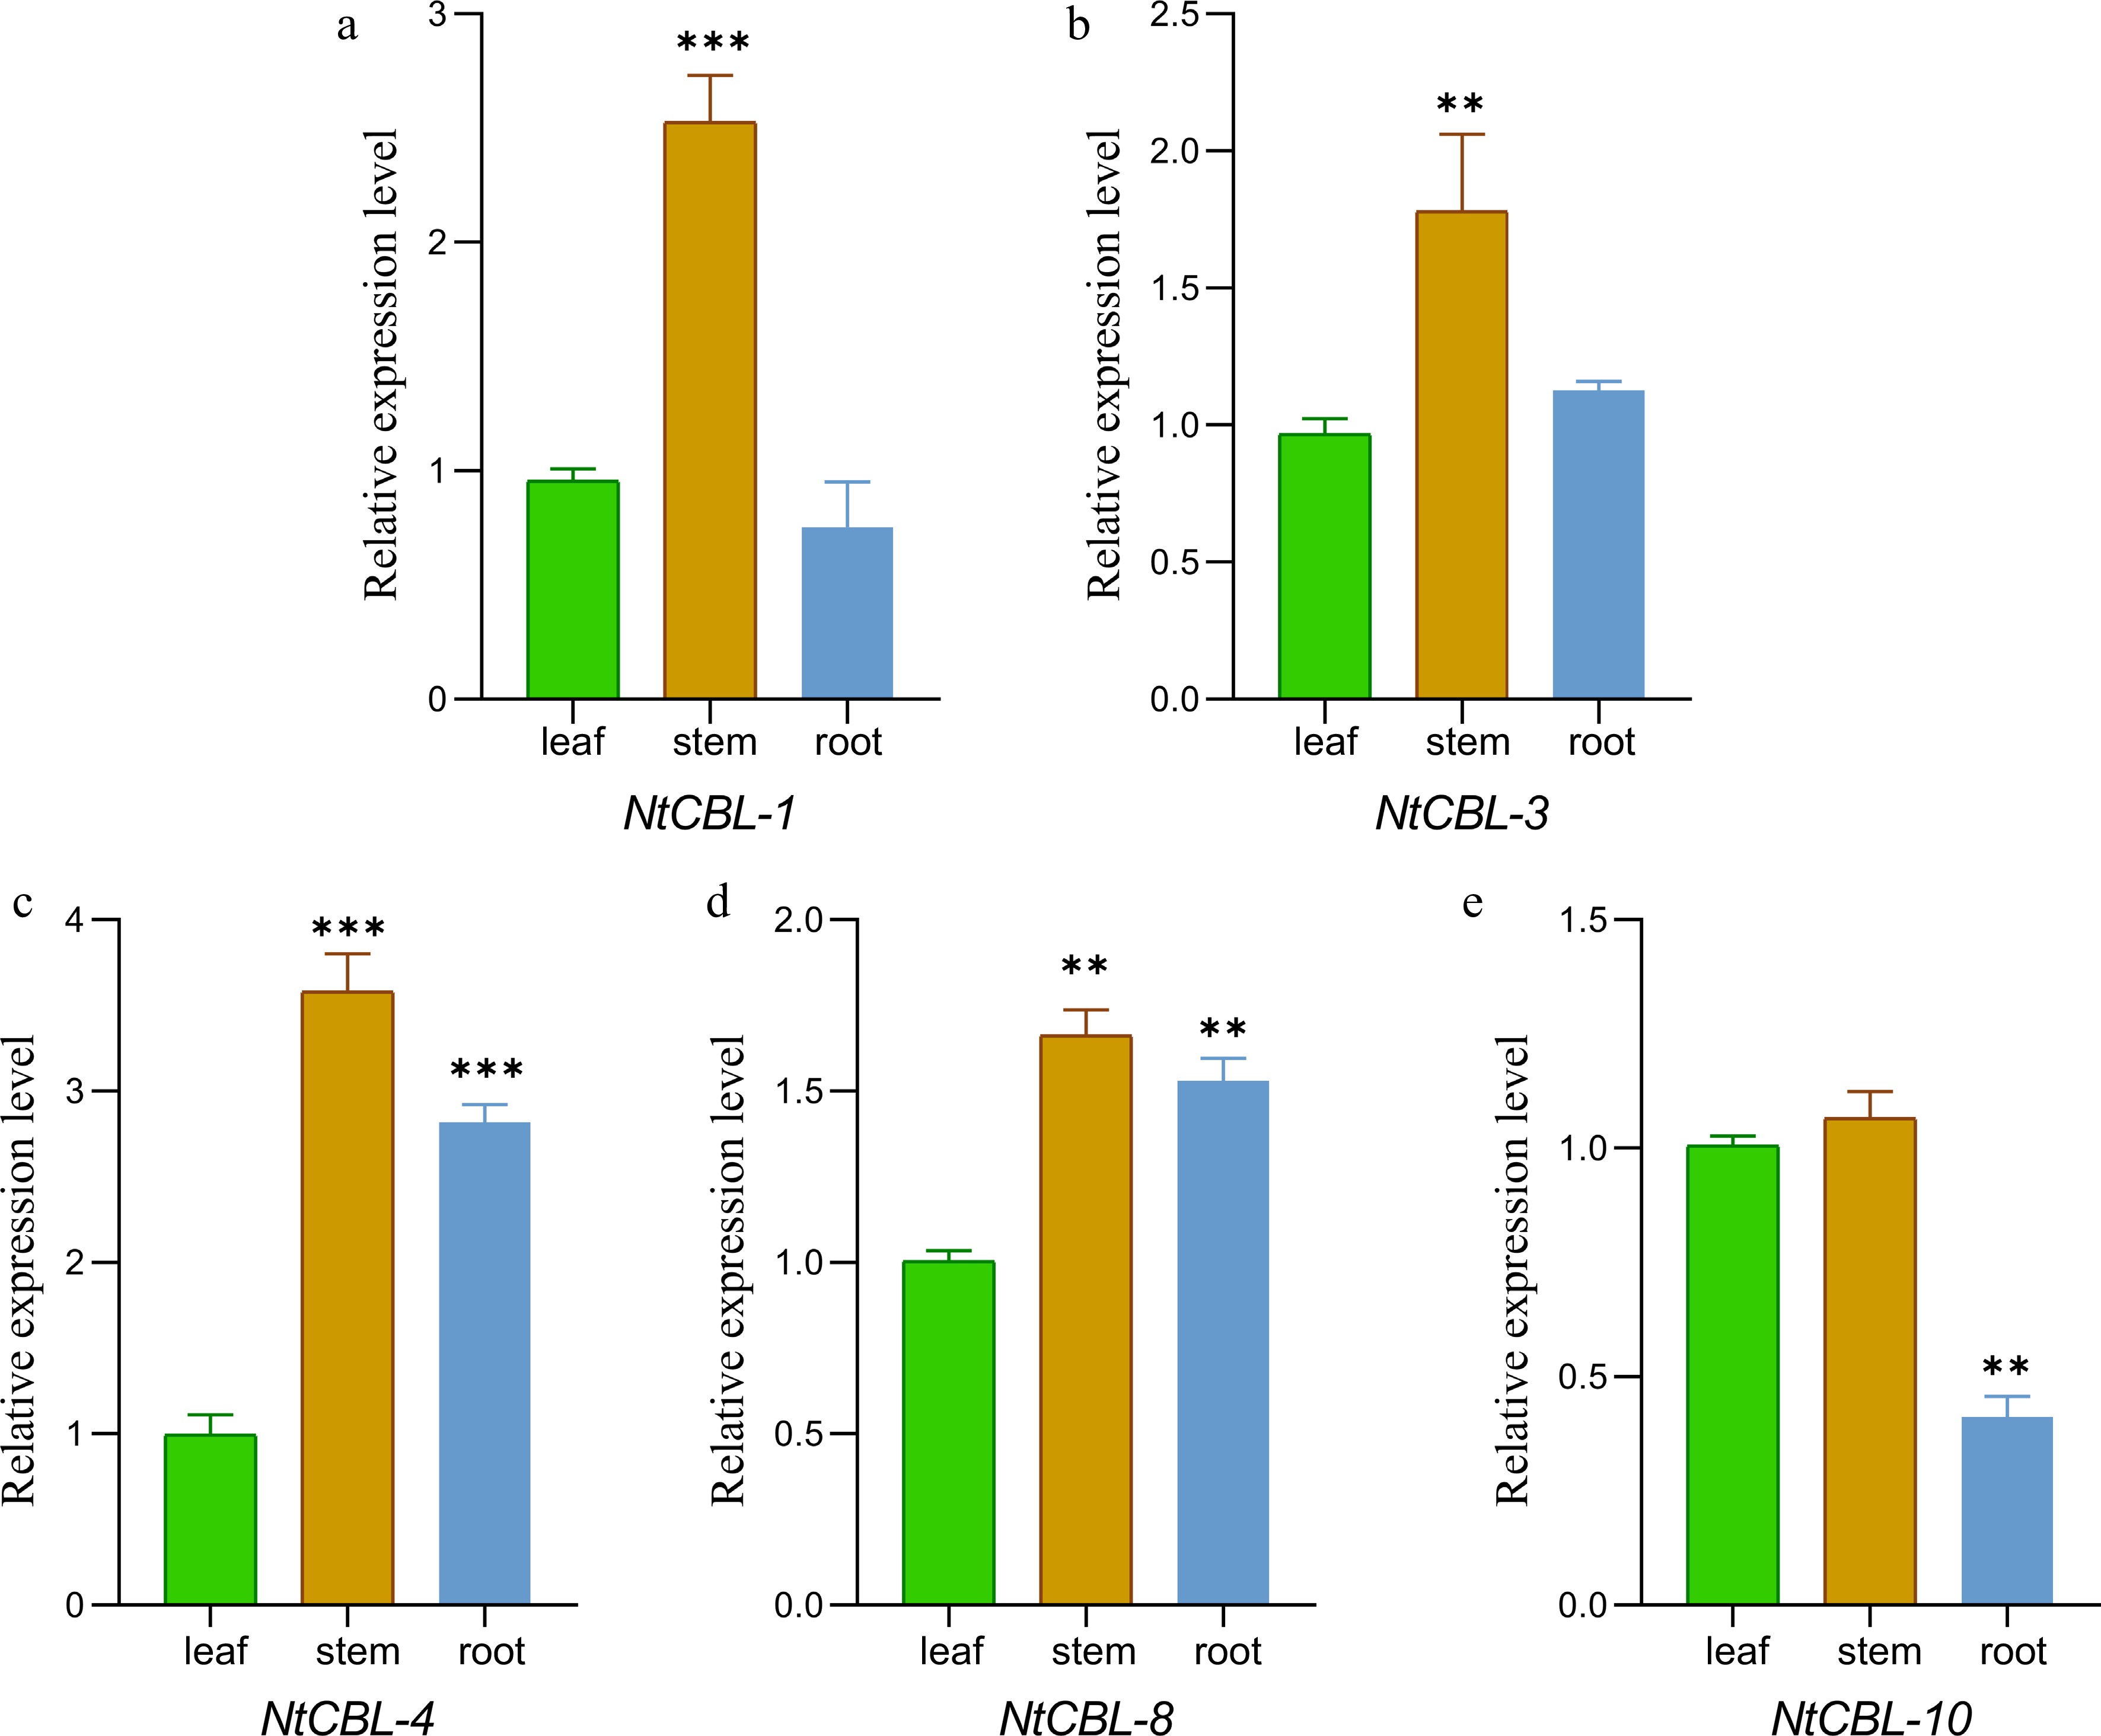
Figure 5.
The gene expression characteristics of N. tangutorum CBL genes in root, stem, and leaf tissues were analyzed by fluorescence quantitative PCR. **p < 0.01, ***p < 0.001 (ANOVA followed by Tukey’s HSD).
-
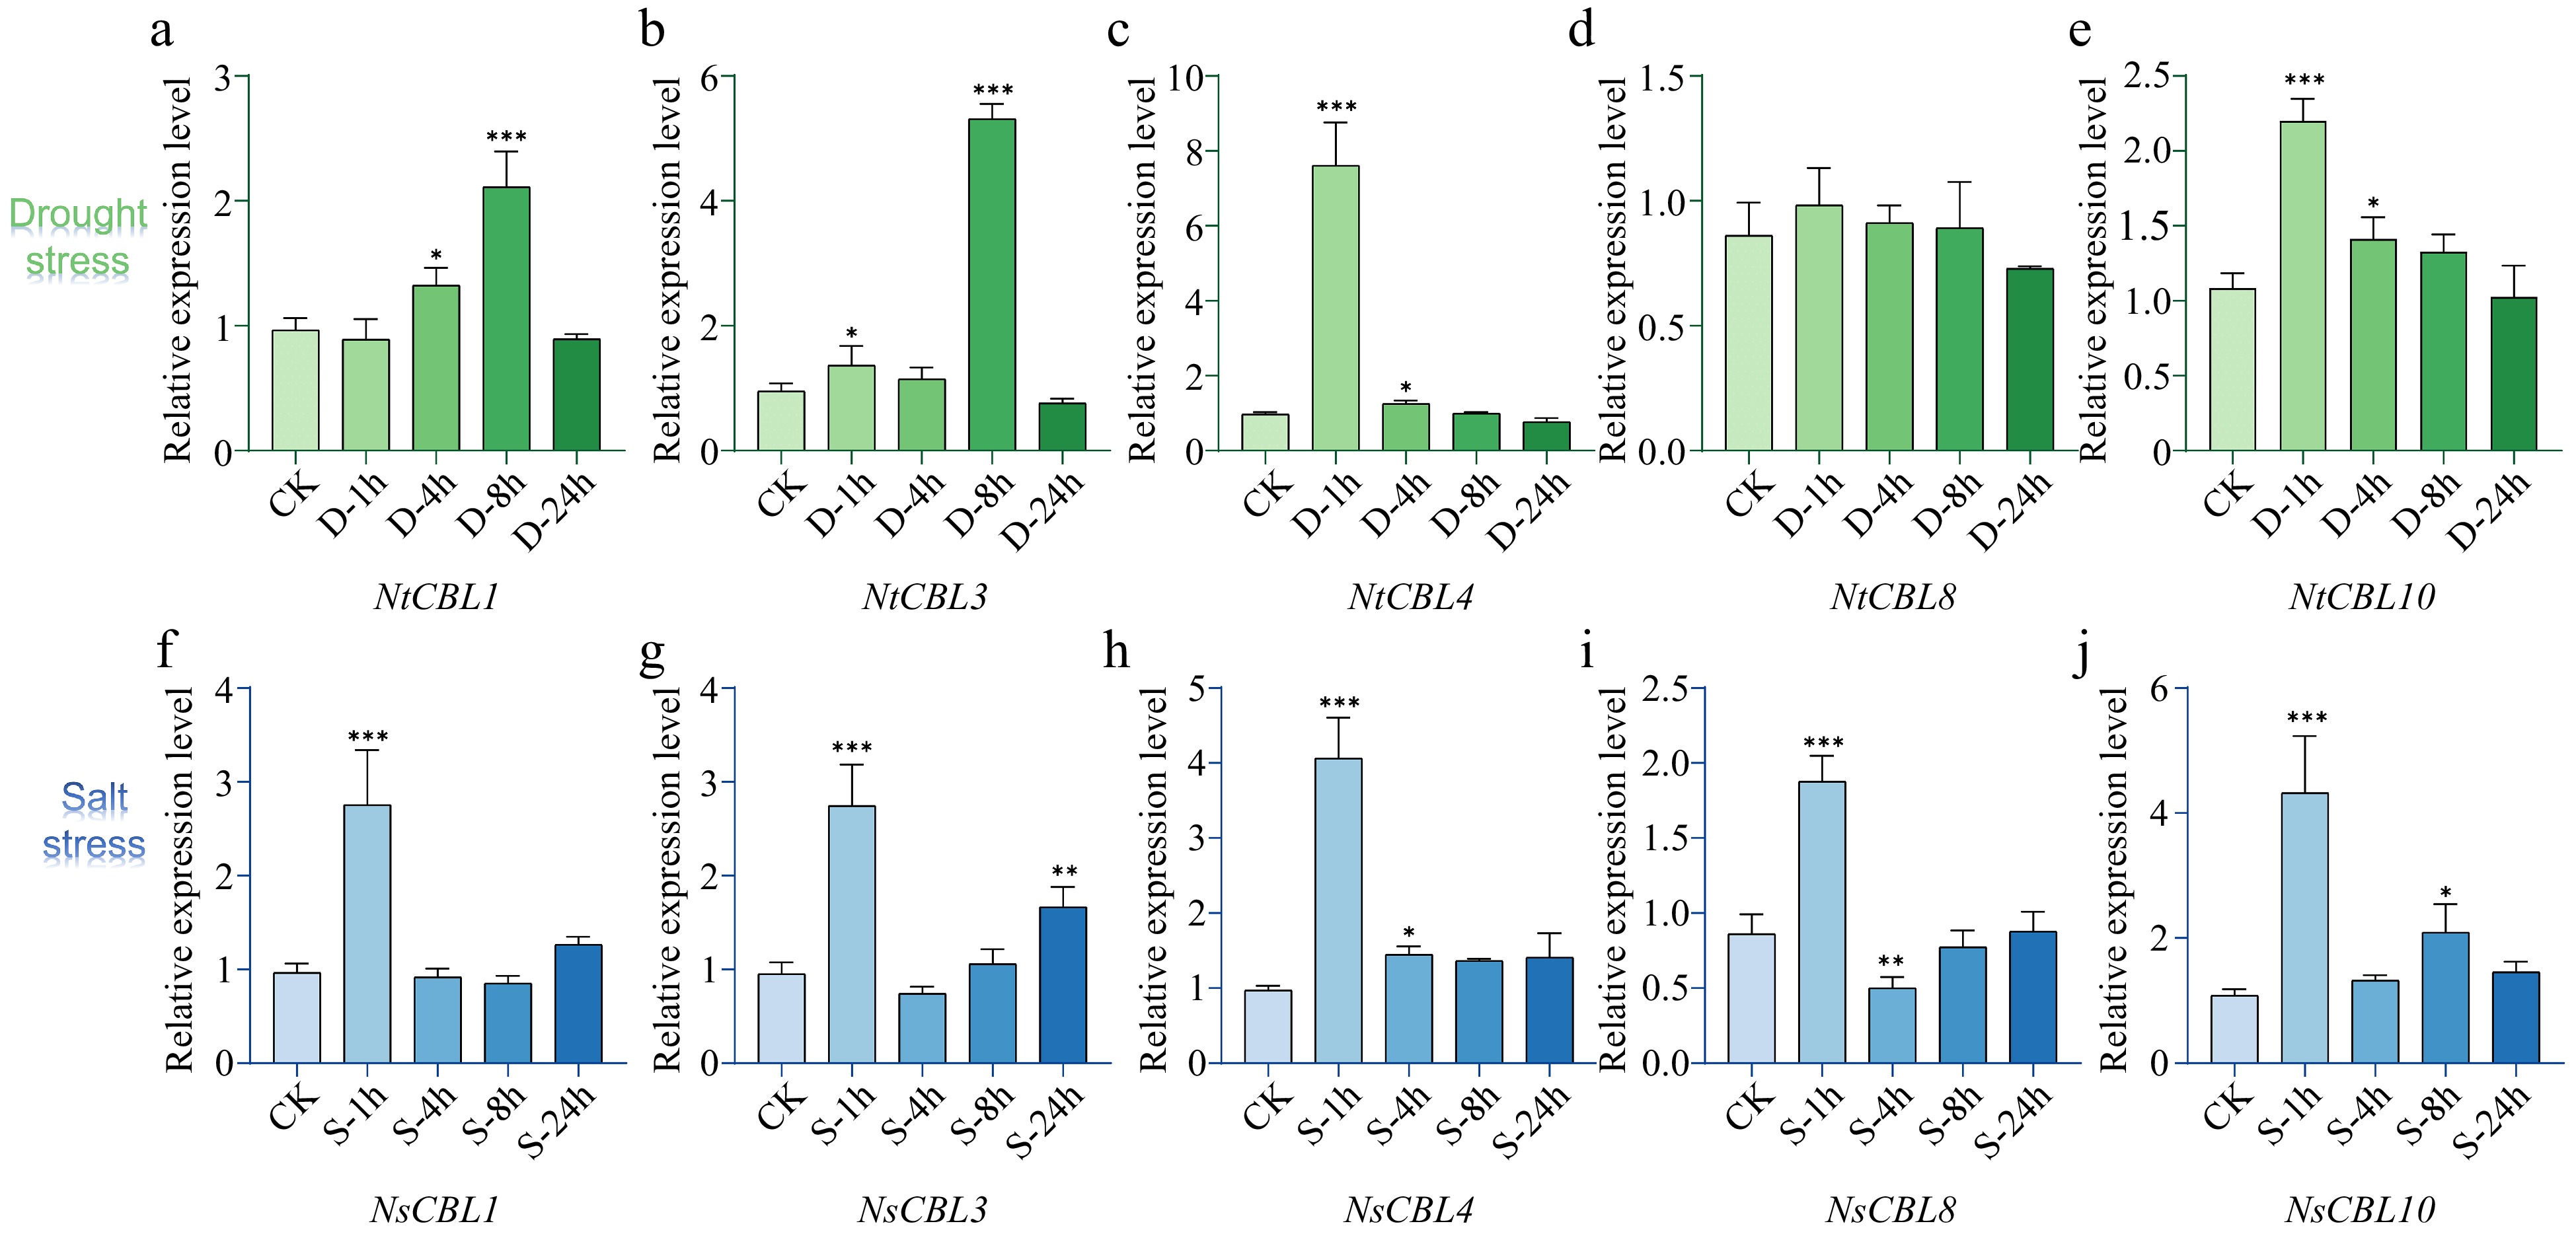
Figure 6.
Expression patterns of NtCBL genes during drought (upper panels) and salt stress (lower panels) in N. tangutorum. 'ck' stands for untreated control, while '1h', '4h', '8h', and '24h' respectively represent different time points of salt or stress treatment, which are 1, 4, 8, and 24 h. **p < 0.01, ***p < 0.001 (ANOVA followed by Tukey’s HSD).
-
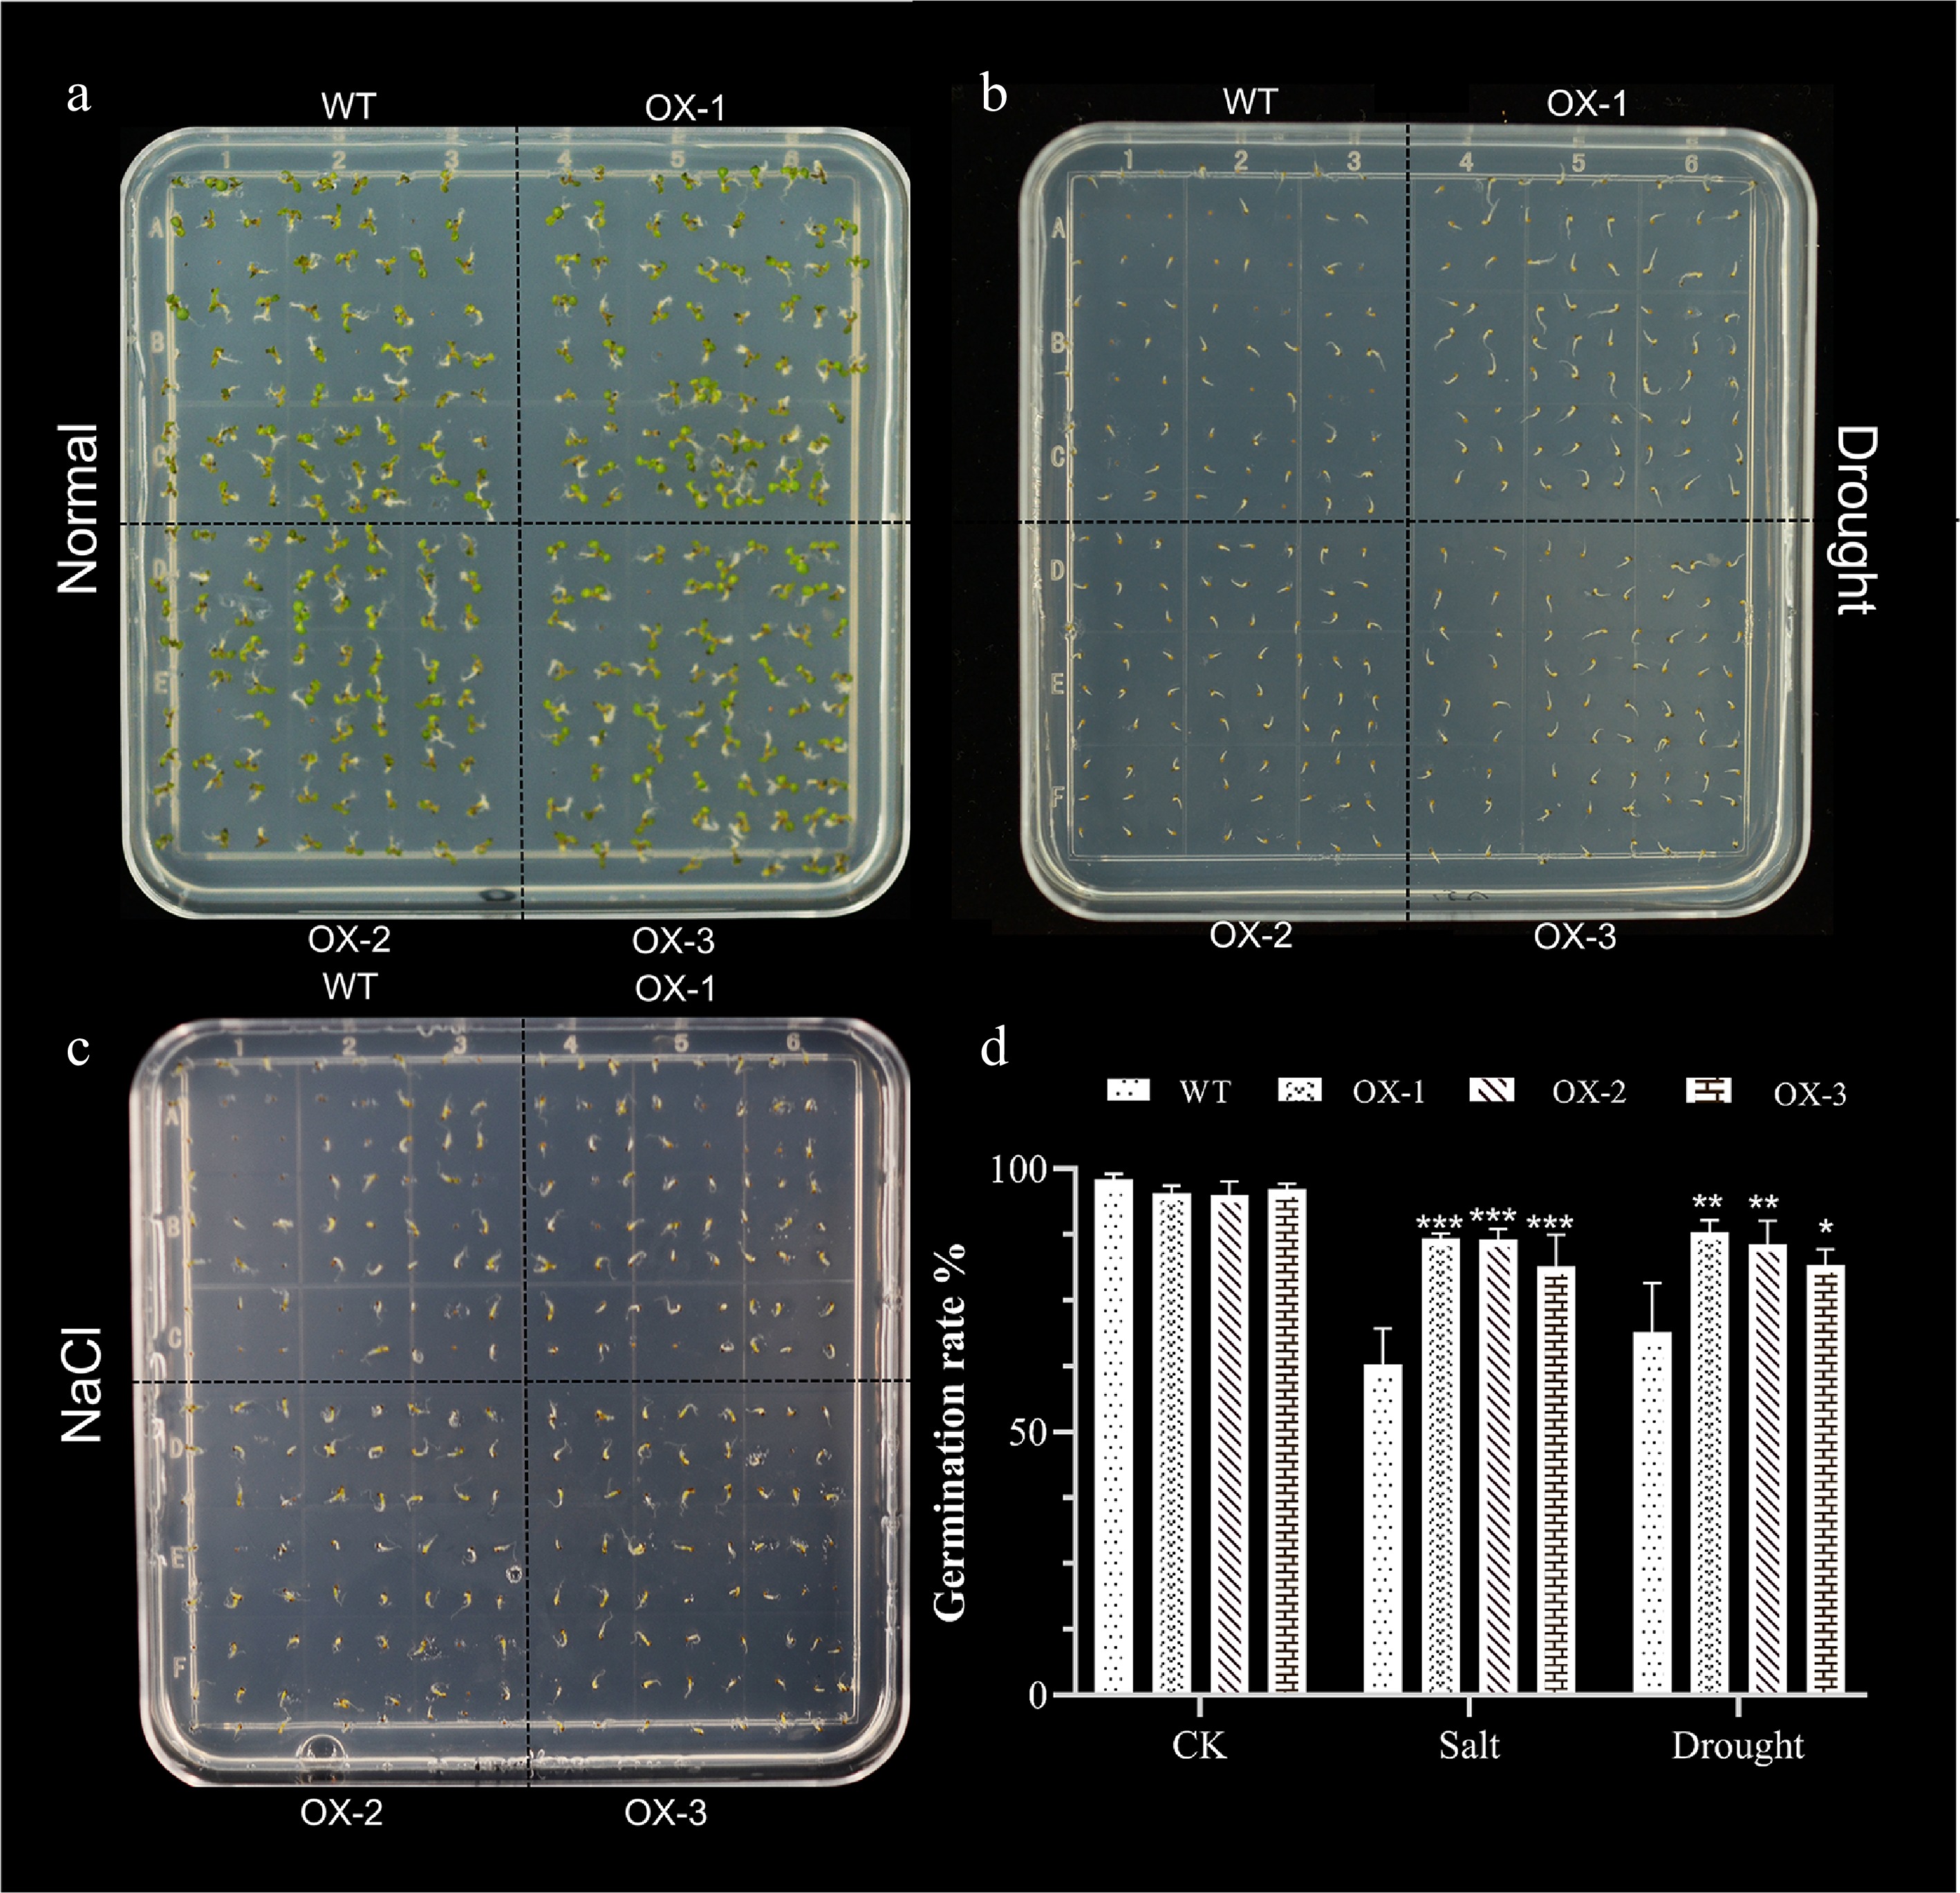
Figure 7.
Heterologous expression of NtCBL1-1 increases Arabidopsis germination rates under salt and drought stress. (a)−(c) Phenotypic charts of germination rates under normal growth conditions, 150 mM NaCl treatment, and 300 mM mannitol treatment, with about 70 seeds per dish and three replicates for each experiment. (d) Germination rate statistics of Arabidopsis overexpressing NtCBL1-1 under normal growth conditions, 150 mM NaCl treatment, and 300 mM mannitol treatment. *p < 0.05, **p < 0.01, ***p < 0.001 (ANOVA followed by Tukey’s HSD).
-
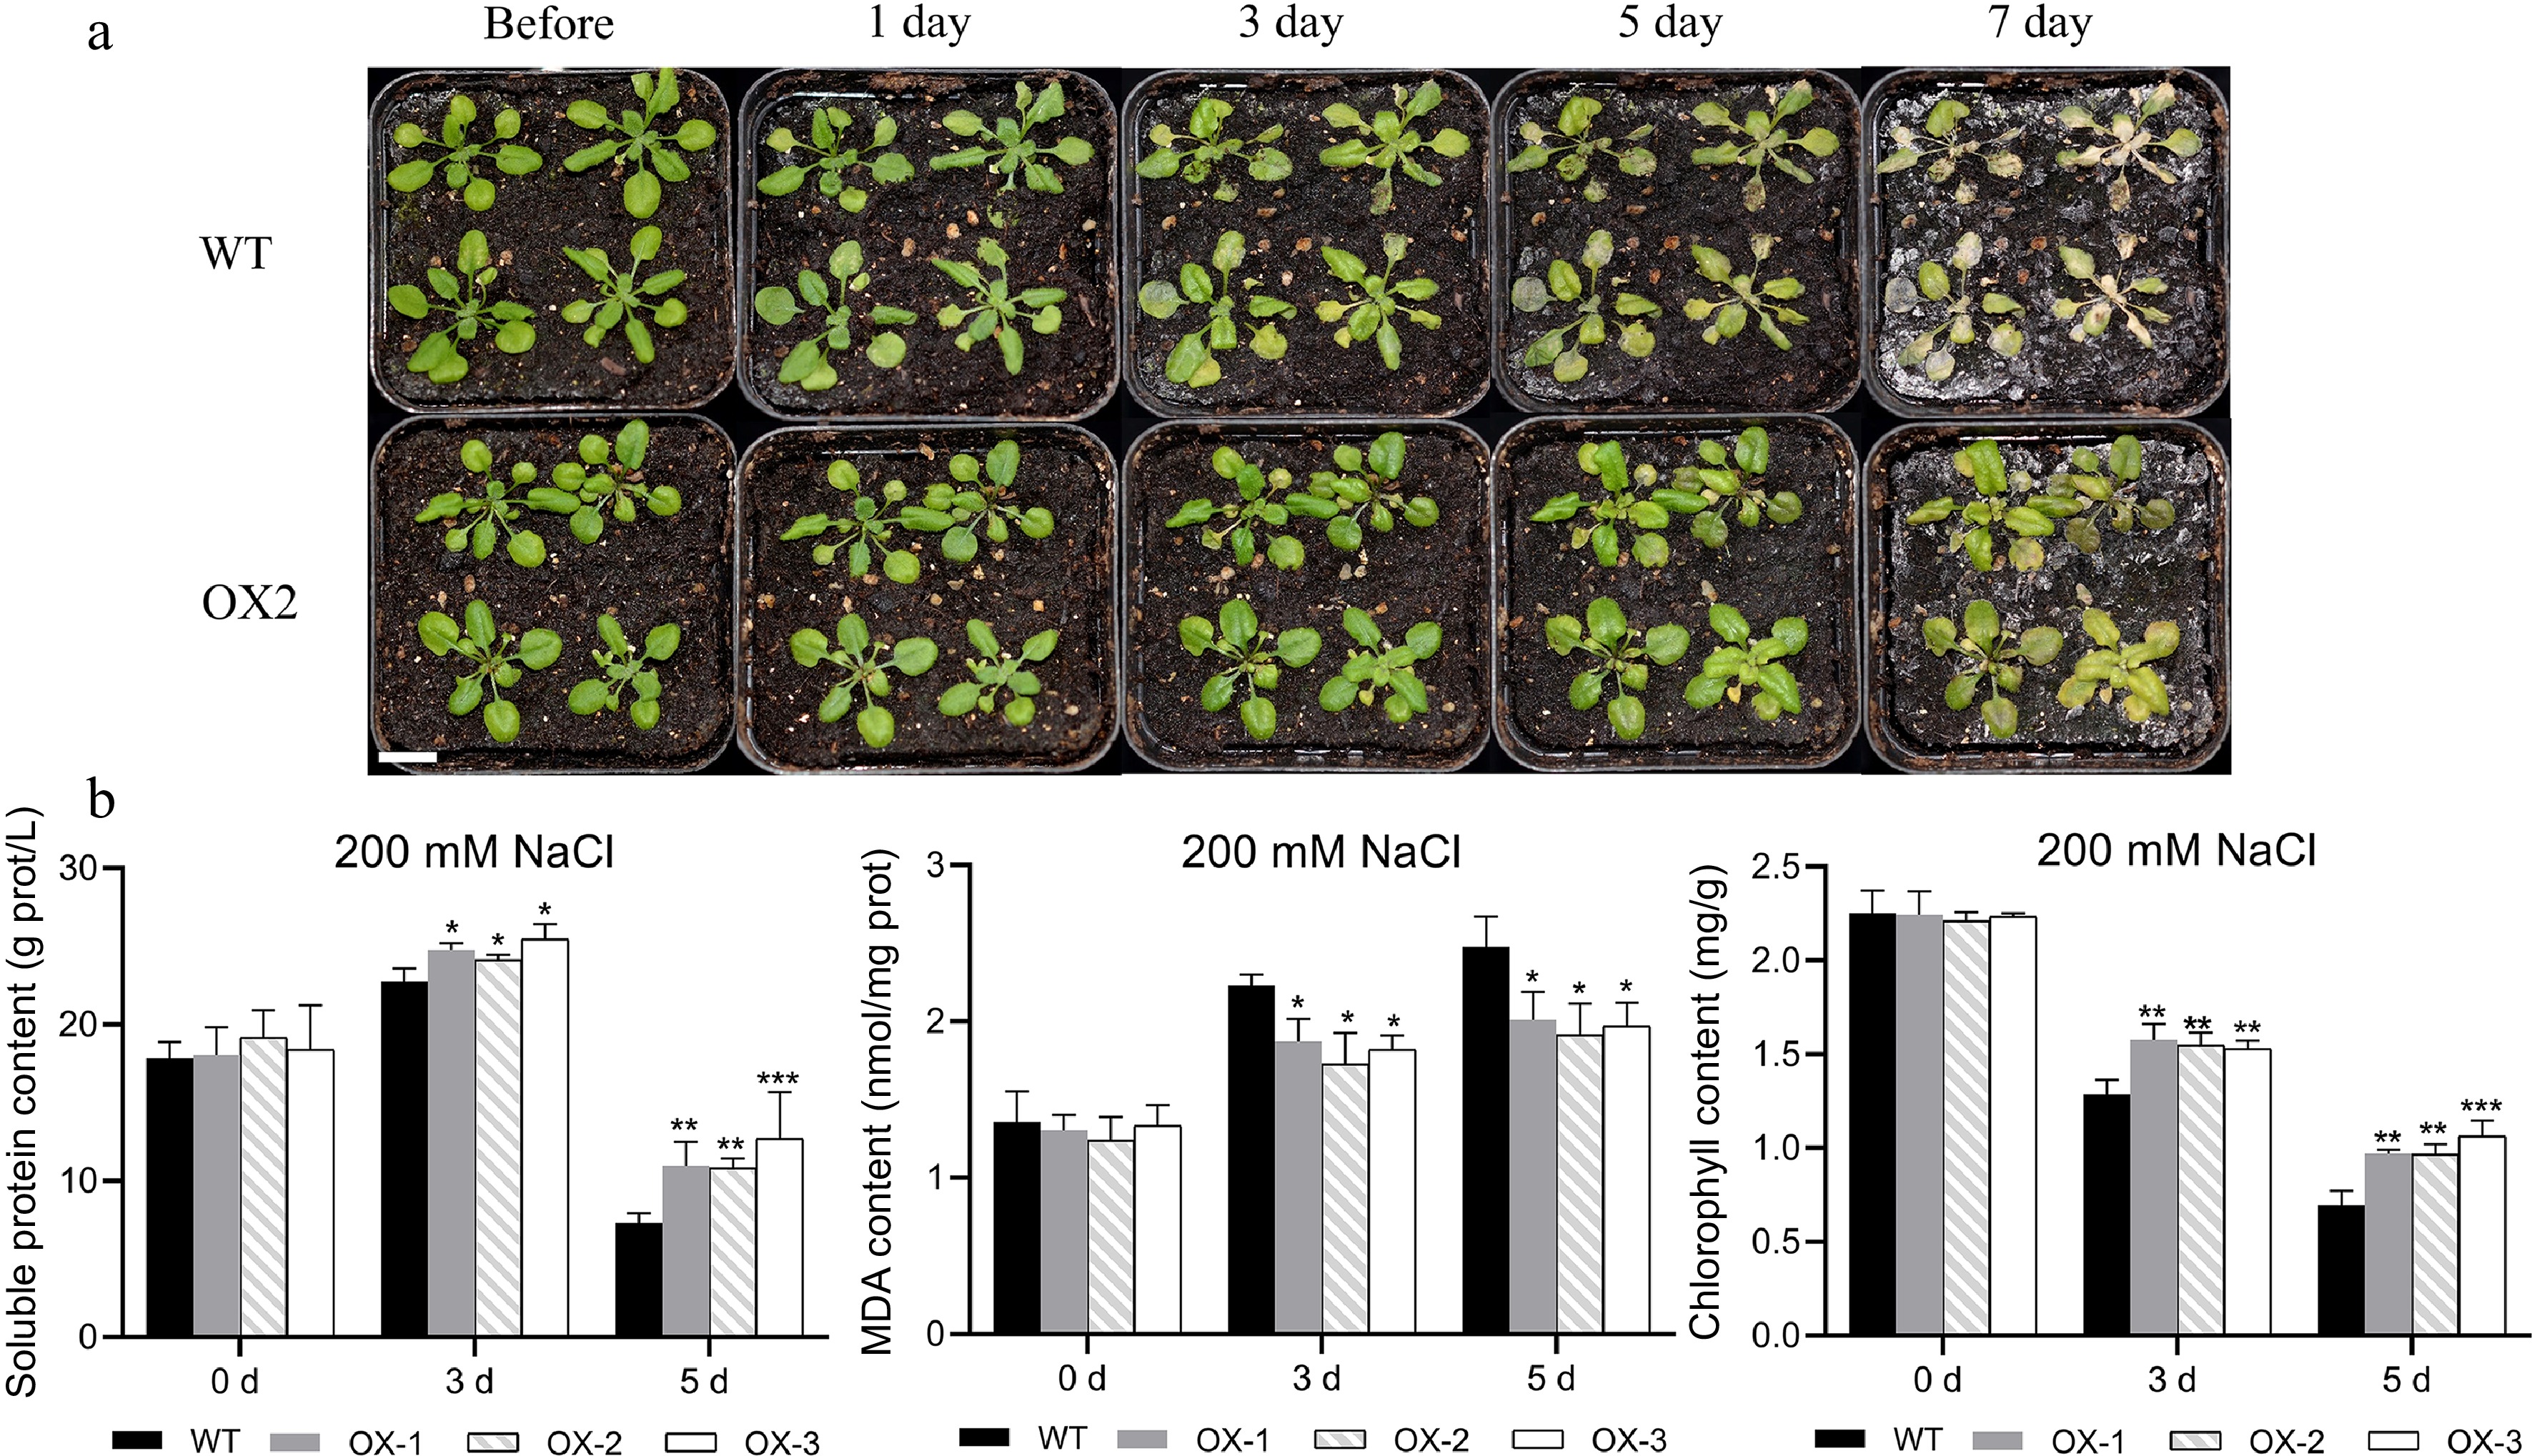
Figure 8.
Heterologous overexpression of NtCBL1-1 increased salt tolerance in Arabidopsis. (a) Wild-type Arabidopsis phenotypes and overexpression lines exposed to 200 mM NaCl for 0–7 d. (b) Chlorophyll content, soluble protein content, and MDA content after 0–5 d of exposure to 200 mM NaCl. Statistical significance denoted as *p < 0.05, **p < 0.01, ***p < 0.001 (ANOVA followed by Tukey’s HSD).
-
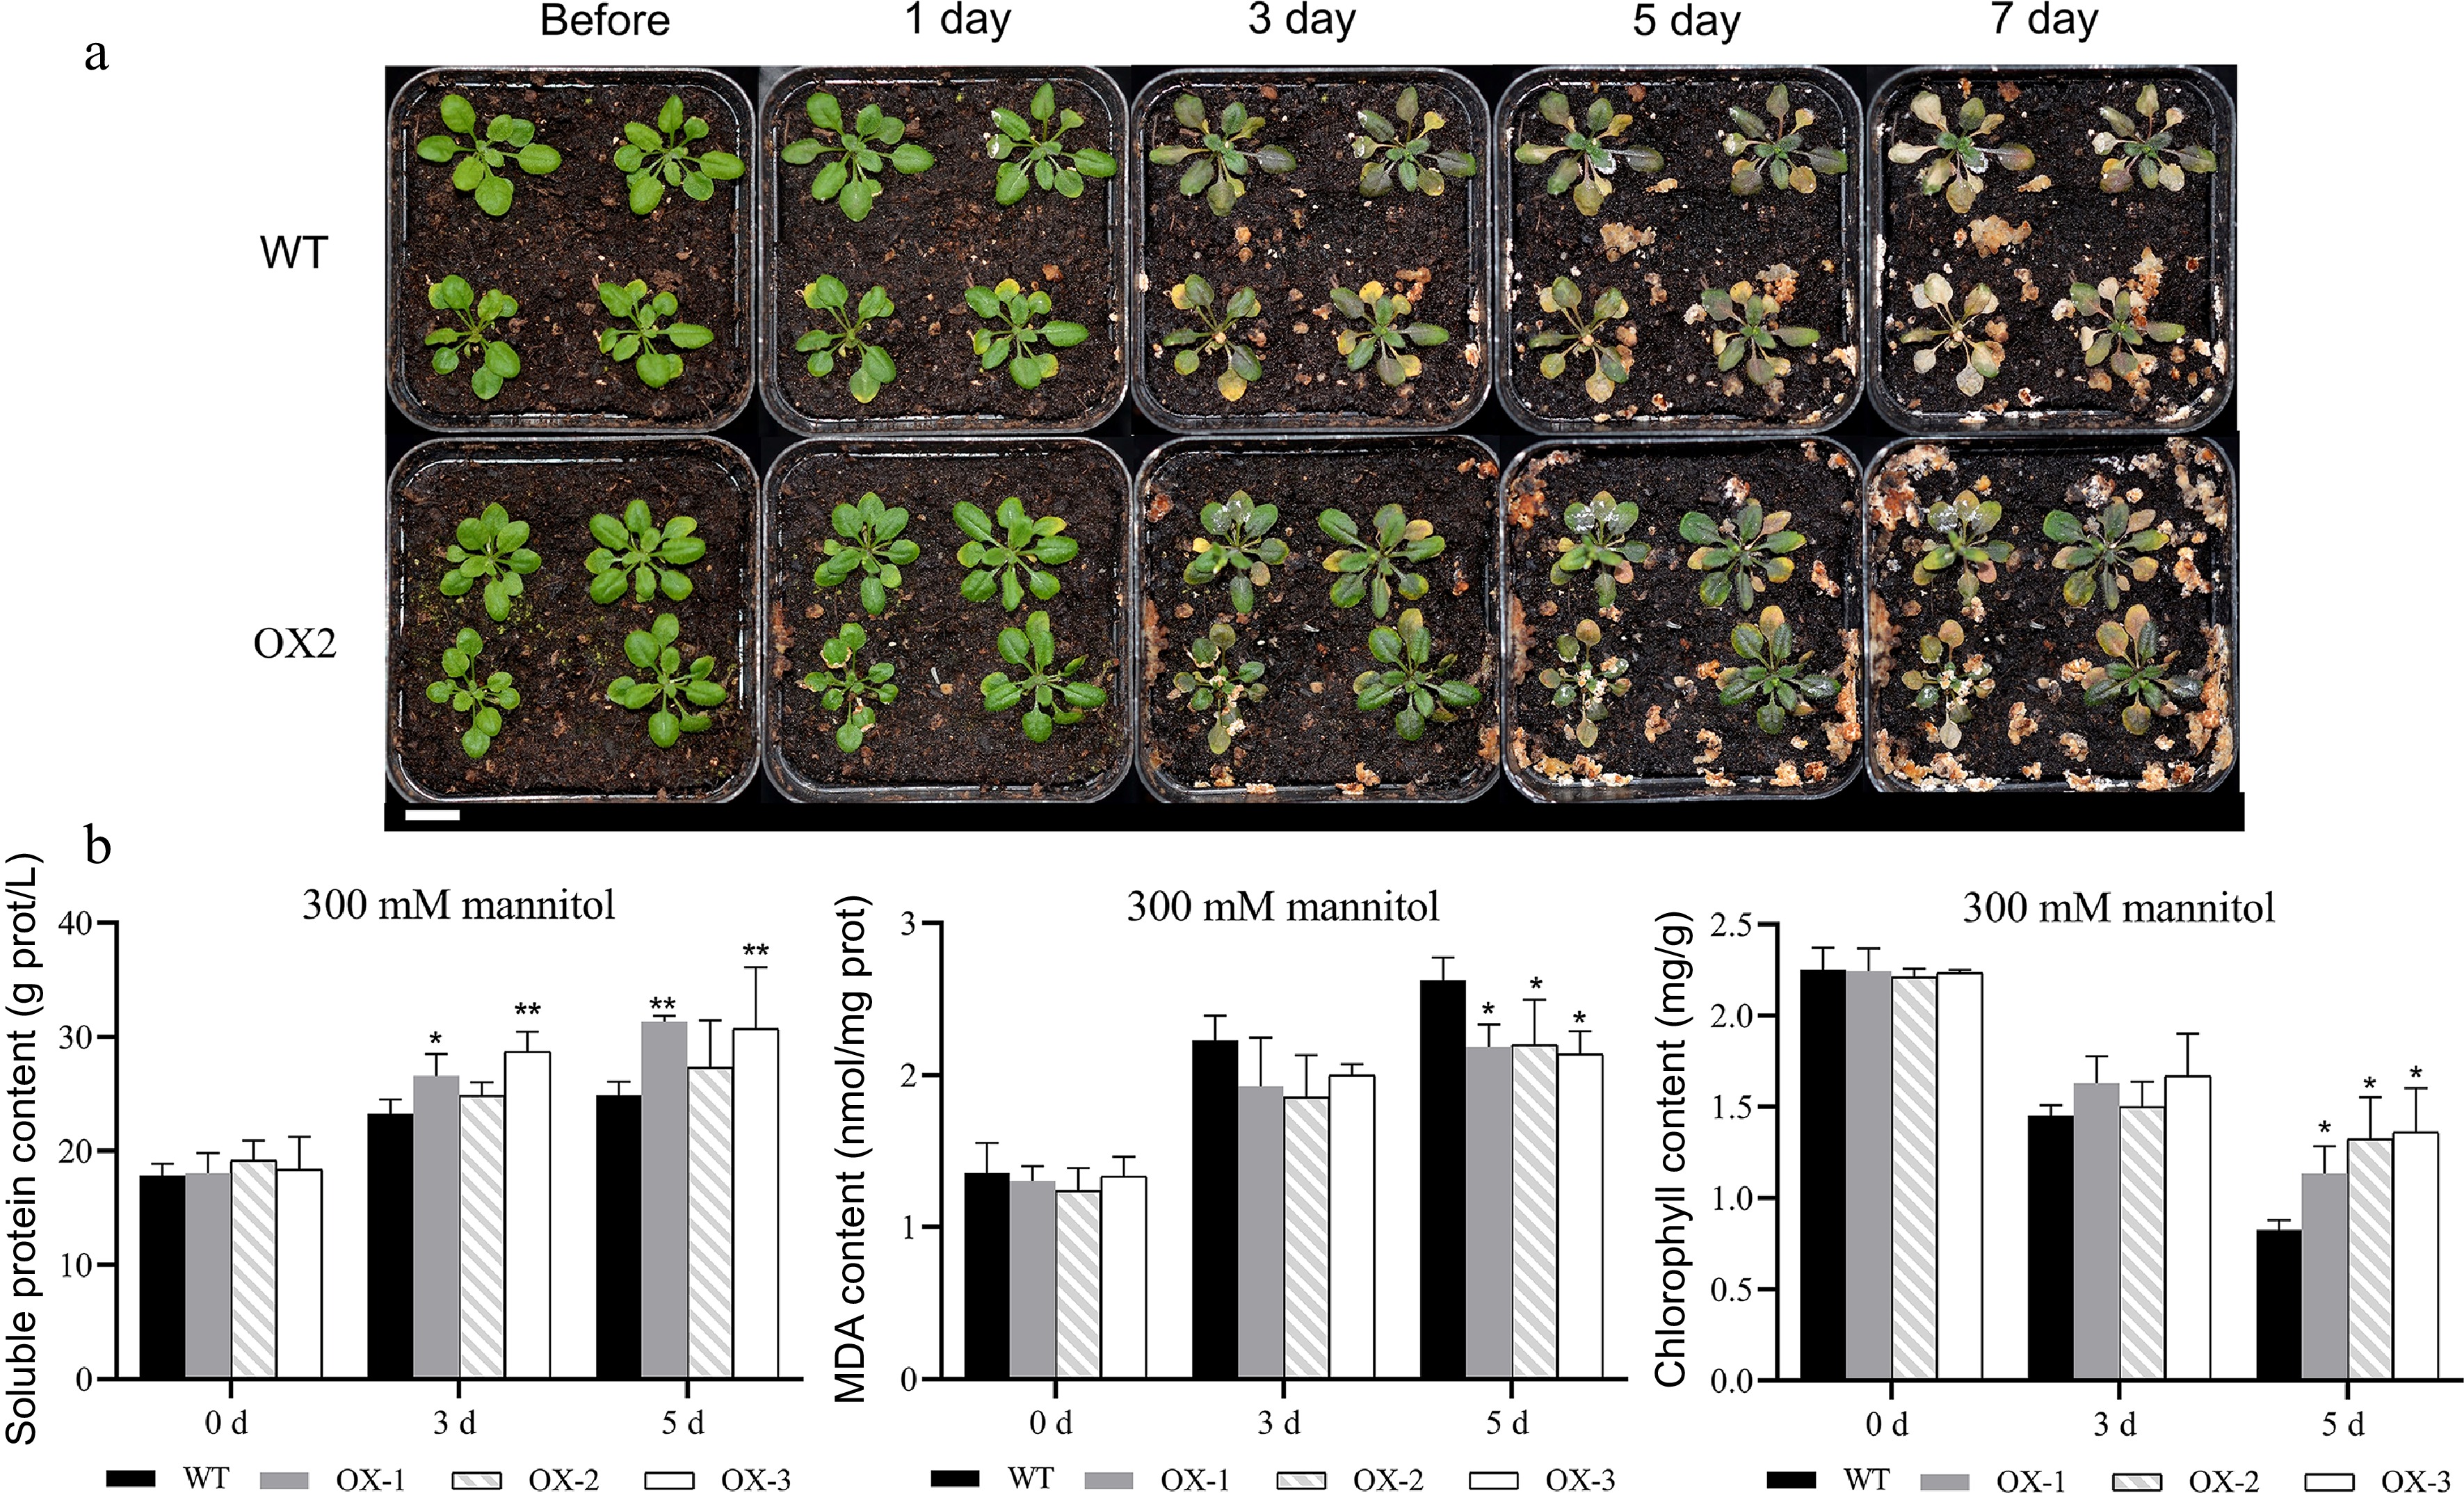
Figure 9.
Heterologous overexpression of NtCBL1-1 in Arabidopsis increased drought stress tolerance. (a) Phenotypic comparison between wild-type Arabidopsis and overexpression lines under 300 mM mannitol exposure for 0–7 d. (b) Chlorophyll content, soluble protein content, and MDA content of wild-type Arabidopsis and overexpression lines exposed to 300 mM mannitol for 0–5 d. Statistical significance denoted as *p < 0.05, **p < 0.01 (ANOVA followed by Tukey’s HSD).
-
Gene ID Original ID Locus Length (aa) MW (kDa) PI Subcellular localization prediction NtCBL1-1 NITAA04G1075 Chr4A 213 24.48 4.66 Plasma membrane NtCBL1-2 NITAB04G1197 Chr4B 213 24.48 4.66 Plasma membrane NtCBL3-1 NITAB02G1010 Chr2B 252 29.06 5.05 Plasma membrane NtCBL3-2 NITAA02G0832 Chr2A 226 26.10 4.82 Plasma membrane NtCBL4-1 NITAA02G2027 Chr2A 213 24.65 5.25 Plasma membrane NtCBL4-2 NITAA02G2024 Chr2A 213 24.72 5.17 Plasma membrane NtCBL4-3 NITAB02G2334 Chr2B 213 24.69 5.24 Plasma membrane NtCBL8-1 NITAB04G1638 Chr4B 321 36.84 5.22 Plasma membrane NtCBL8-2 NITAA04G1516 Chr4A 226 26.19 5.01 Plasma membrane NtCBL10-1 NITAB05G0933 Chr5B 267 30.71 4.88 Plasma membrane NtCBL10-2 NITAA05G0858 Chr5A 275 31.59 4.94 Plasma membrane Table 1.
Physicochemical properties of CBLs of N.tangutorum
Figures
(9)
Tables
(1)