-
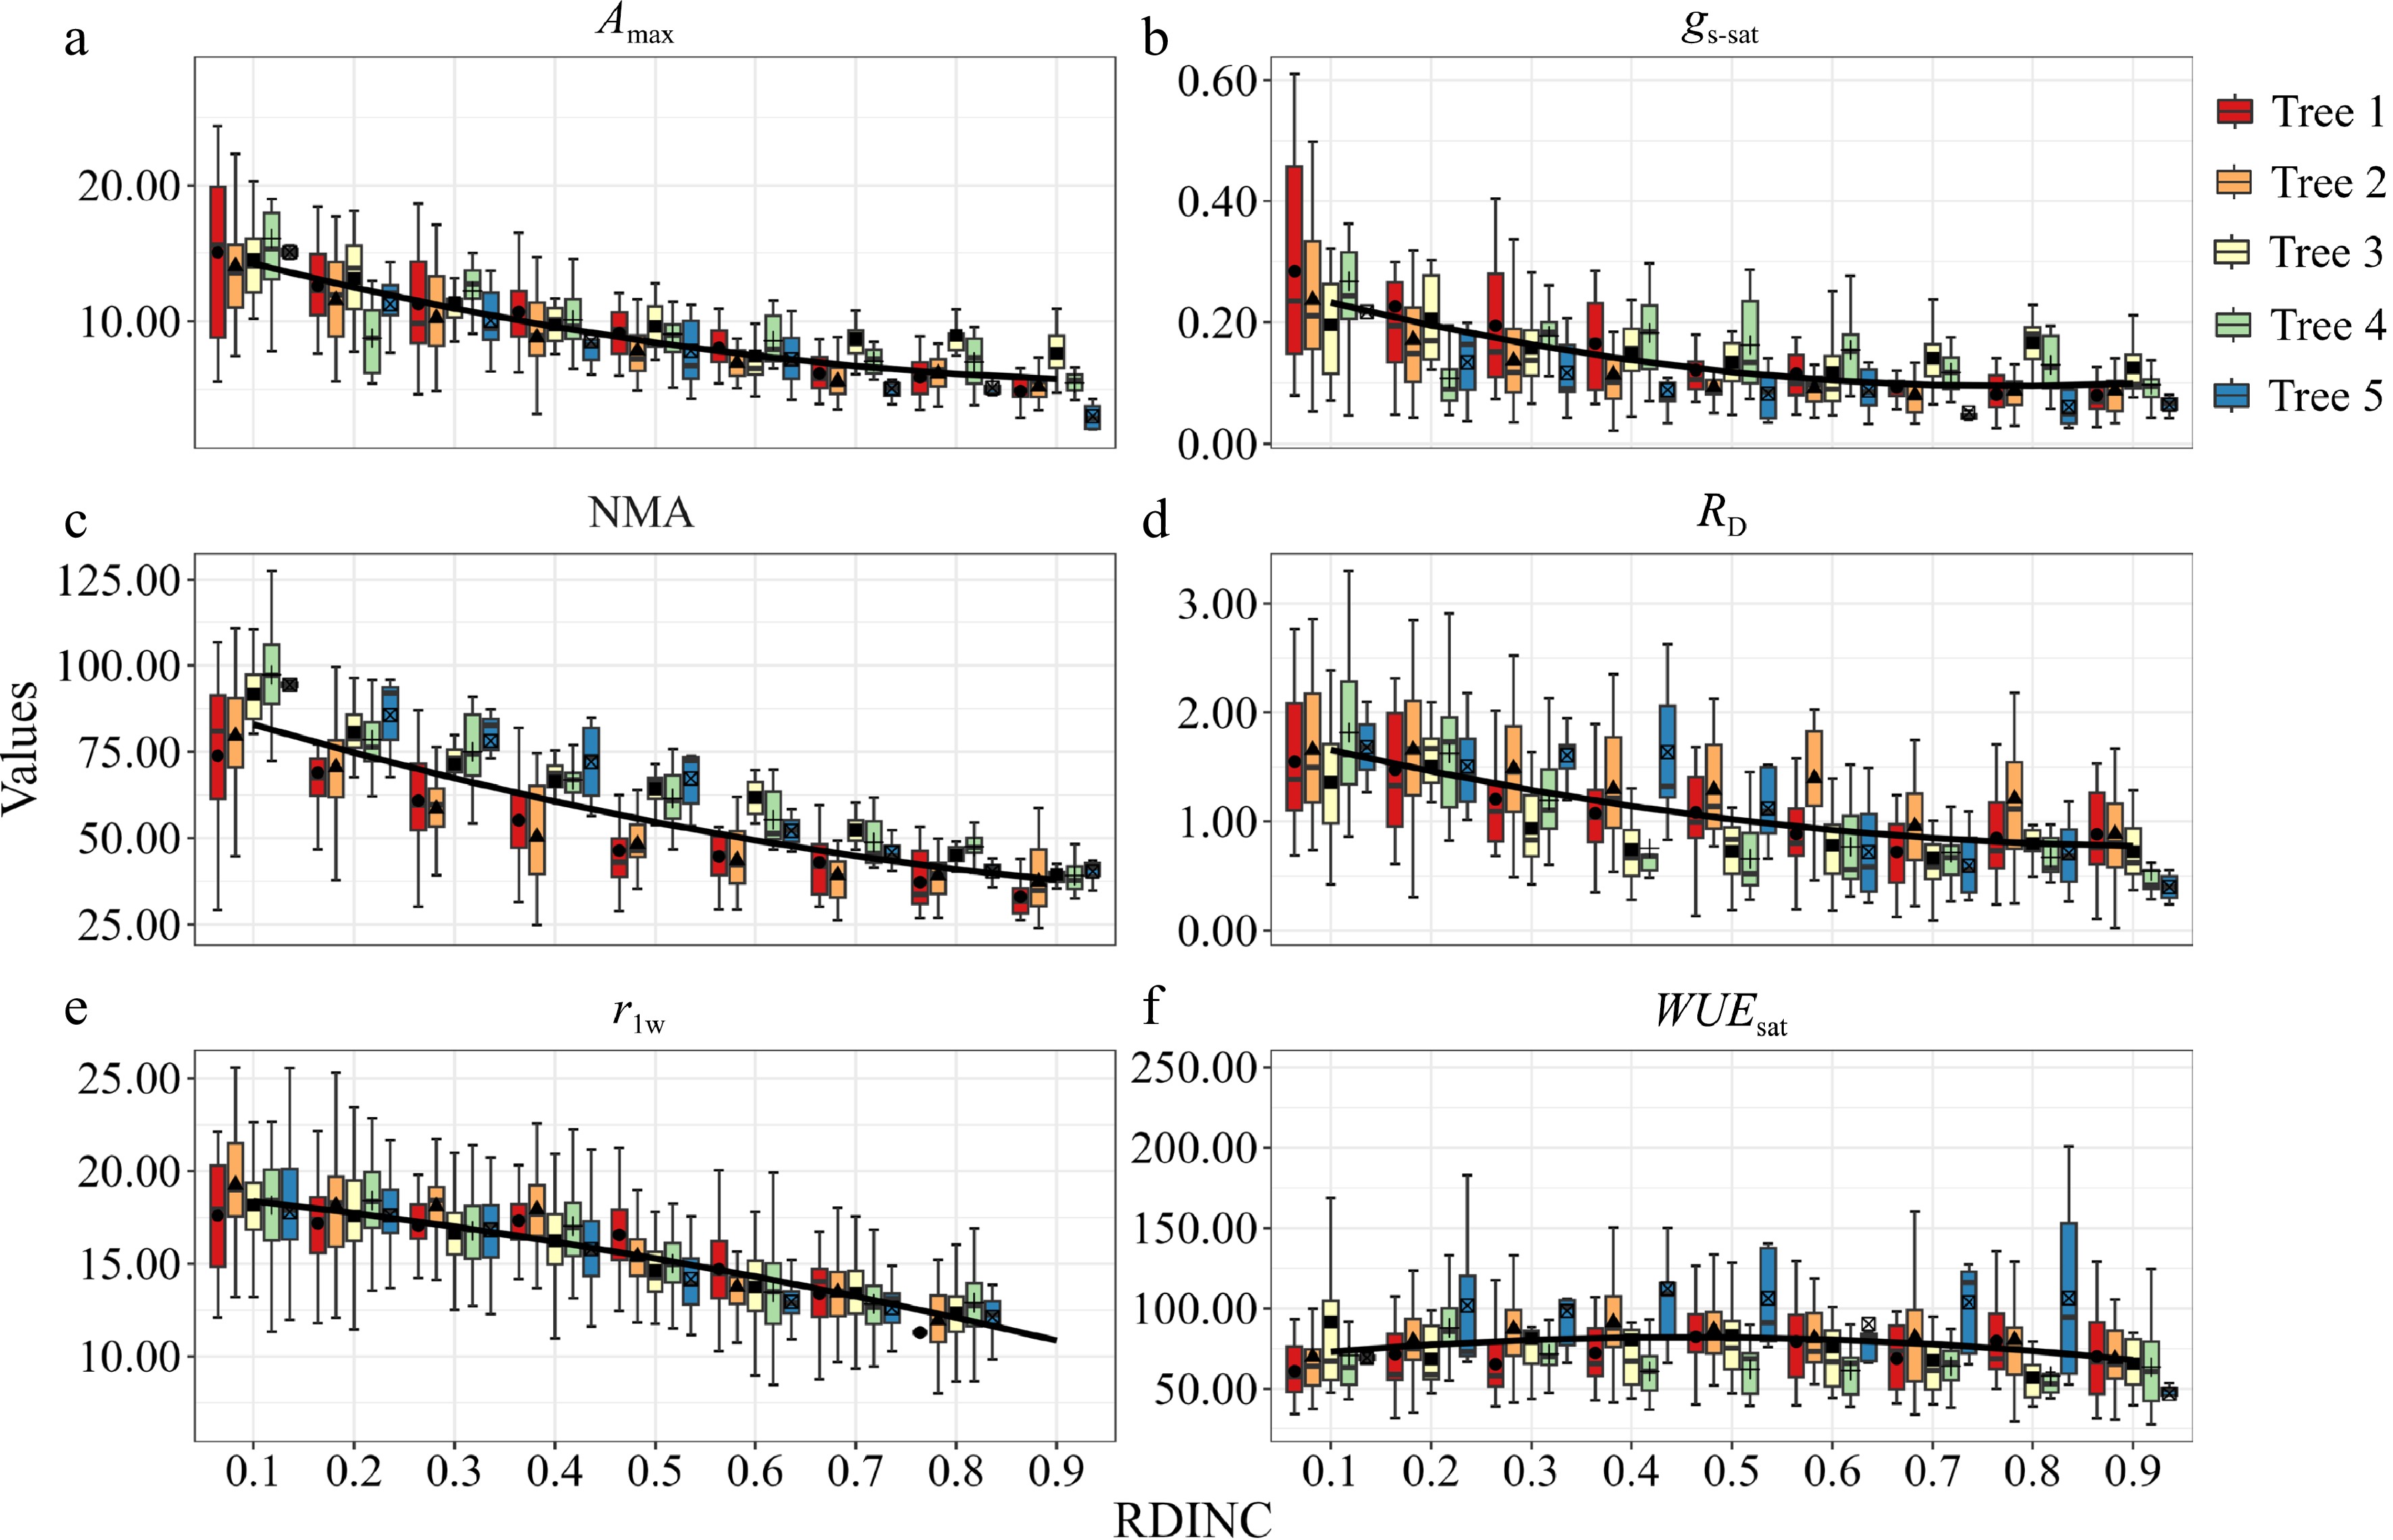
Figure 1.
Vertical profiles of (a) light-saturated net photosynthetic rate (Amax); (b) light-saturated stomatal conductance (gs-sat); (c) needle mass per area (NMA); (d) dark respiration (RD); (e) ratio of length to width of needles (rlw) and (f) light-saturated water use efficiency (WUEsat). Data points represented seasonal mean values (solid bars represented stand error). Black solid line represented mean values of five sample trees (a)−(f).
-
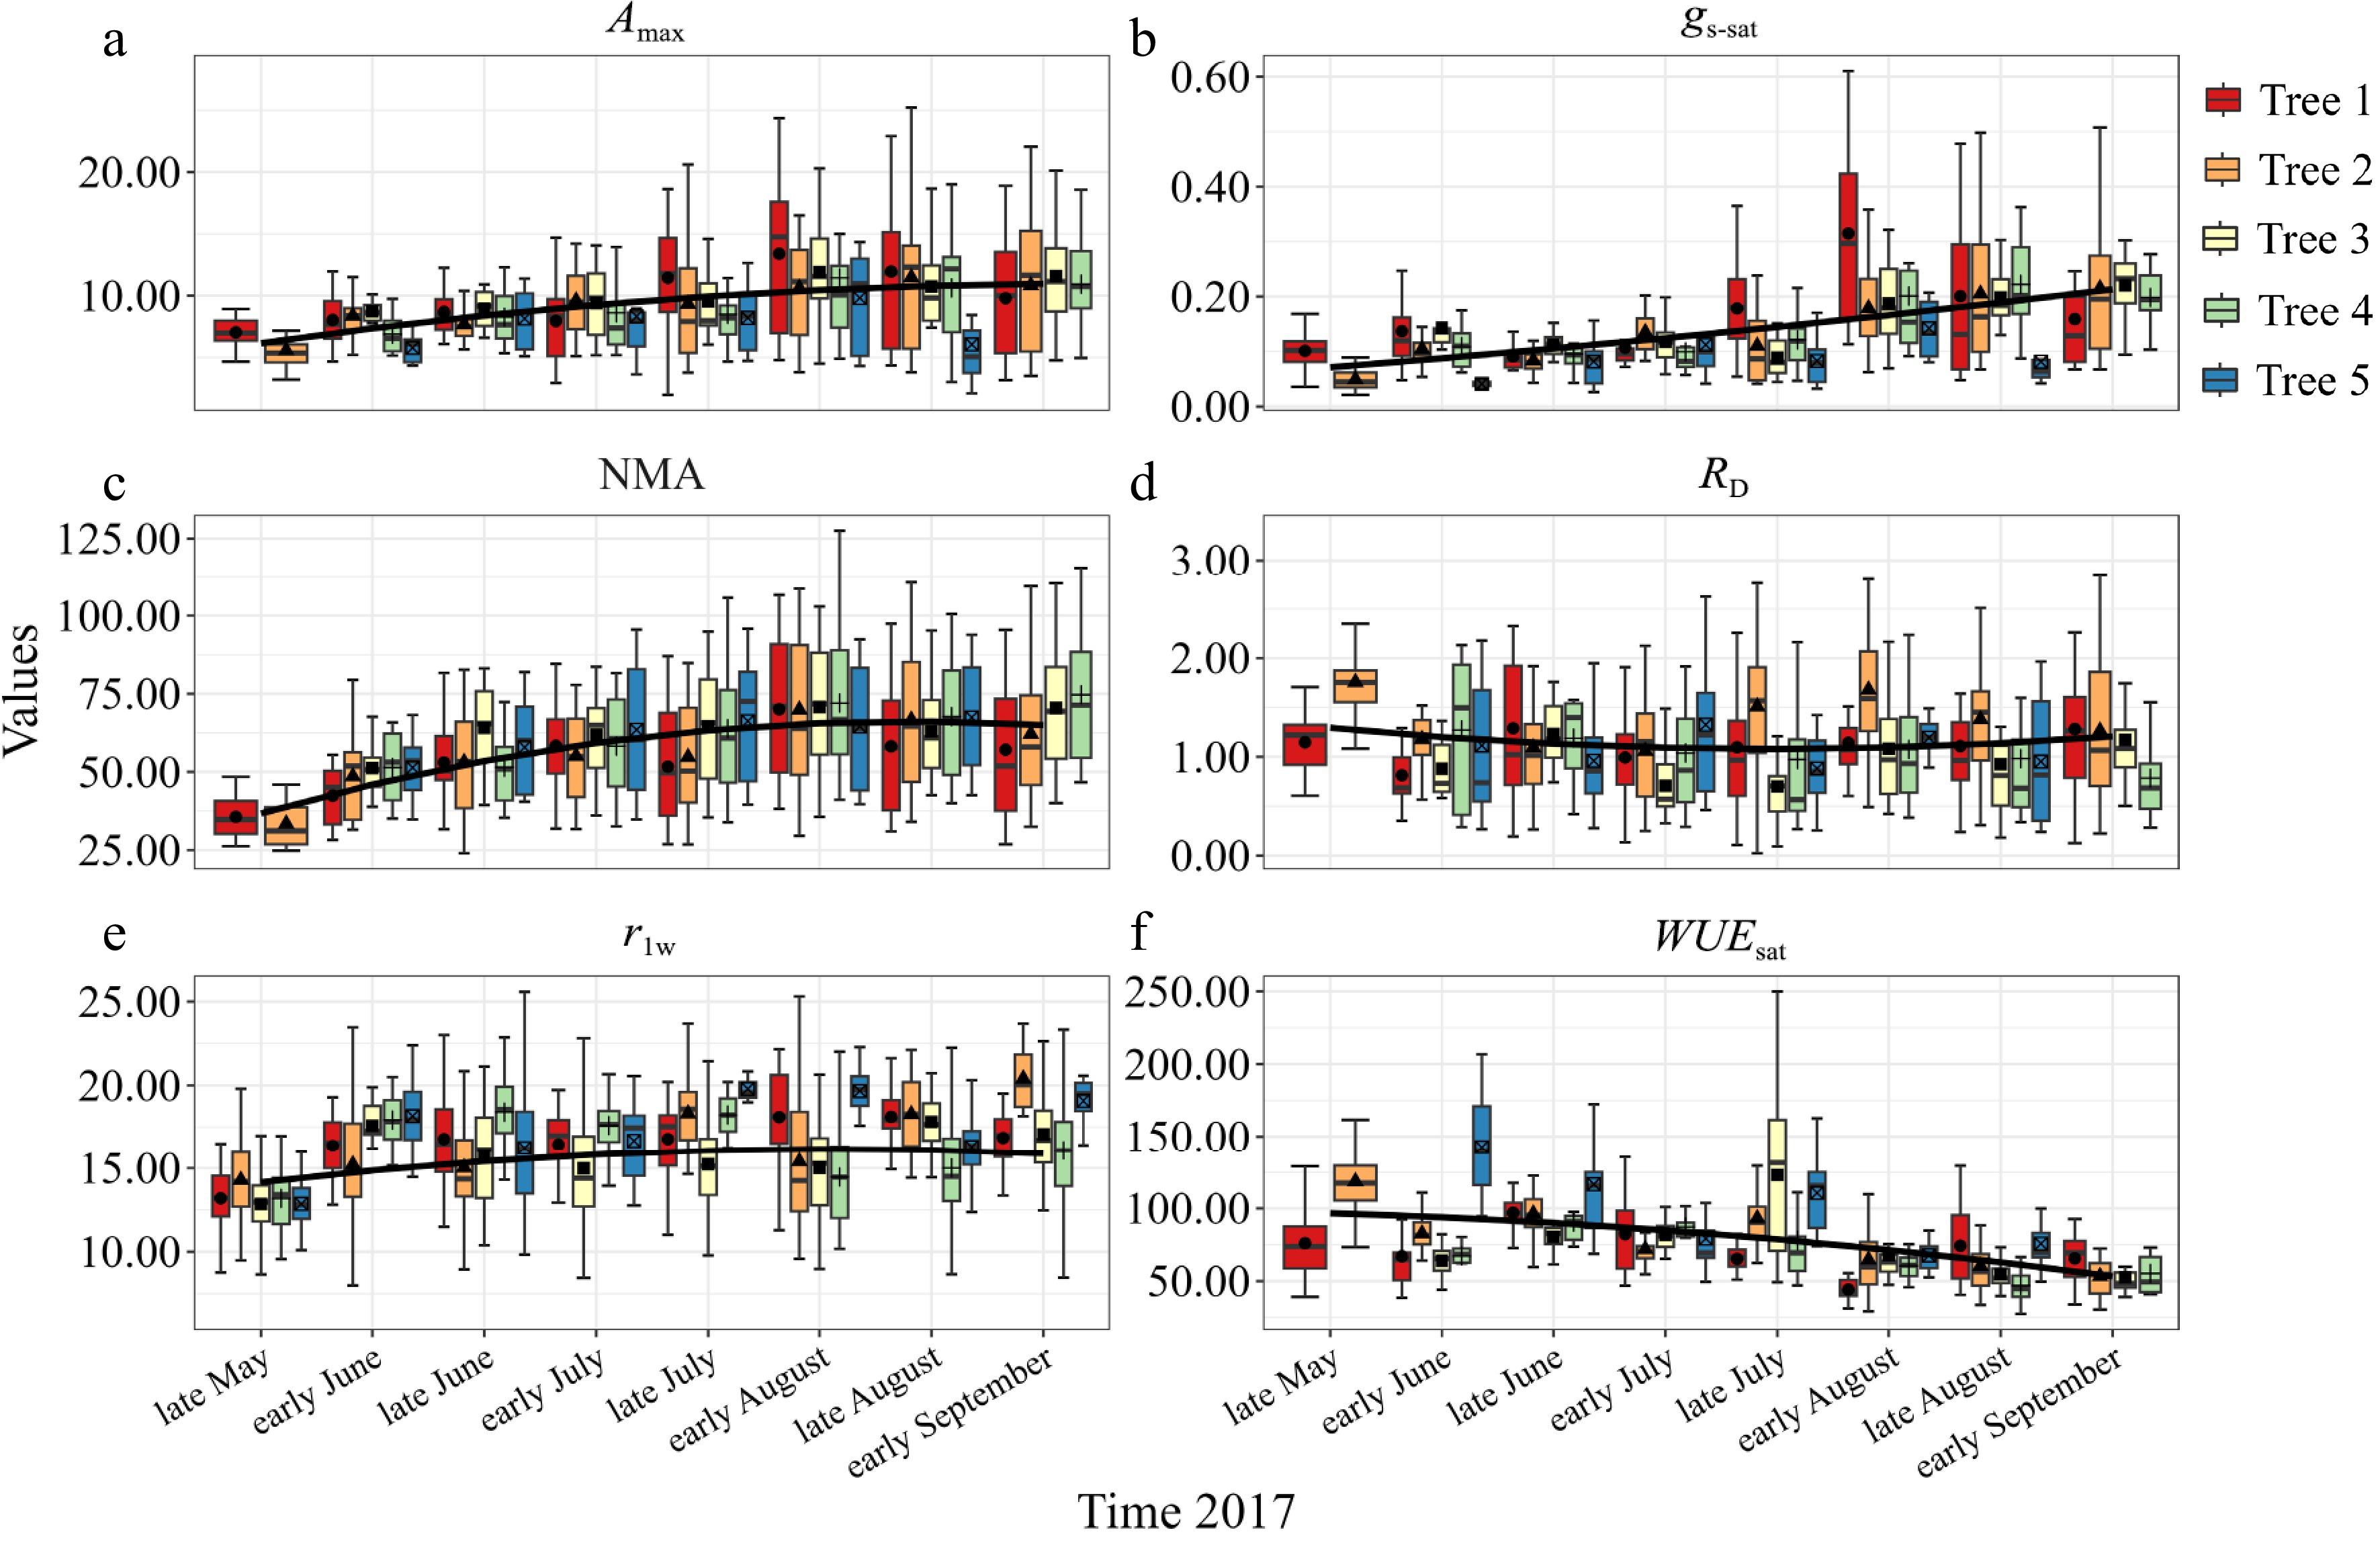
Figure 2.
Seasonal evolution of (a) light-saturated net photosynthetic rate (Amax); (b) light-saturated stomatal conductance (gs-sat); (c) needle mass per area (NMA); (d) dark respiration (RD); (e) ratio of length to width of needles (rlw) and (f) light-saturated water use efficiency (WUEsat) for five sample trees. Data points represent seasonal mean values (solid bars represented stand error). Black solid line represented corrective mean values of five sample trees (a)−(f).
-
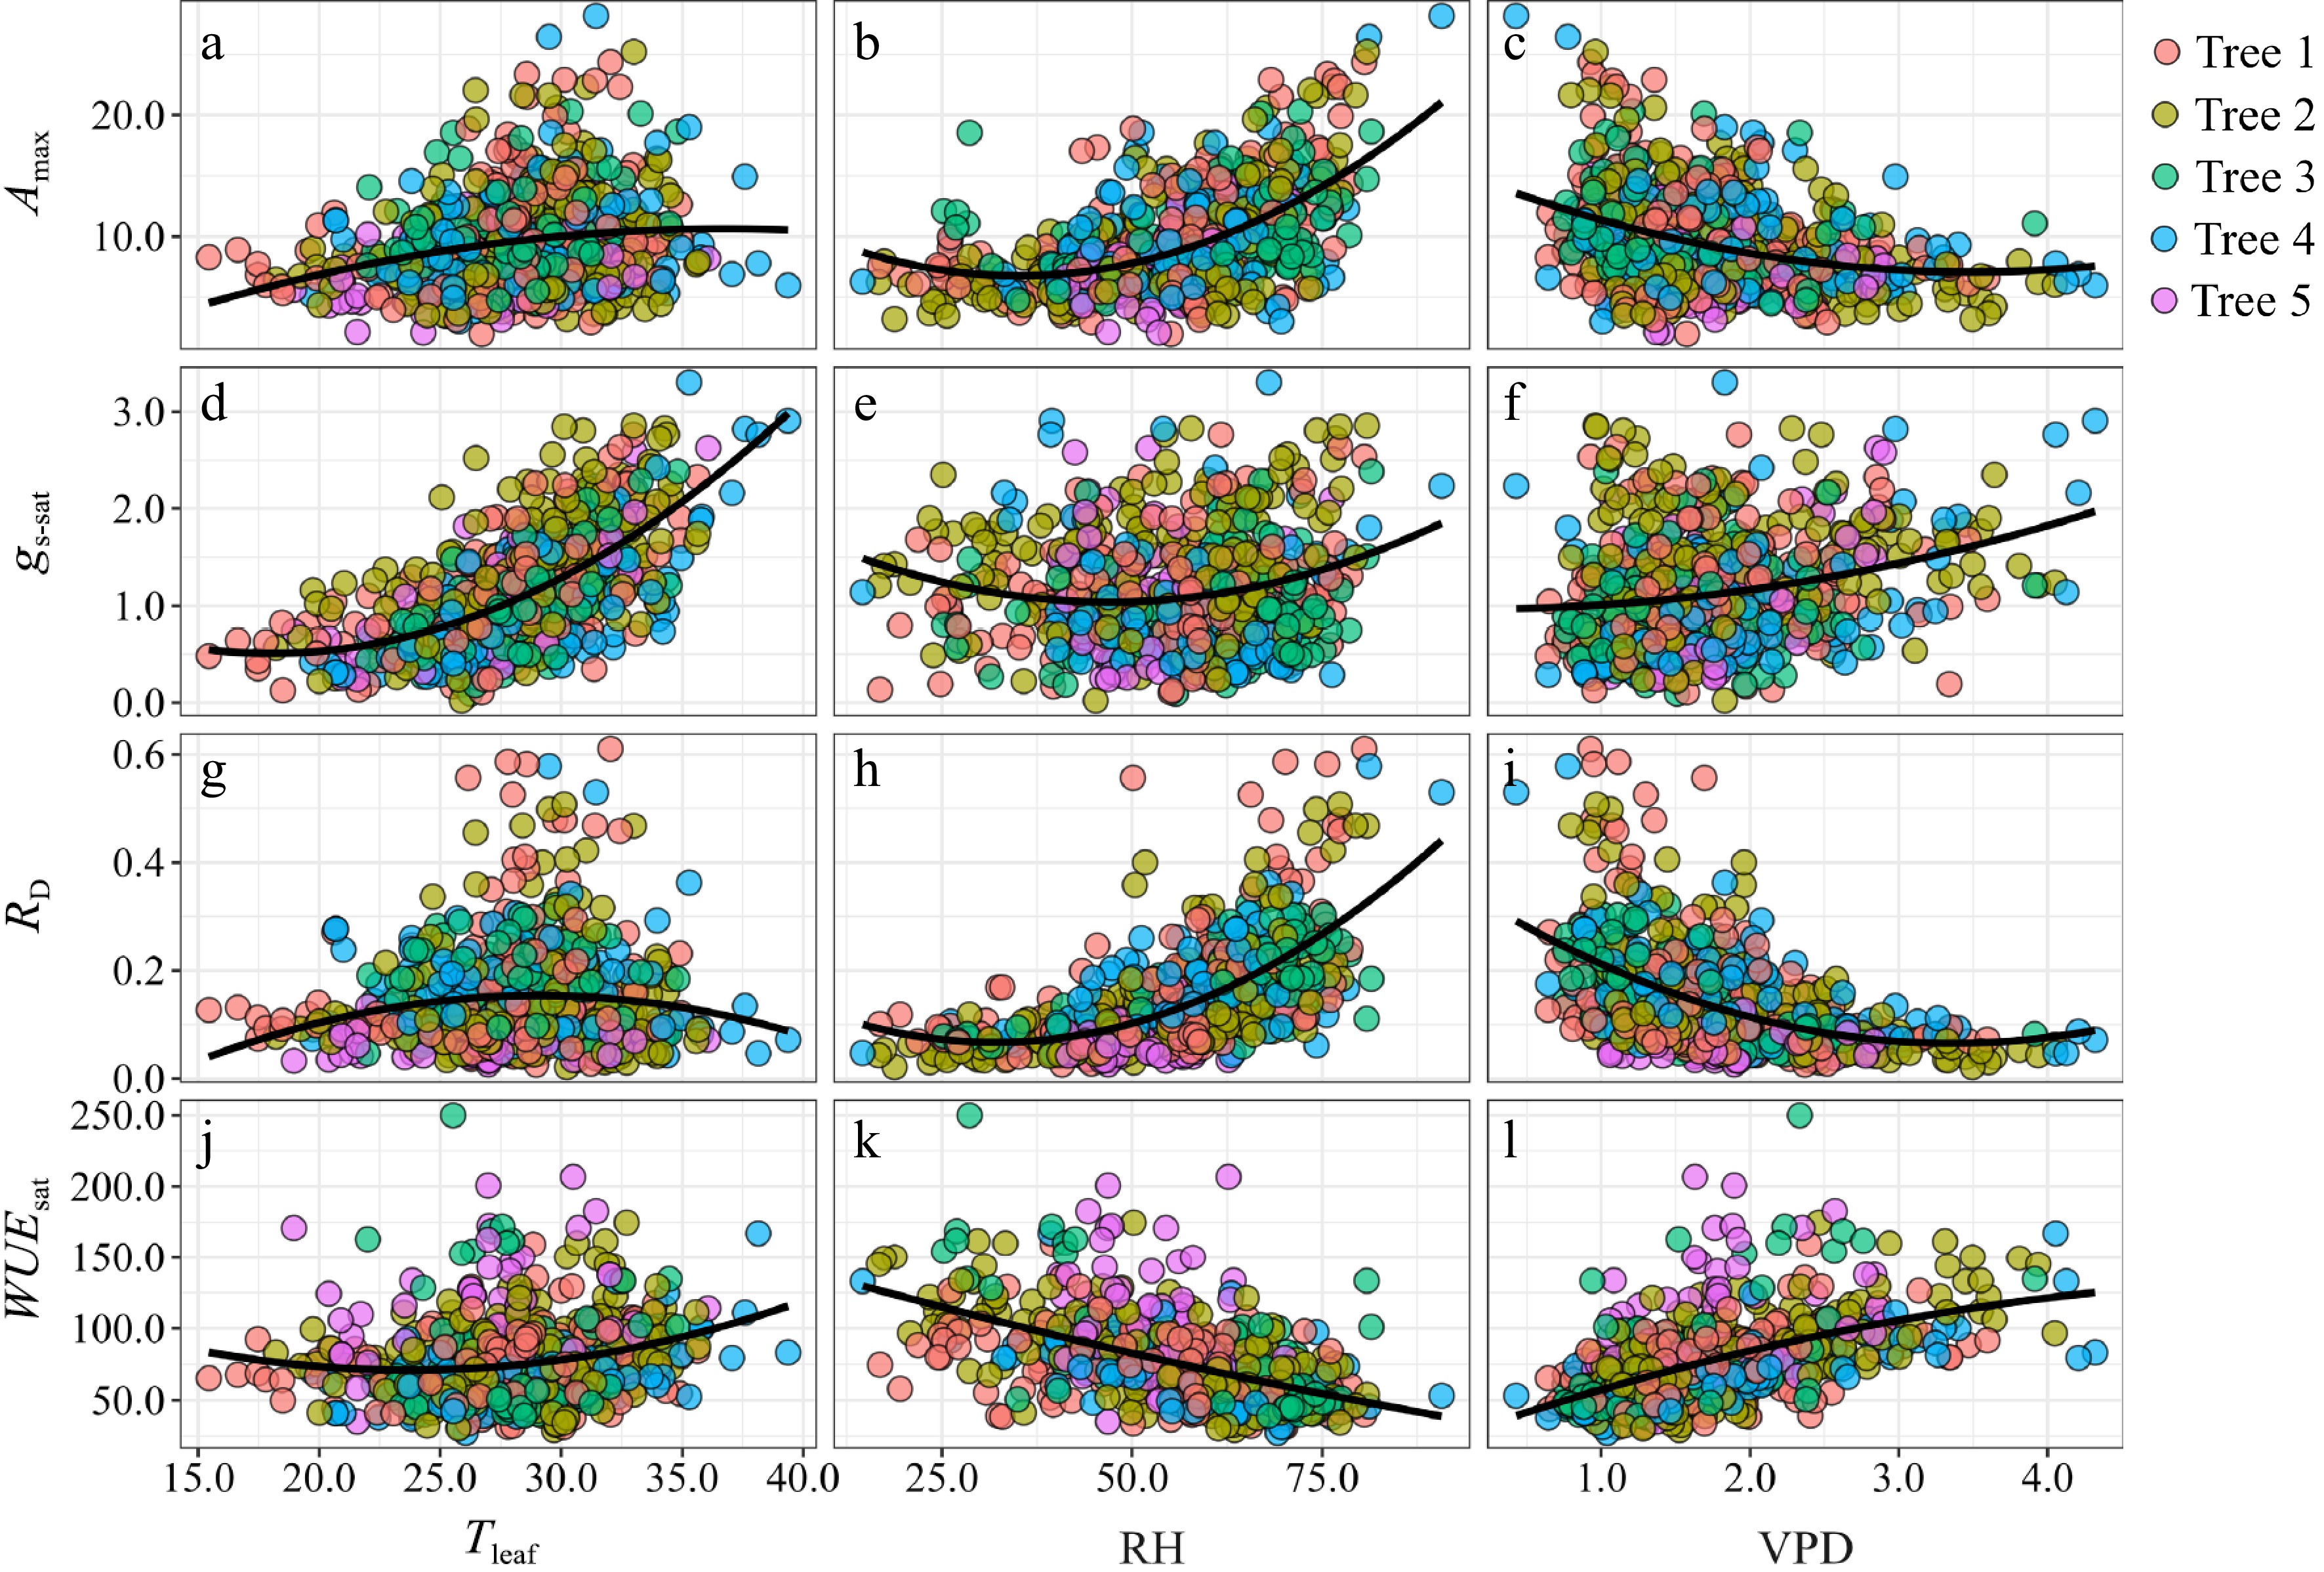
Figure 3.
Relationship between light-saturated net photosynthetic rate (Amax), light saturated stomatal conductance (gs-sat), dark respiration (RD), and light-saturated water use efficiency (WUEsat) and (a), (d), (g), (j) leaf temperature (Tleaf); (b), (e), (h), (k) relative humidity (RH); and (c), (f), (i), (l) vapor pressure deficit (VPD) for five trees.
-
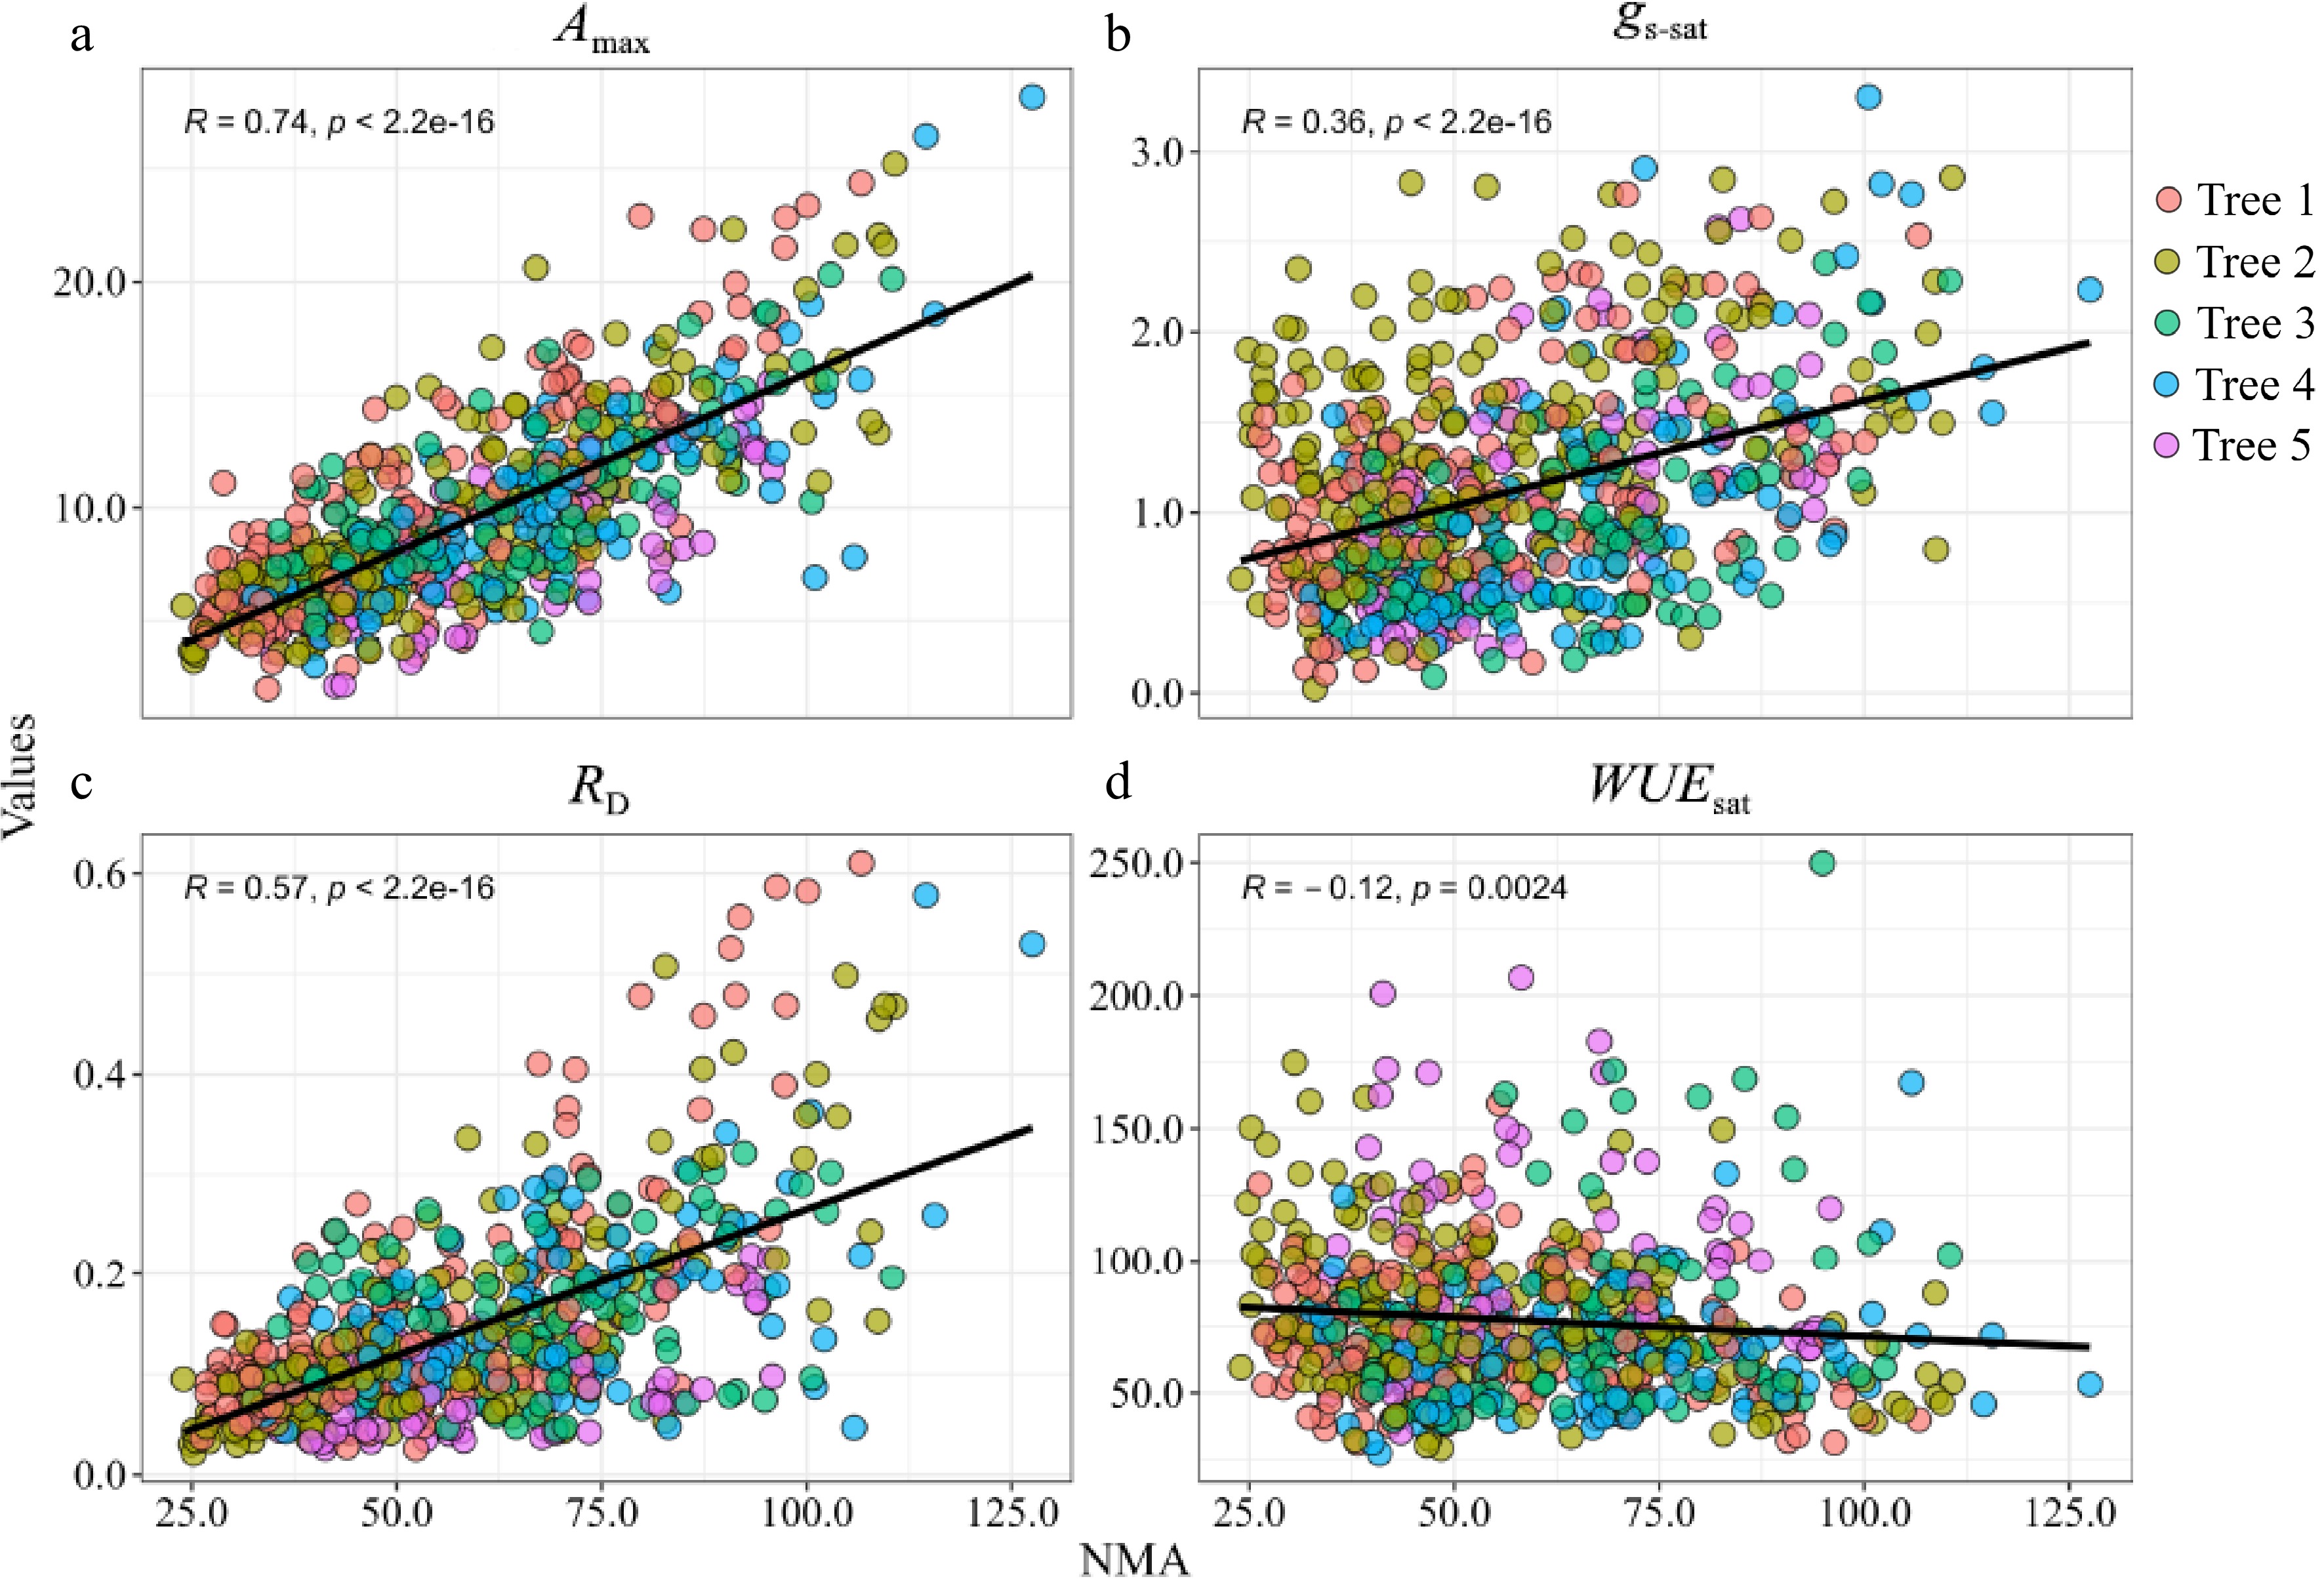
Figure 4.
Relationships between (a) light-saturated net photosynthetic rate (Amax) and needle mass per area (NMA); (b) light-saturated stomatal conductance (gs-sat) and NMA; (c) dark respiration (RD) and NMA; (d) light-saturated water use efficiency (WUEsat) and NMA. R values are the Pearson correlation coefficients. Solid lines represent the fitting result and are based on linear equations.
-
Statistics Net photosynthetic rate Leaf trait Environmental conditions Spatial position An (μmol·m−2·s−1) LMA (g·m−2) Tair (°C) VPD (kPa) PAR (μmol·m−2·s−1) RDINC No. 9303 752 Mean 5.23 58.5 27.9 1.7 757 0.52 Std. 4.47 20.1 3.6 7 723 0.26 Max. 27.49 127.5 39.4 4.3 2200 0.99 Min. −3.90 14.3 15.5 0.5 0 0.08 An, net CO2 assimilation; LMA, leaf mass per area; Tair, air temperature; VPD, vapor pressure deficit; PAR, photosynthetically active radiation; RDINC, relative depth into the crown (RDINC). No., Mean, Std., Max. and Min. are the numbers, mean value, standard deviation, maximum value and minimum value, respectively. Table 1.
Sample tree and data summary. Photosynthetic light response curves (752) were investigated, including 9303 instantaneous environmental and functional factors, from 36 pseudowhorls from five planted Larix olgensis trees.
-
Effects df Amax gs-sat RD WUEsat NMA rlw T *** *** *** *** *** *** * P *** *** *** *** *** *** *** L *** *** *** *** *** *** *** T×P *** *** *** *** *** * *** T×L * *** *** *** *** *** P×L *** *** *** *** *** *** * T×P×L *** ** *** *** P, measurement period; T, tree specific; L, crown location. The different parameters have been identified and described in the text. *, 0.01 < p ≤ 0.05; **, 0.001 < p ≤ 0.01; ***, p ≤ 0.001. Table 2.
Results of the three-way repeated measures ANOVA of photosynthetic and morphological parameters.
-
Factors Location PI PII PIII PIV PV PVI PVII PVIII Amax
(μmol·m−2·s−1)Upper 7.07 ± 0.18a 8.67 ± 0.51a 9.77 ± 0.89a 12.11 ± 1.48a 12.16 ± 0.74a 14.18 ± 1.33a 13.74 ± 1.42a 11.42 ± 0.85a Middle 6.76 ± 0.23a 7.19 ± 0.66b 7.82 ± 0.75b 9.19 ± 0.82b 9.03 ± 0.54b 9.03 ± 1.24b 8.11 ± 0.77b 7.88 ± 0.38b Lower 5.80 ± 0.12b 5.93 ± 1.1c 6.57 ± 0.78c 6.03 ± 0.97c 6.48 ± 1.07c 5.15 ± 1.19c 4.3 ± 1.71c 5.47 ± 0.86c RD
(μmol·m−2·s−1)Upper 1.51 ± 0.12a 1.35 ± 0.23a 1.25 ± 0.12a 1.13 ± 0.28a 1.35 ± 0.25a 1.36 ± 0.19a 1.30 ± 0.15a 1.46 ± 0.10a Middle 1.37 ± 0.11a 1.01 ± 0.25b 0.96 ± 0.17b 0.80 ± 0.18b 0.66 ± 0.11b 0.99 ± 0.23b 0.90 ± 0.14b 1.11 ± 0.14b Lower 1.46 ± 0.03a 0.74 ± 0.27c 0.83 ± 0.20b 0.65 ± 0.13b 0.51 ± 0.10b 0.96 ± 0.44b 0.71 ± 0.20c 1.04 ± 0.18b gs-sat
(mol·m−2·s−1)Upper 0.090 ± 0.01a 0.117 ± 0.03a 0.118 ± 0.01a 0.164 ± 0.02a 0.168 ± 0.02a 0.297 ± 0.06a 0.241 ± 0.05a 0.223 ± 0.02a Middle 0.074 ± 0.01a 0.082 ± 0.02b 0.089 ± 0.01b 0.109 ± 0.01b 0.114 ± 0.01b 0.174 ± 0.04b 0.125 ± 0.02b 0.132 ± 0.02b Lower 0.047 ± 0.01b 0.058 ± 0.02c 0.075 ± 0.02c 0.078 ± 0.01c 0.083 ± 0.02c 0.117 ± 0.03c 0.063 ± 0.02c 0.085 ± 0.03c WUEsat
(mmol·mol−1)Upper 92.1 ± 9.6a 93.3 ± 22.1a 102.1 ± 11.4a 79.7 ± 8.0ab 76.0 ± 9.5a 58.9 ± 8.1b 61.1 ± 6.6b 62.5 ± 3.8a Middle 92.0 ± 7.2a 91.0 ± 22.5a 94.0 ± 7.0a 84.2 ± 6.0a 88.0 ± 9.3a 69.5 ± 8.4a 71.7 ± 12.3a 63.9 ± 5.0a Lower 113.7 ± 7.9a 78.8 ± 14.3a 93.6 ± 15.9a 76 ± 12.8b 88.4 ± 25.6a 58.1 ± 16.4b 57.1 ± 16.6b 63.1 ± 13.4a NMA
(g·m−2)Upper 37.8 ± 1.5a 58.6 ± 4.7a 69.6 ± 5.0a 74.5 ± 5.7a 77.9 ± 6.0a 91.7 ± 6.1a 83.9 ± 6.1a 74.6 ± 6.5a Middle 36.4 ± 2.2a 51.2 ± 4.5b 53.9 ± 4.6b 59.4 ± 5.6b 56.7 ± 5.1b 66.9 ± 5.3b 60.8 ± 5.4b 56.2 ± 5.4b Lower 29.1 ± 1.1a 35.9 ± 5.0c 40.4 ± 5.7c 42.9 ± 5.6c 39.6 ± 5.6c 45.6 ± 5.5c 44.1 ± 5.5c 40.8 ± 5.5c rlw Upper 14.2 ± 0.06a 17.8 ± 0.10a 18.6 ± 0.10a 18.0 ± 0.08a 17.7 ± 0.10a 17.9 ± 0.11a 17.4 ± 0.11a 18.6 ± 0.12a Middle 12.9 ± 0.07b 15.7 ± 0.08b 15.3 ± 0.08b 15.2 ± 0.09b 14.9 ± 0.08b 14.4 ± 0.11b 14.9 ± 0.09b 16.2 ± 0.10b Lower 11.5 ± 0.08c 13.3 ± 0.11c 13.3 ± 0.09c 13.0 ± 0.10c 13.5 ± 0.14c 12.6 ± 0.10c 12.9 ± 0.11c 13.6 ± 0.11c Values are Mean ± SE. Mean values with same superscript do not differ significantly (p < 0.05). Table 3.
Summary of physiological and morphological parameters in upper, middle, and lower crown, respectively during growing seasons.
-
Vertical layer Photosynthetic parameters Amax RD WUEsat gs-sat 1 ** ** ** 2 ** ** ** 3 ** ** ** 4 ** ** ** 5 * 6 * 7 * 8 * 9 * The different parameters have been identified and described in the text. *, 0.01 < p ≤ 0.05; **, 0.001 < p ≤ 0.01. Table 4.
Results of the One-way ANOVA of photosynthetic parameters in each vertical layer.
Figures
(4)
Tables
(4)