-
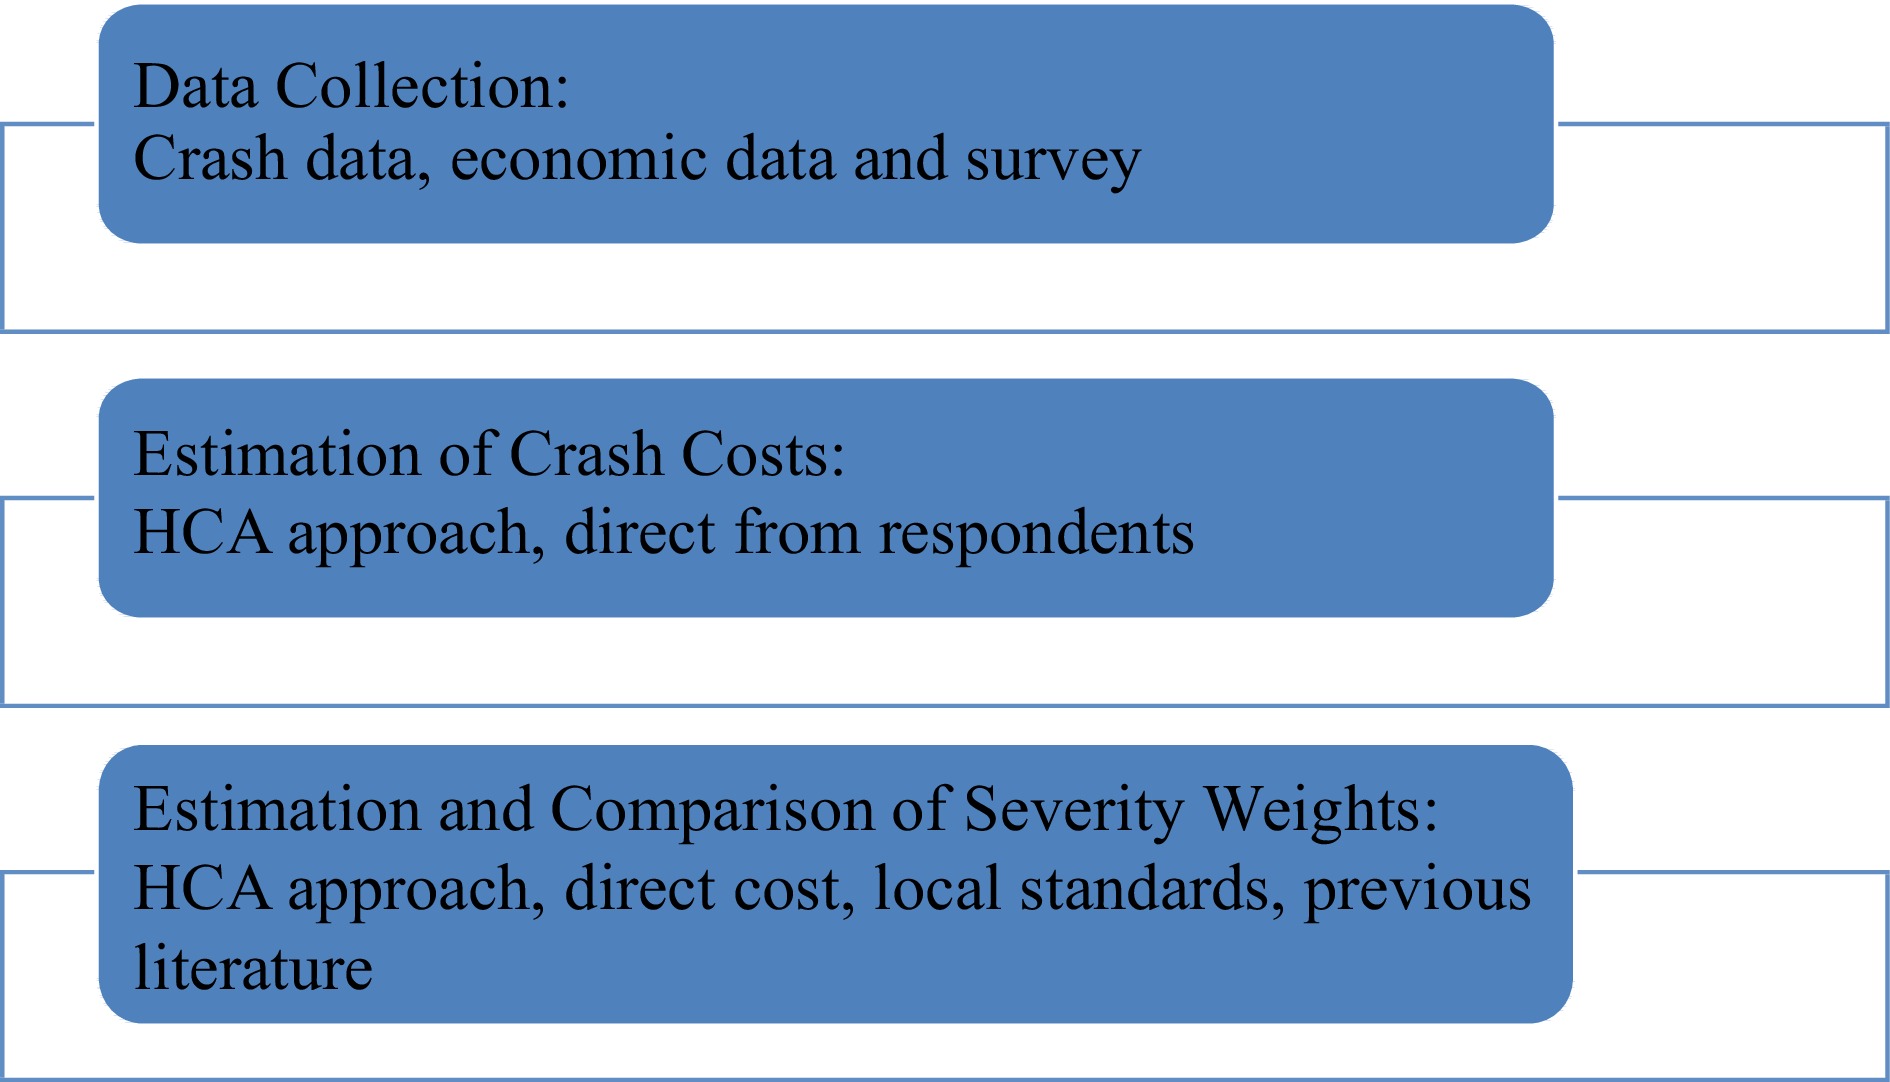
Figure 1.
Research methodology.
-
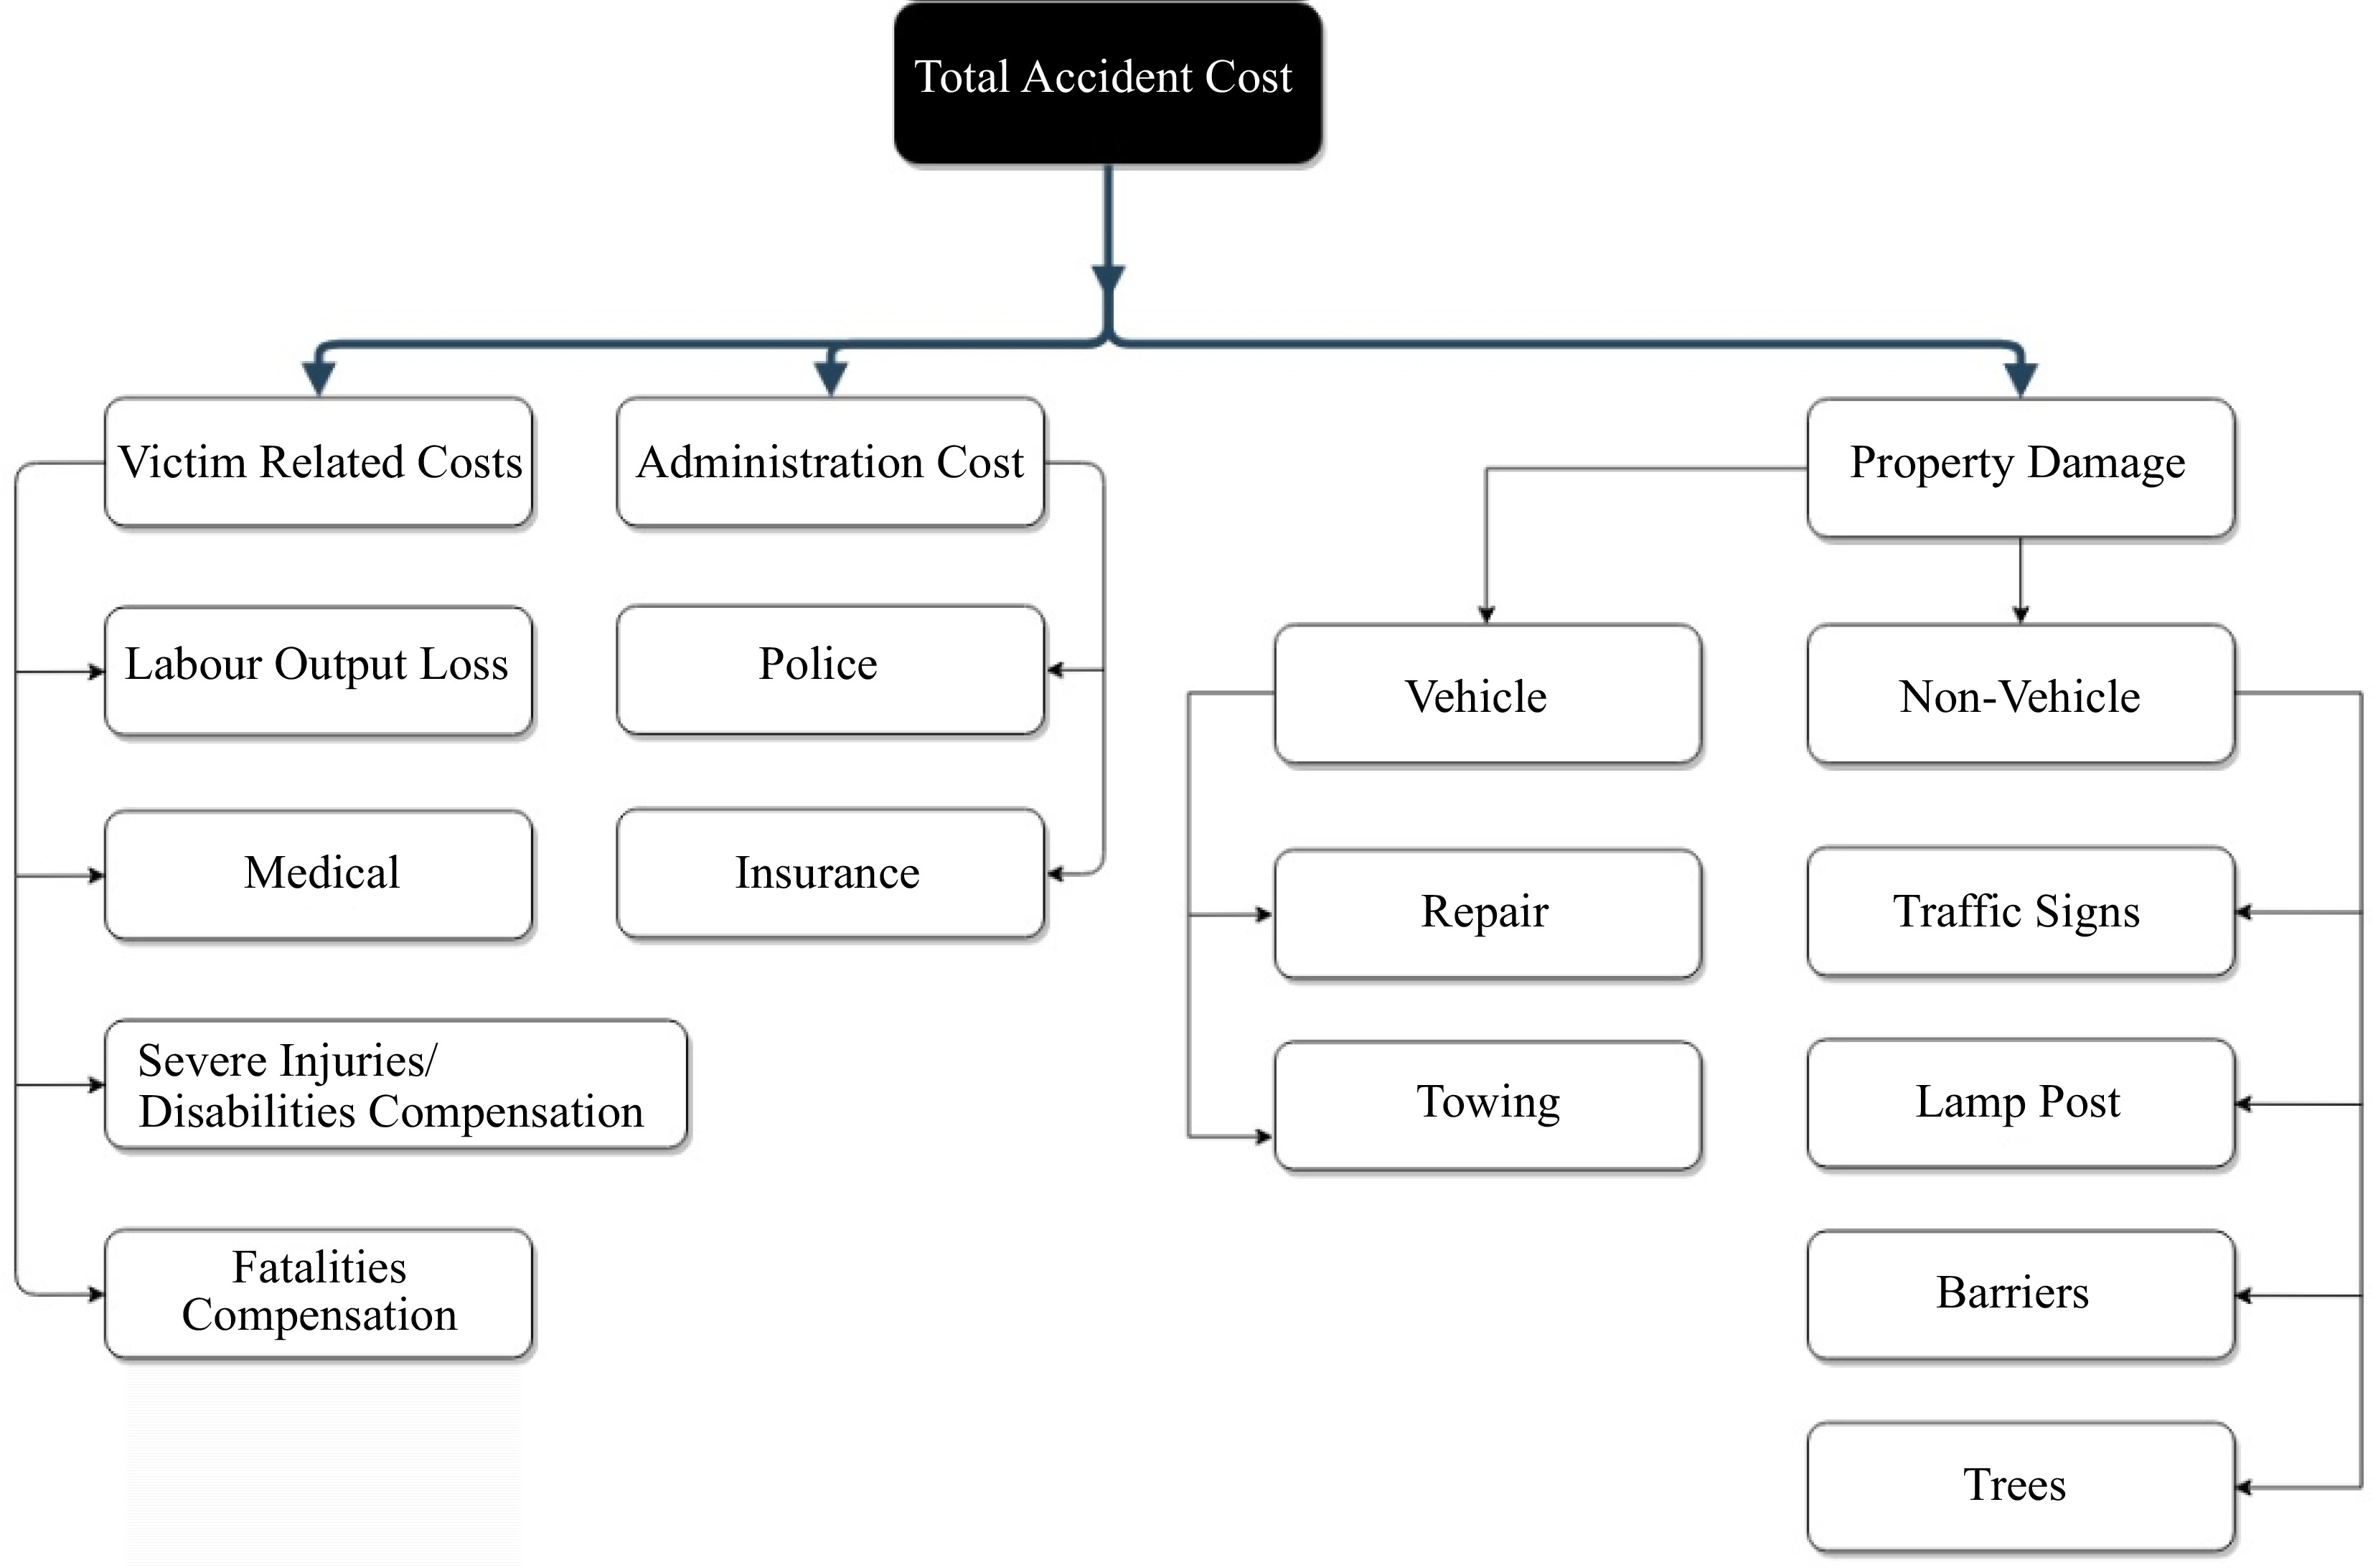
Figure 2.
Total crash cost using the Human Capital Approach.
-
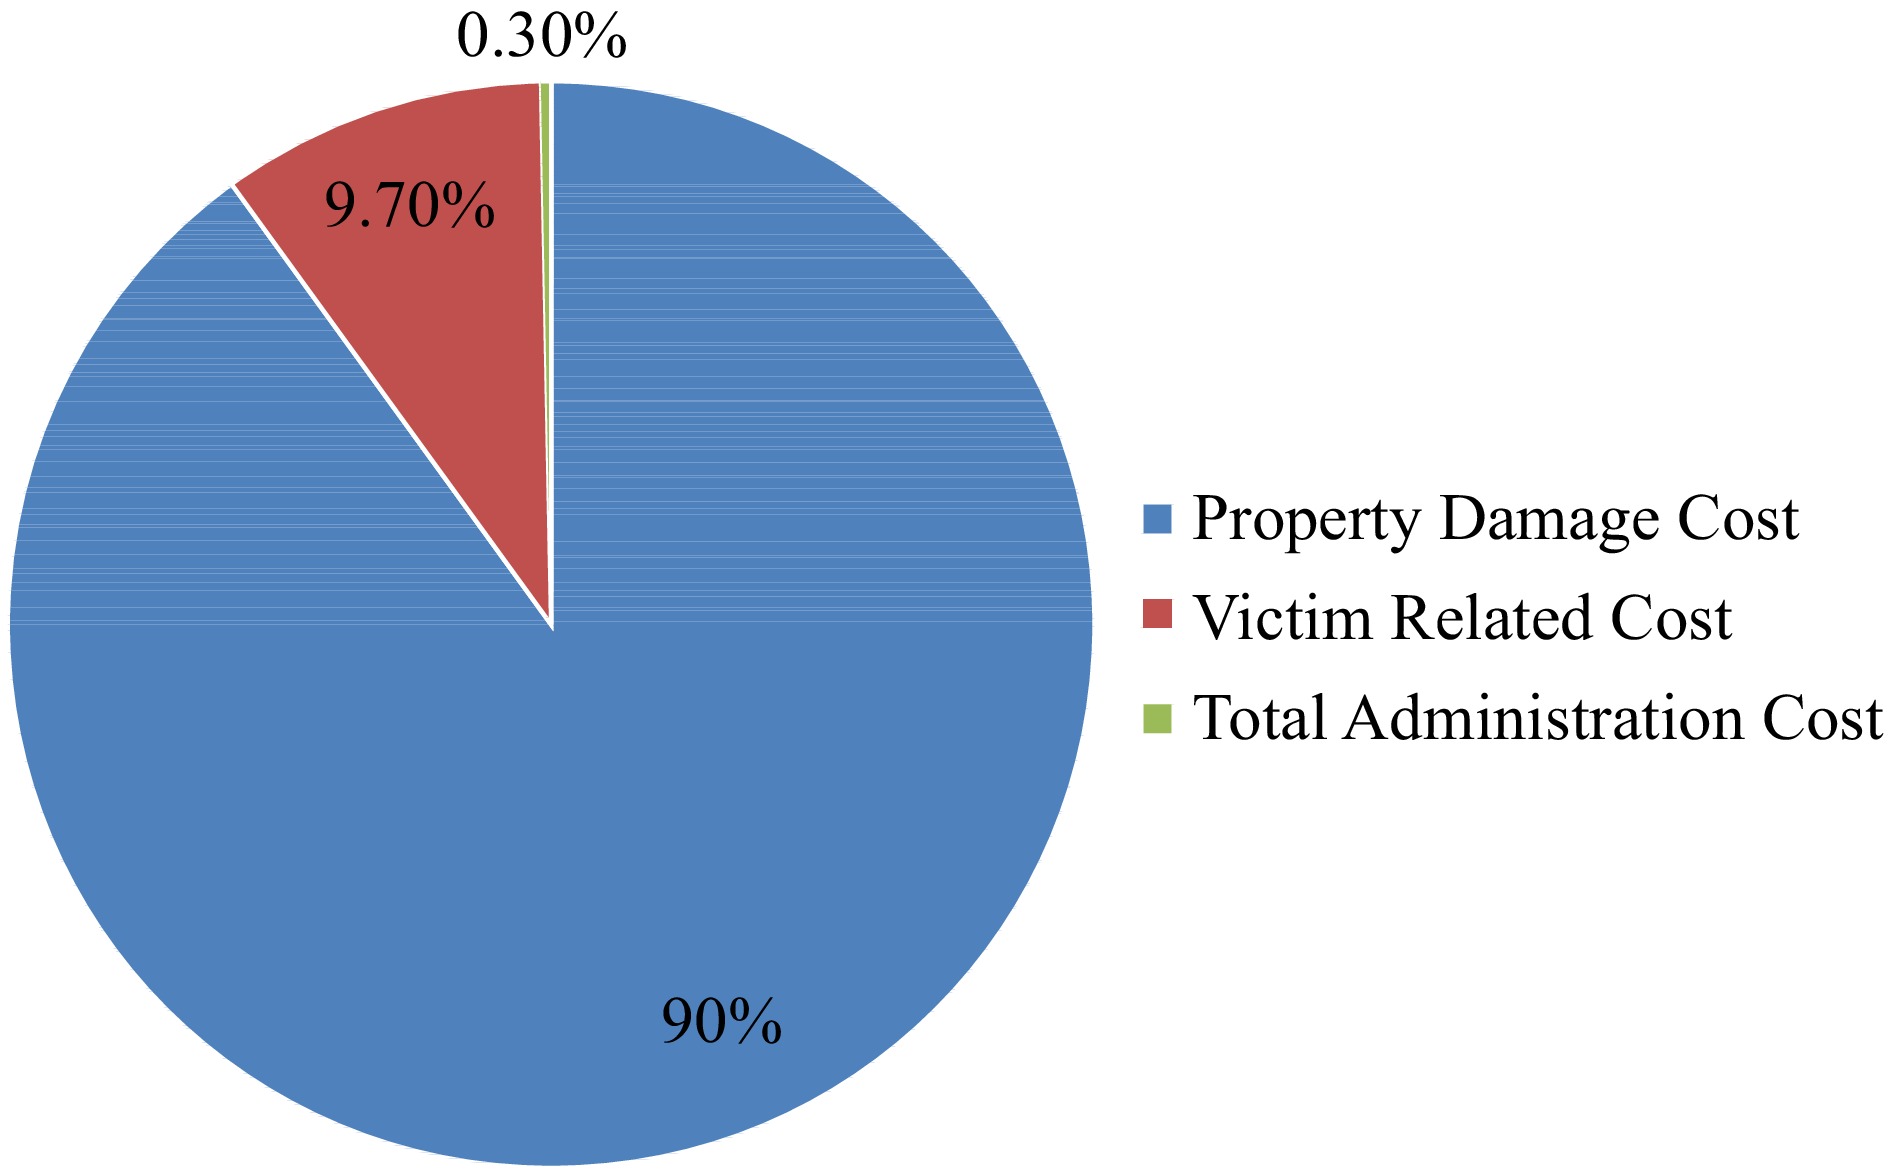
Figure 3.
Distribution of cost components.
-
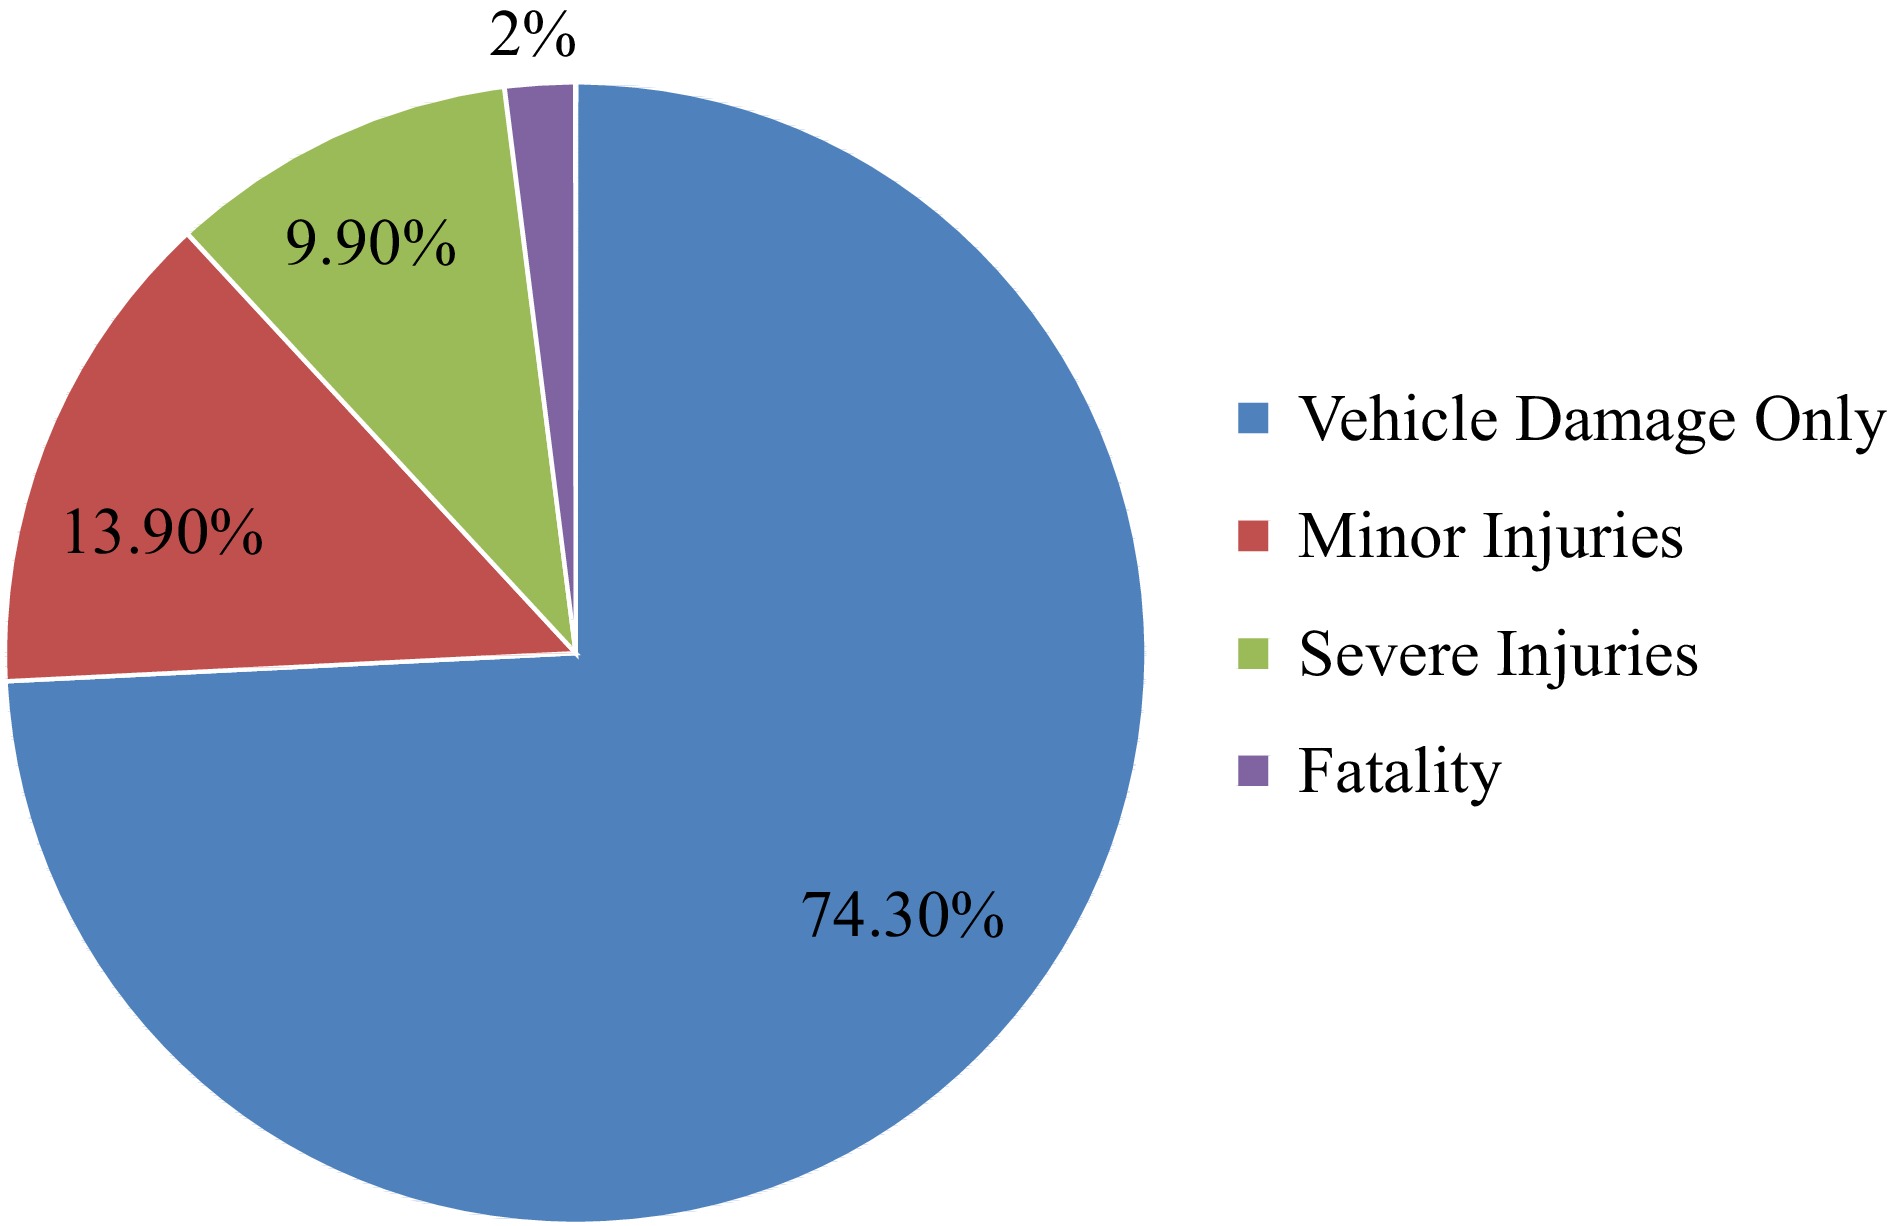
Figure 4.
Crash severity distribution of survey respondents.
-
Item Cost (BHD)
per objectNumber of objects
damaged during
accidents in 2017Total cost
(BHD)Concrete barrier 100.00 96 9,600 Lamppost 35.00 16 560 Traffic signs 100.00 11 1,100 Trees 100.00 10 1,000 Table 1.
Cost of objects damaged in accidents during 2017.
-
Category Cost (BHD) Total victim related cost 4,778,060 Labor output loss 517 Medical cost 114,038 Severe injuries/disabilities cost 2,706,853 Fatalities cost 1,956,652 Total administration cost 153,382 Police administration cost 38,282 Insurance administration cost 115,100 Total property damage 44,267,060 Vehicle damage only 44,254,800 Non-vehicle costs 12,260 Total crash cost 49,198,502 Table 2.
Total cost of road traffic crashes in 2017.
-
Male Female Total Bahraini 48% 16% 63% Non-Bahraini 28% 9% 37% Total gender 75% 25% 100% Table 3.
Distribution of gender and nationality.
-
Severity De Leon Shehab HCA Direct cost Car damage and minor injury 1.00 1.00 1.00 1.00 Severe injury 1.40 3.00 14.78 6.97 Fatality 1.55 12.00 94.07 35.63 Table 4.
Comparison of weights of different crash severity.
Figures
(4)
Tables
(4)