-
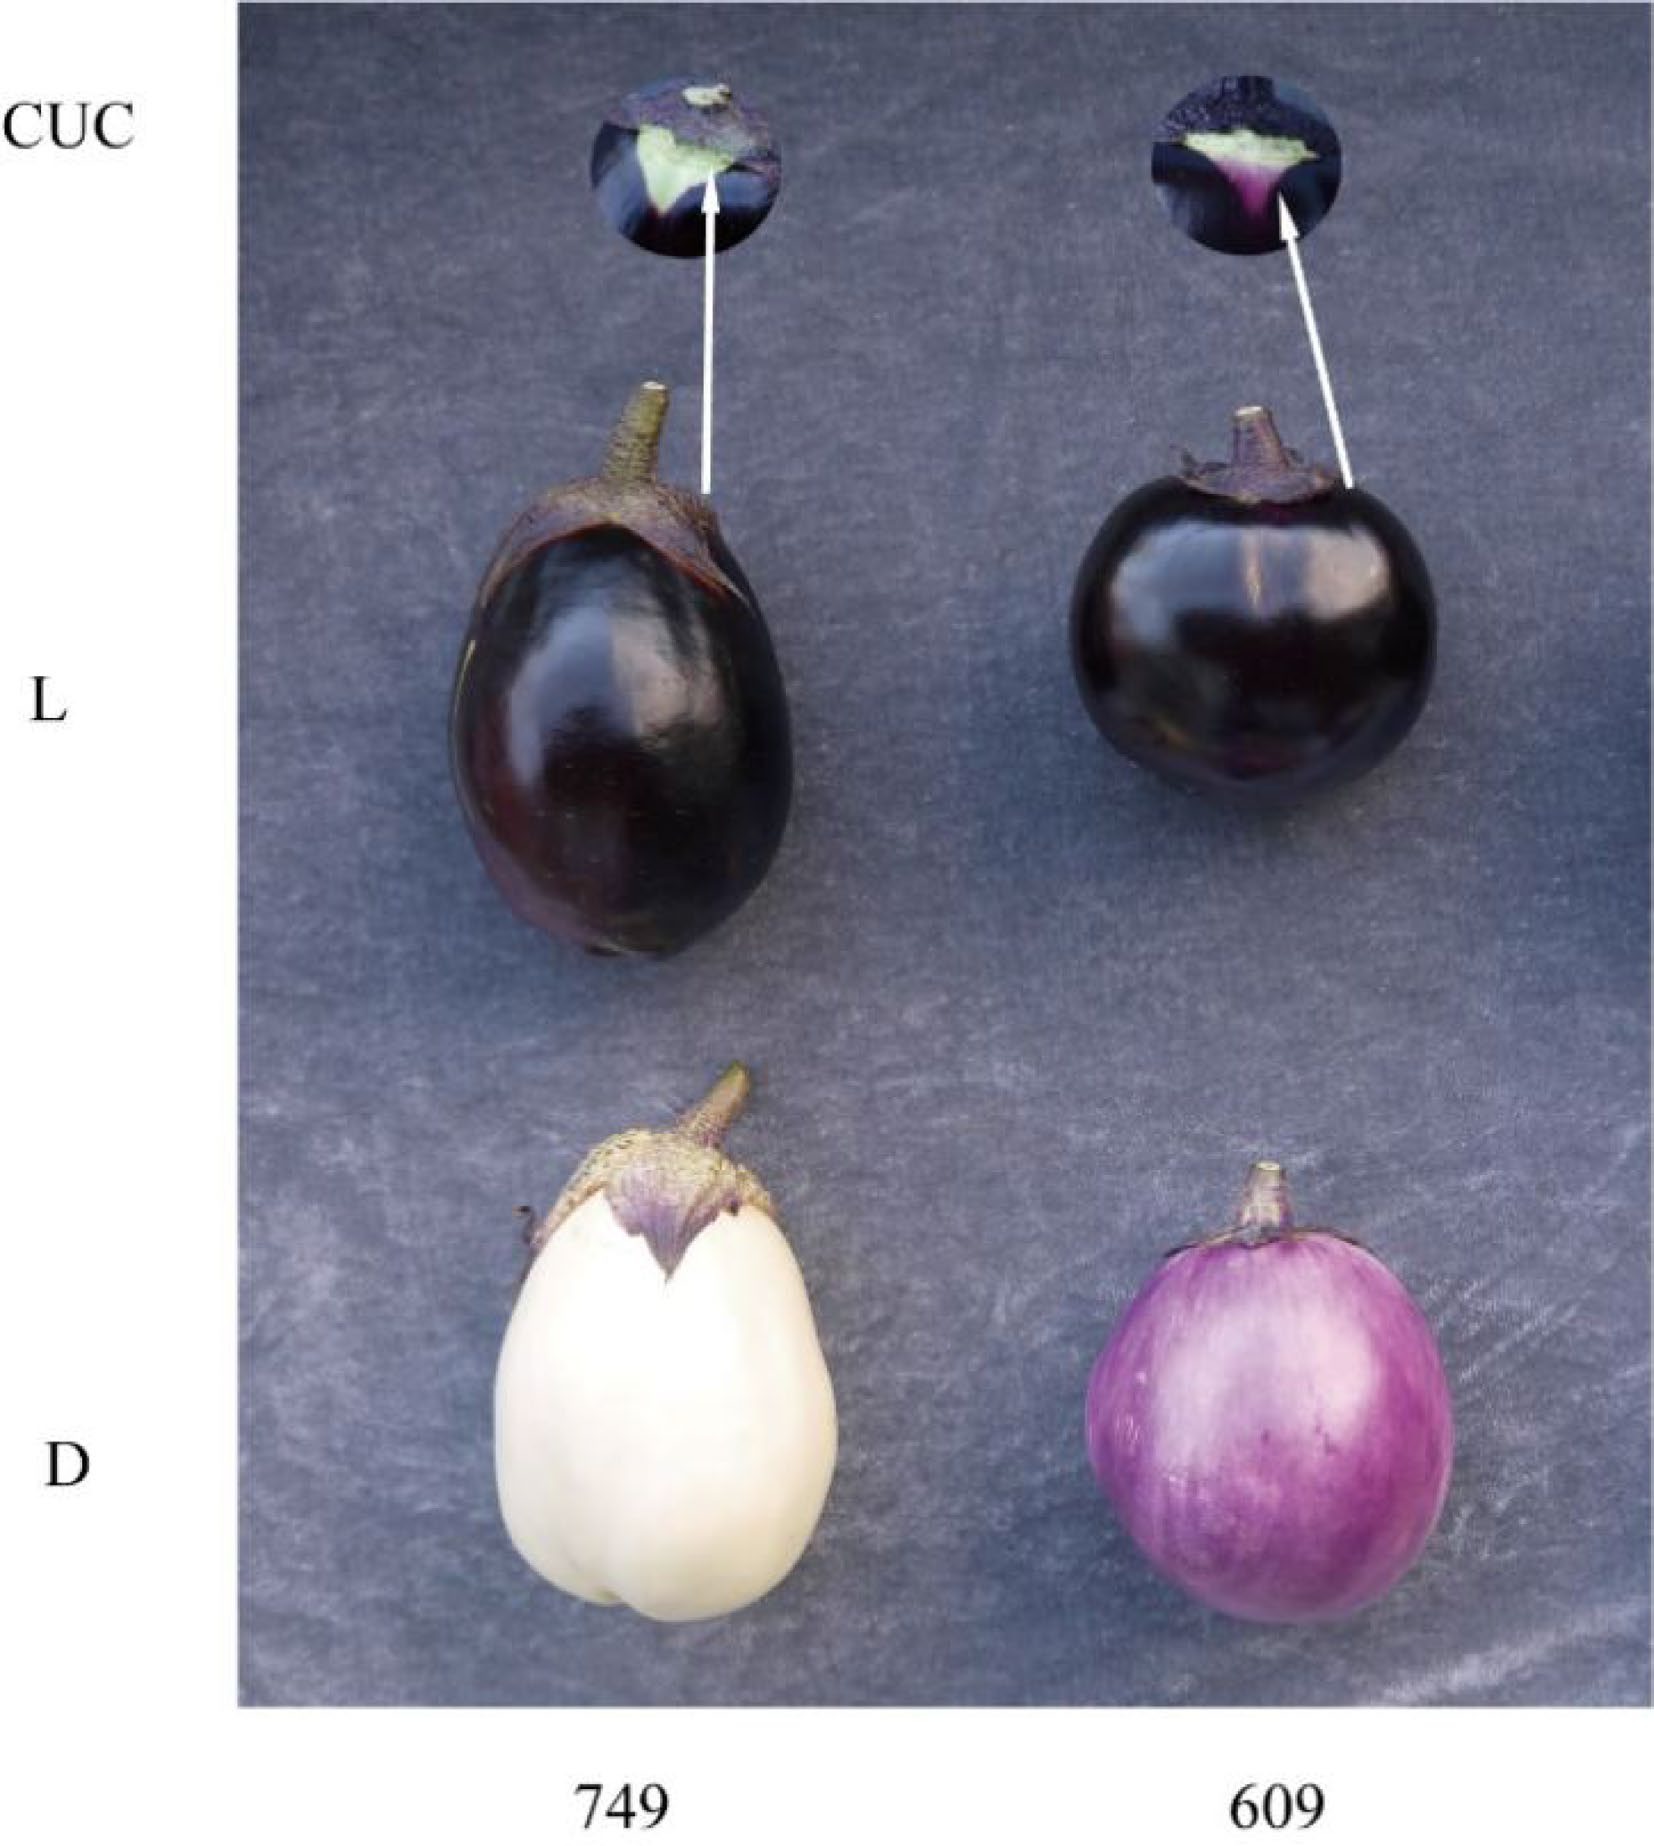
Figure 1.
Fruits of '609' and '749' under (L) natural and (D) bagging conditions. CUC indicates the color under calyx. Eggplant fruits were bagged on the 5th day after flowering, and the picture was taken on the 14th day after bagging, with the fruits growing in natural conditions as control.
-
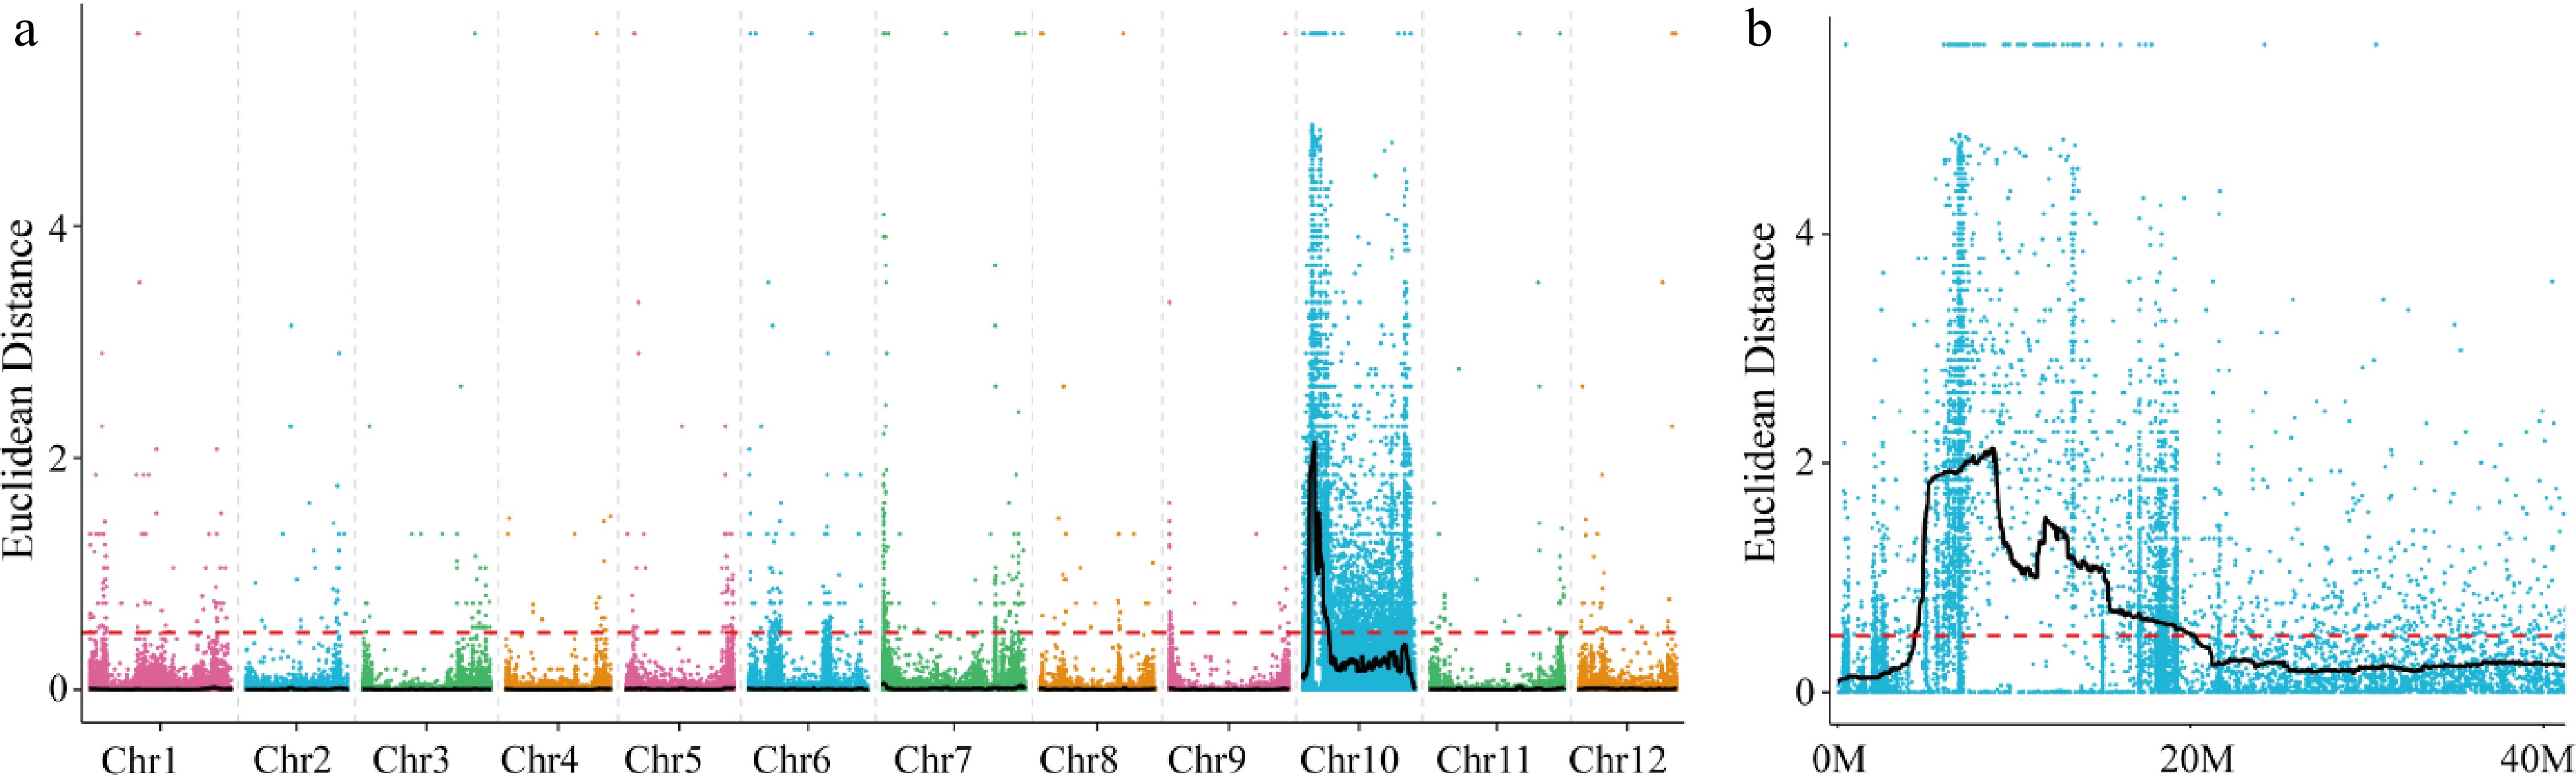
Figure 2.
Distribution of ED-based linkage value on (a) all chromosomes and (b) on Chromosome 10. Each colored dot represents an ED-based linkage value of an SNP site. Black lines represents ED value after fitting. Red dashed lines represents linkage threshold.
-
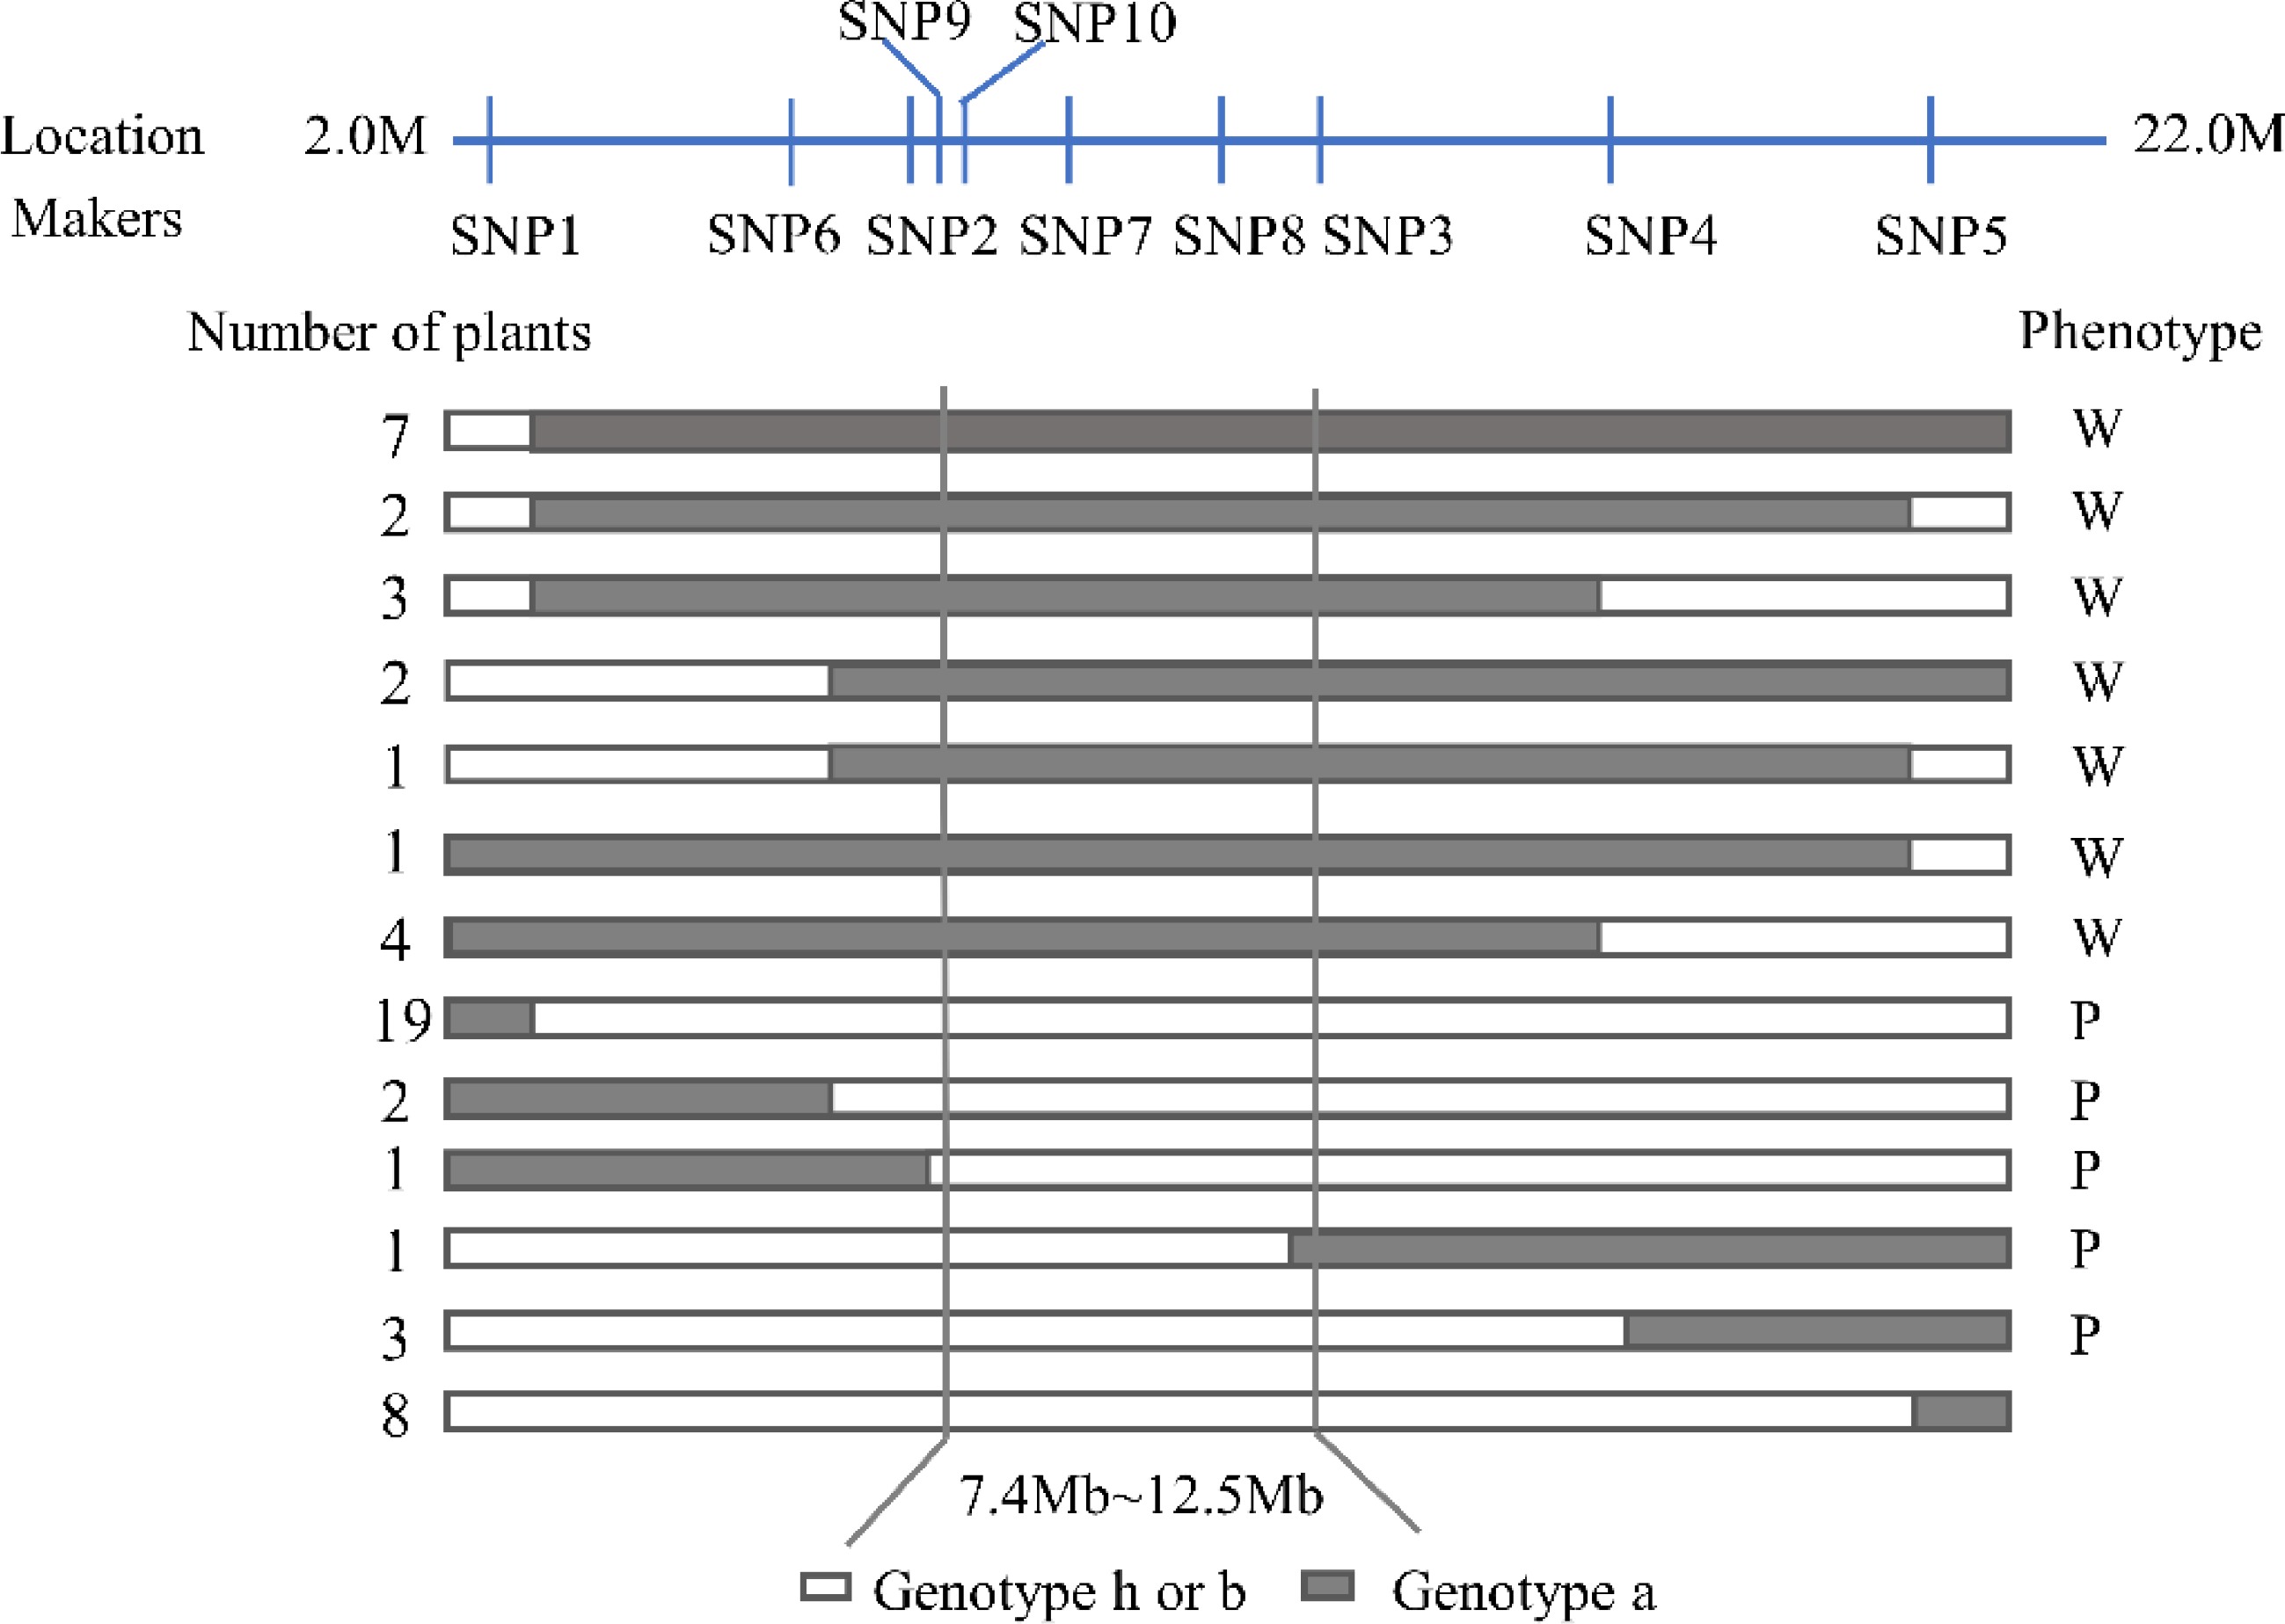
Figure 3.
Genotype and phenotype analysis of recombinant plants in the F2 population derived from a cross between '609' and '749'. (a) Genotype of the photosensitive parent '749'. (b) Genotype of the less-photosensitive parent '609'. (h) Heterozygote of the '749' and '609'. W, White fruit peel after bagging; P, Purple fruit peel after bagging.
-
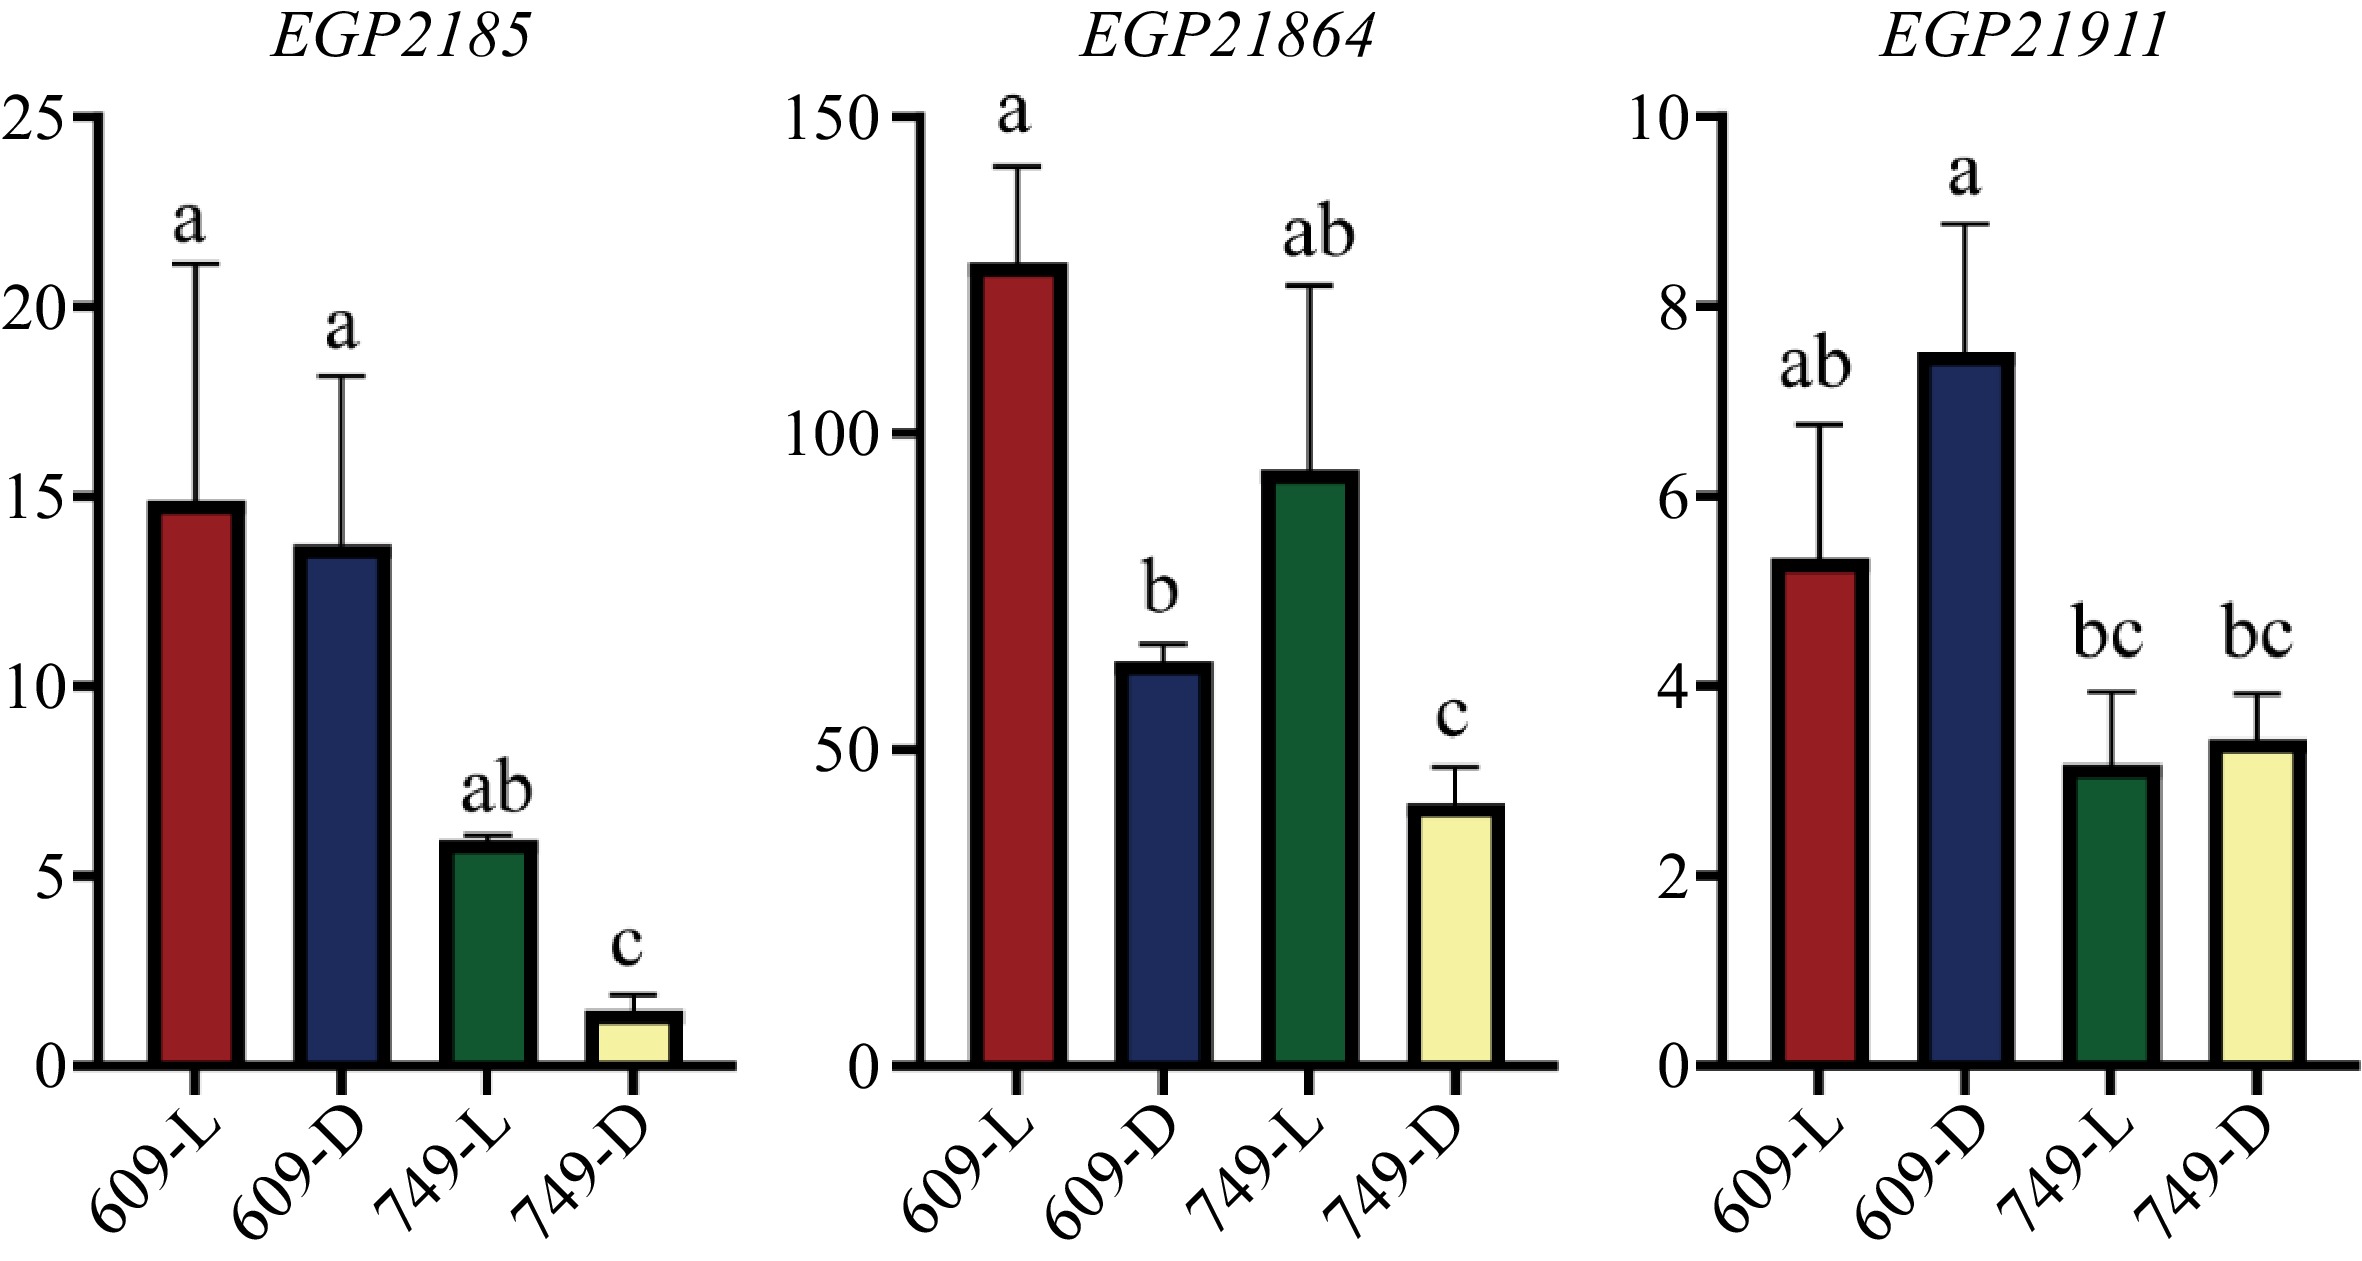
Figure 4.
The transcript level of EGP21875, EGP21864 and EGP21911 in the fruit peel of '609' and '749'. The y axis indicated the relative expression levels of each gene. L, Under natural conditions; D, Under bagging conditions. The relative expression was determined by 2−ΔCᴛ method. The date are means from three biological replicates with three technical replicates. Error bars indicate SEs. Letters above each column represent significant differences based on one-way analysis of variance (ANOVA) followed by Tukey's test (p < 0.05).
-
Generation Numbers of plants Number of plants with light purple fruit peel after bagging Number of plants with white fruit peel after bagging Expected ratio χ2 609 10 10 0 749 10 0 10 (609 × 749) F1 15 15 0 (609 × 749) F2 178 139 39 3:1 0.91 Note: χ2 0.05 = 3.84, df = 1. Table 1.
Genetic analysis of fruit peel pigmentation after bagging in F2 population.
-
Category The number of SNPs The number of Indels Intergenic 222 56 Upstream 23 5 3'UTR 0 1 Non-synonymous 6 0 Synonymous 1 0 Intronic 9 1 Downstream 19 11 Table 2.
Classifications of SNPs and Indels in the candidate region.
-
Gene ID SNP loci Base substitution type Annotation EGP21857 7447780 C- > T Uncharacterized protein LOC102595296 EGP21873 7722116 C- > G 12-oxophytodienoate reductase 1 EGP21911 9870254 C- > T Undefined EGP21972 11985911 C- > T Hypothetical protein BC332_00197 EGP21983 12225282 G- > A Putative GDSL esterase/lipase-like EGP22005 12532757 G- > A MYB domain protein 113 Table 3.
Nonsynonymous SNPs and their related genes in the candidate region.
-
Gene ID SNP category Indel category Annotation EGP21874 Intergenic region in upstream, Intergenic region in downstream Intergenic region in downstream MYB domain protein 113 EGP21875 Intergenic region in upstream, Intergenic region in downstream − MYB domain protein 113 EGP22005 Upstream, Non-synonymous − MYB domain protein 16 EGP21863 Upstream Intergenic region in upstream Auxin response factor 16 EGP21864 Intron − Phototropic-responsive NPH3 family protein EGP21891 Intron, Downstream, Intergenic region in downstream Intergenic region in downstream Phytochrome kinase substrate 2 EGP21908 Intergenic region in downstream Intergenic region in downstream Phytochrome kinase substrate 1 Table 4.
Candidate genes involved in biosynthesis of anthocyanin and light signal transduction.
-
Gene ID SNP loci Substitution type SNP category Distance Annotation EGP21875 7808145
7770881C- > A
T- > CIntergenic region in upstream, Intergenic region in downstream 22,893 bp
13,006 bpMYB domain protein 113 EGP21864 7625998 C- > T Intron − Phototropic-responsive NPH3 family protein EGP21911 9870254 C- > T Non-synonymous − − Table 5.
Candidate genes involved in less-photosensitive anthocyanin biosynthesis in the peel of '609'.
Figures
(4)
Tables
(5)