-
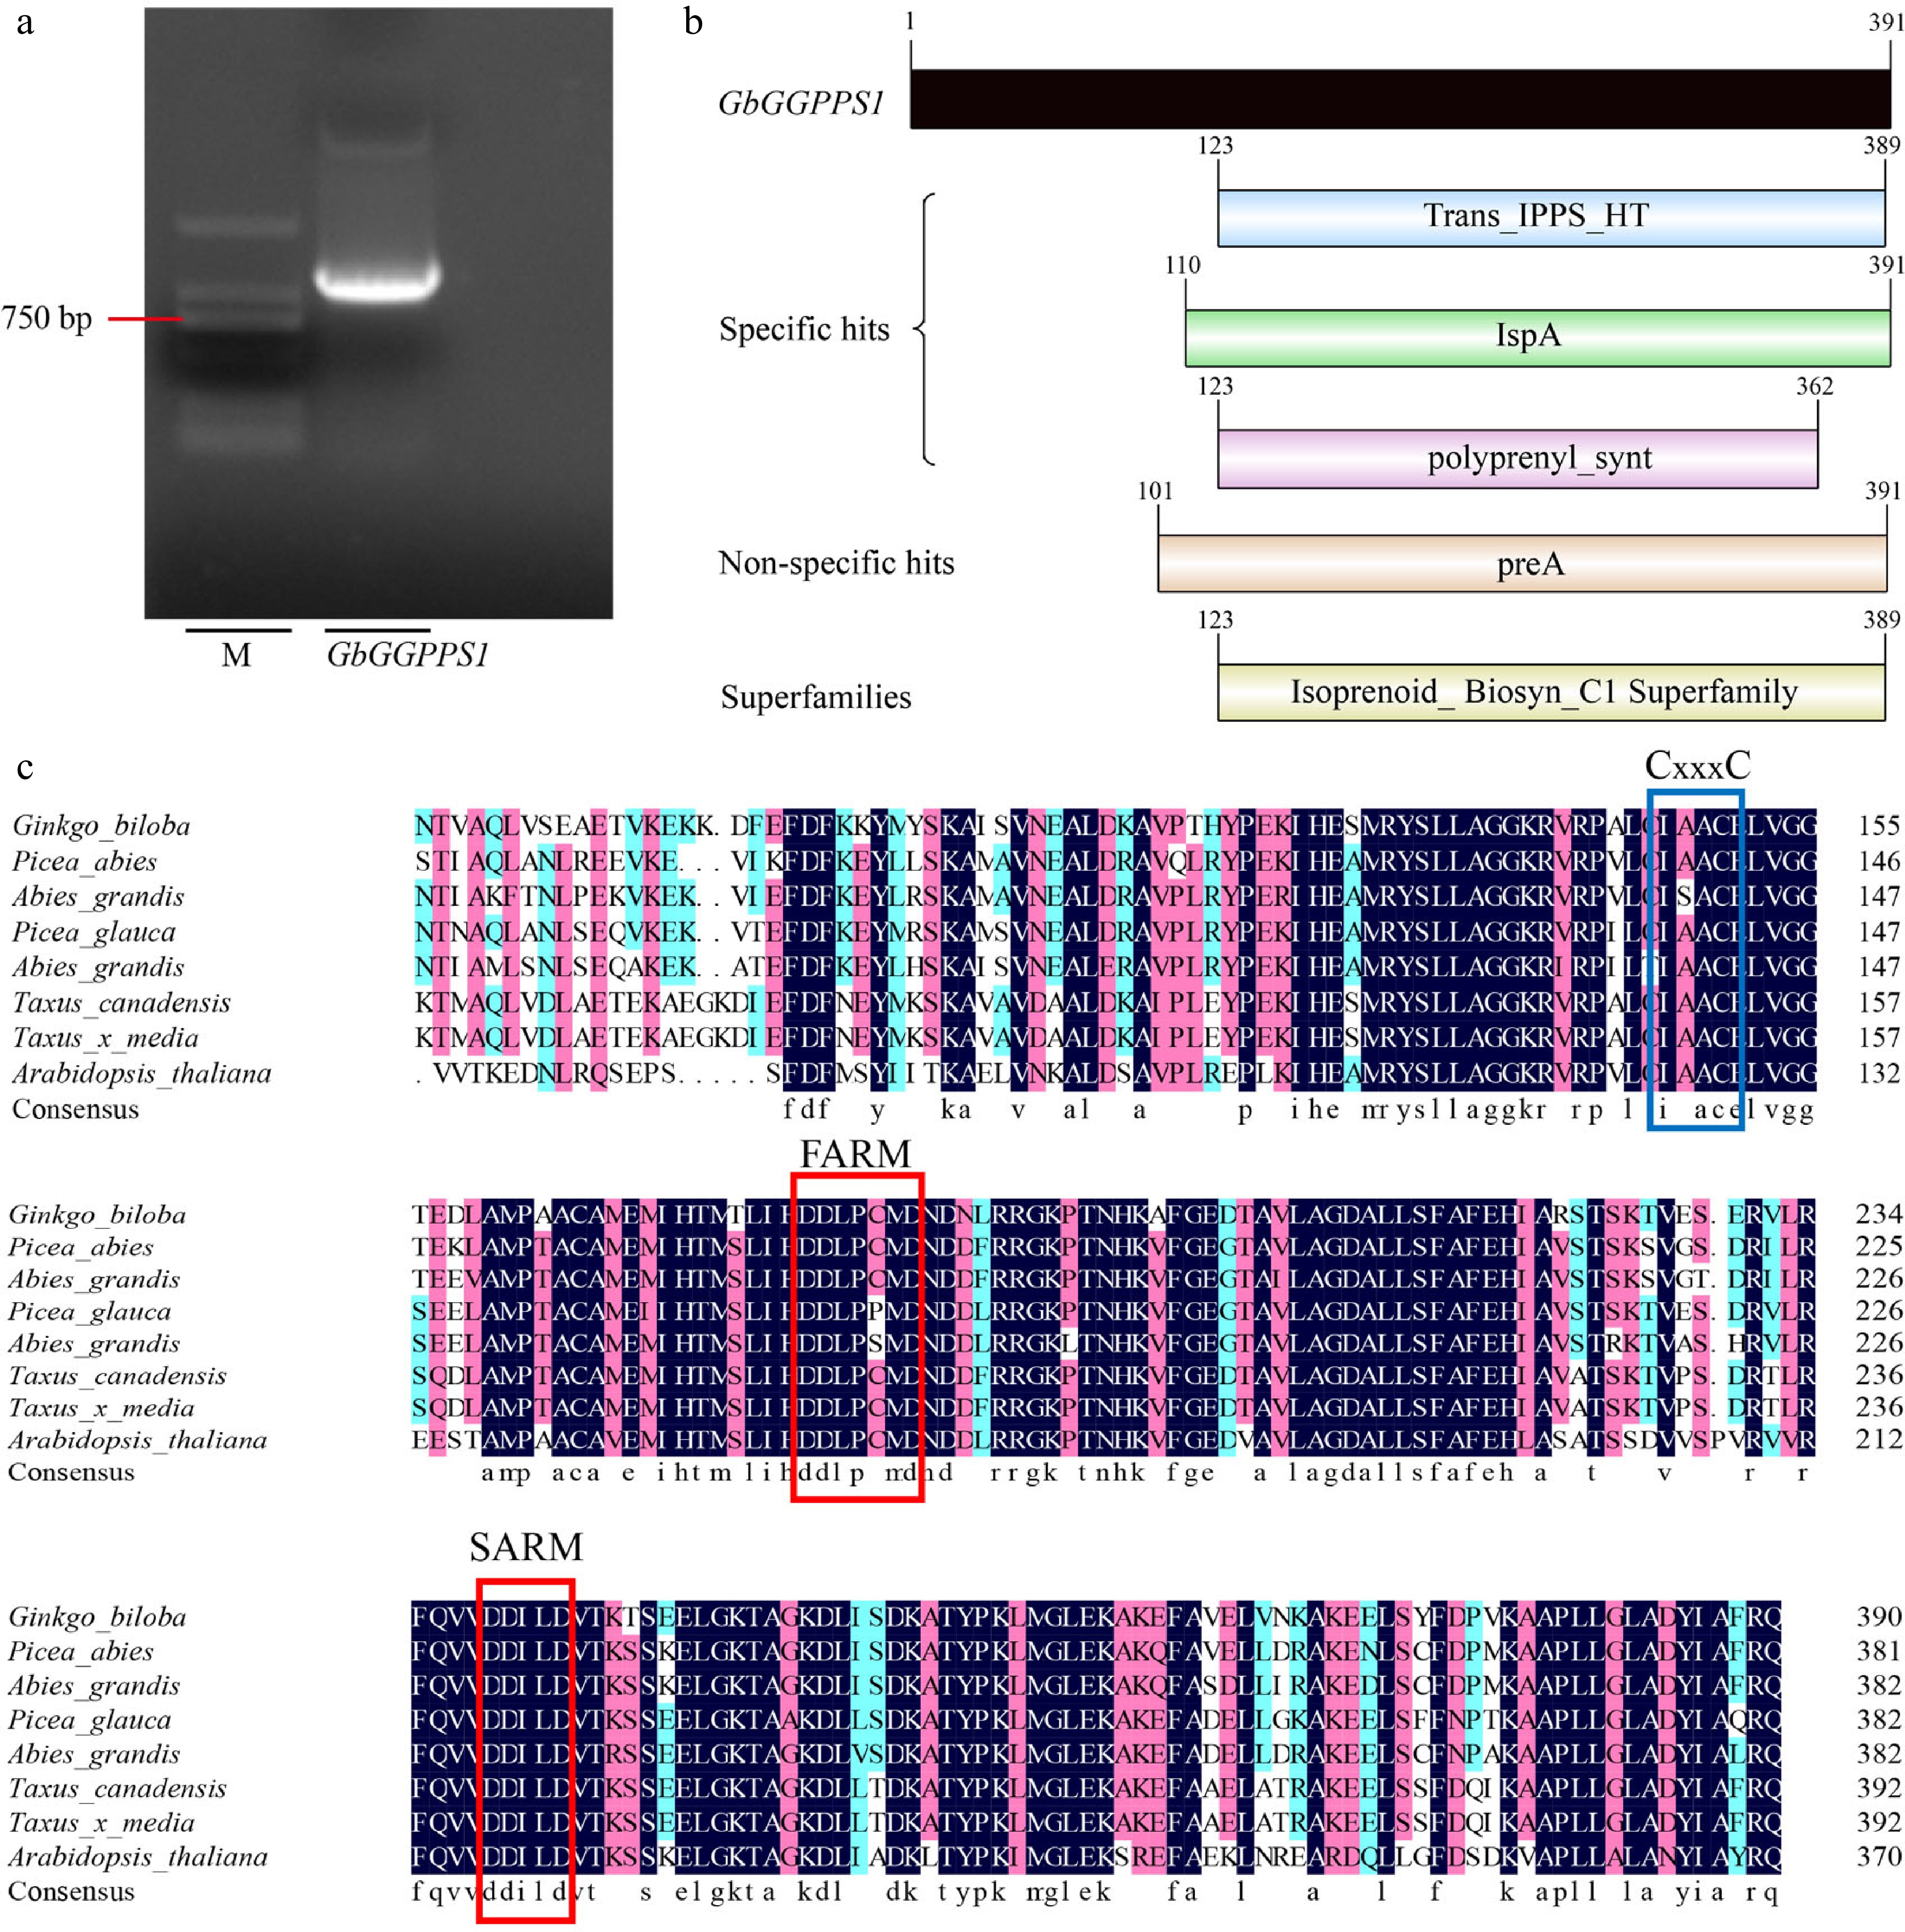
Figure 1.
Sequence analysis of GbGGPPS1. (a) The CDS sequence of GbGGPPS1 cloning. (b) The domain of GbGGPPS1 protein. (c) Homology analysis of GbGGPPS protein in different plants. FARM and SARM motifs are indicated by red boxes. CxxxC motifs are indicated by blue boxes.
-
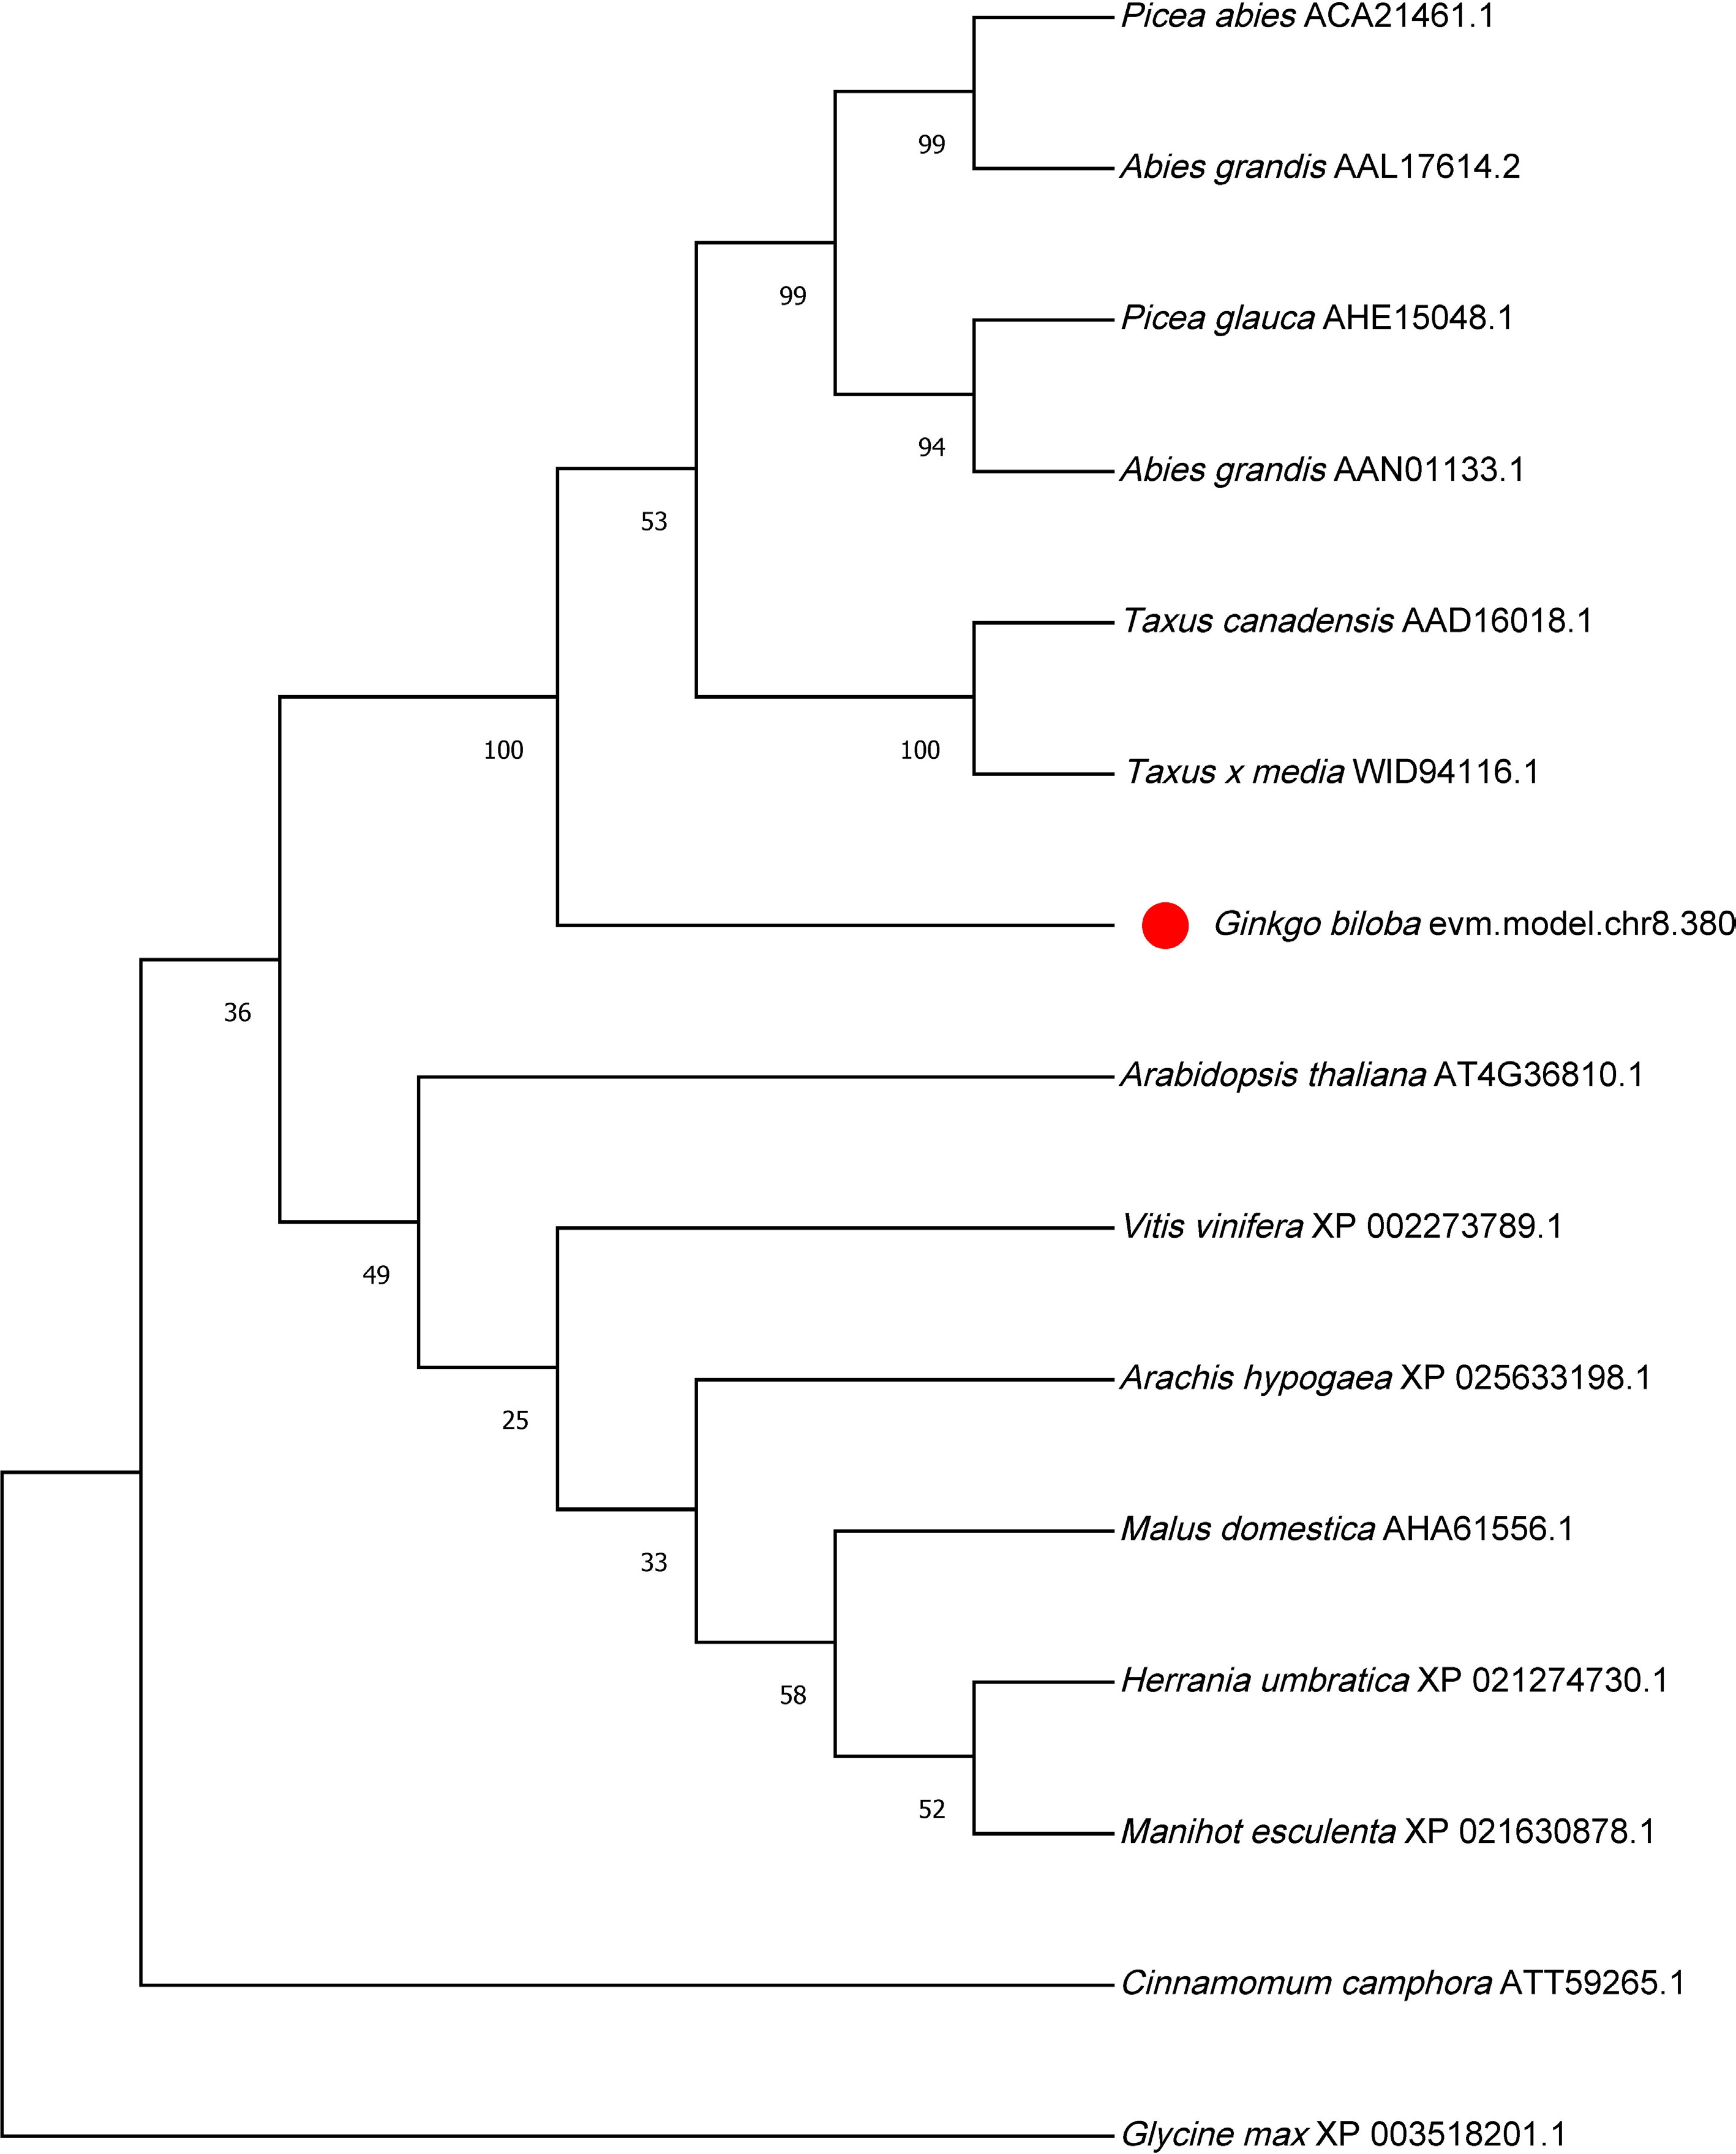
Figure 2.
Phylogenetic tree analysis GGPPS protein in different plants.
-
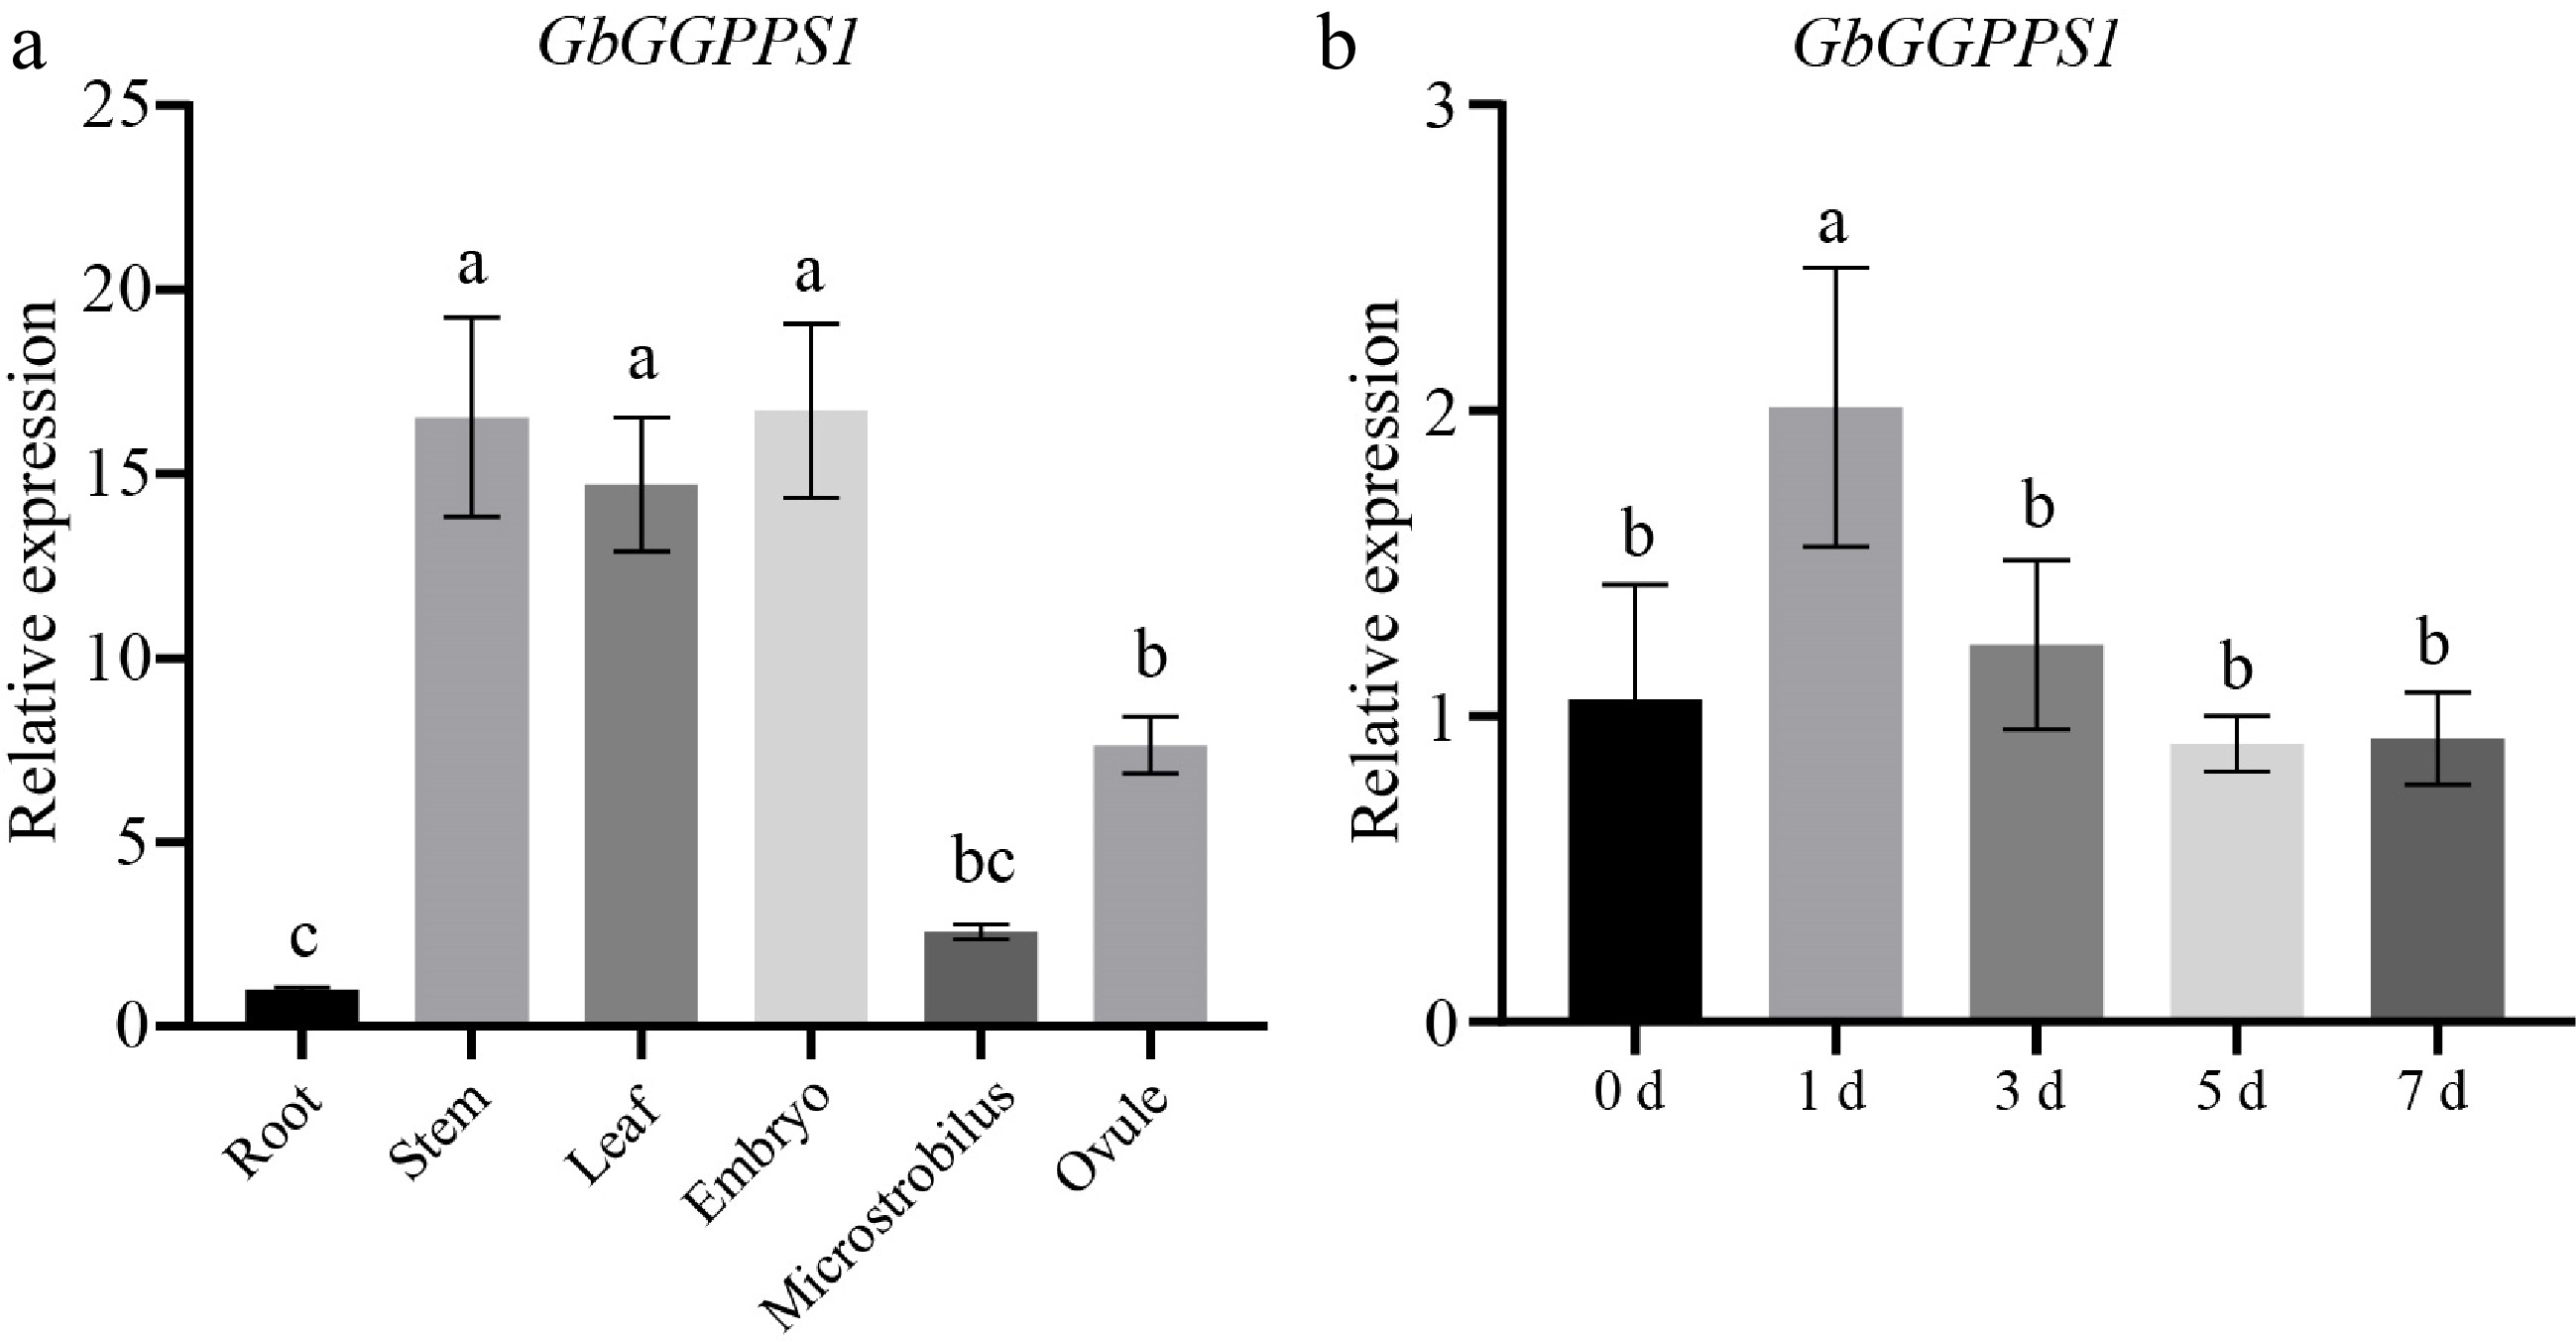
Figure 3.
Expression of the GbGGPPS1 gene in (a) different tissues and (b) salt stress. Data are means (± SD) of the three biological replicates.
-
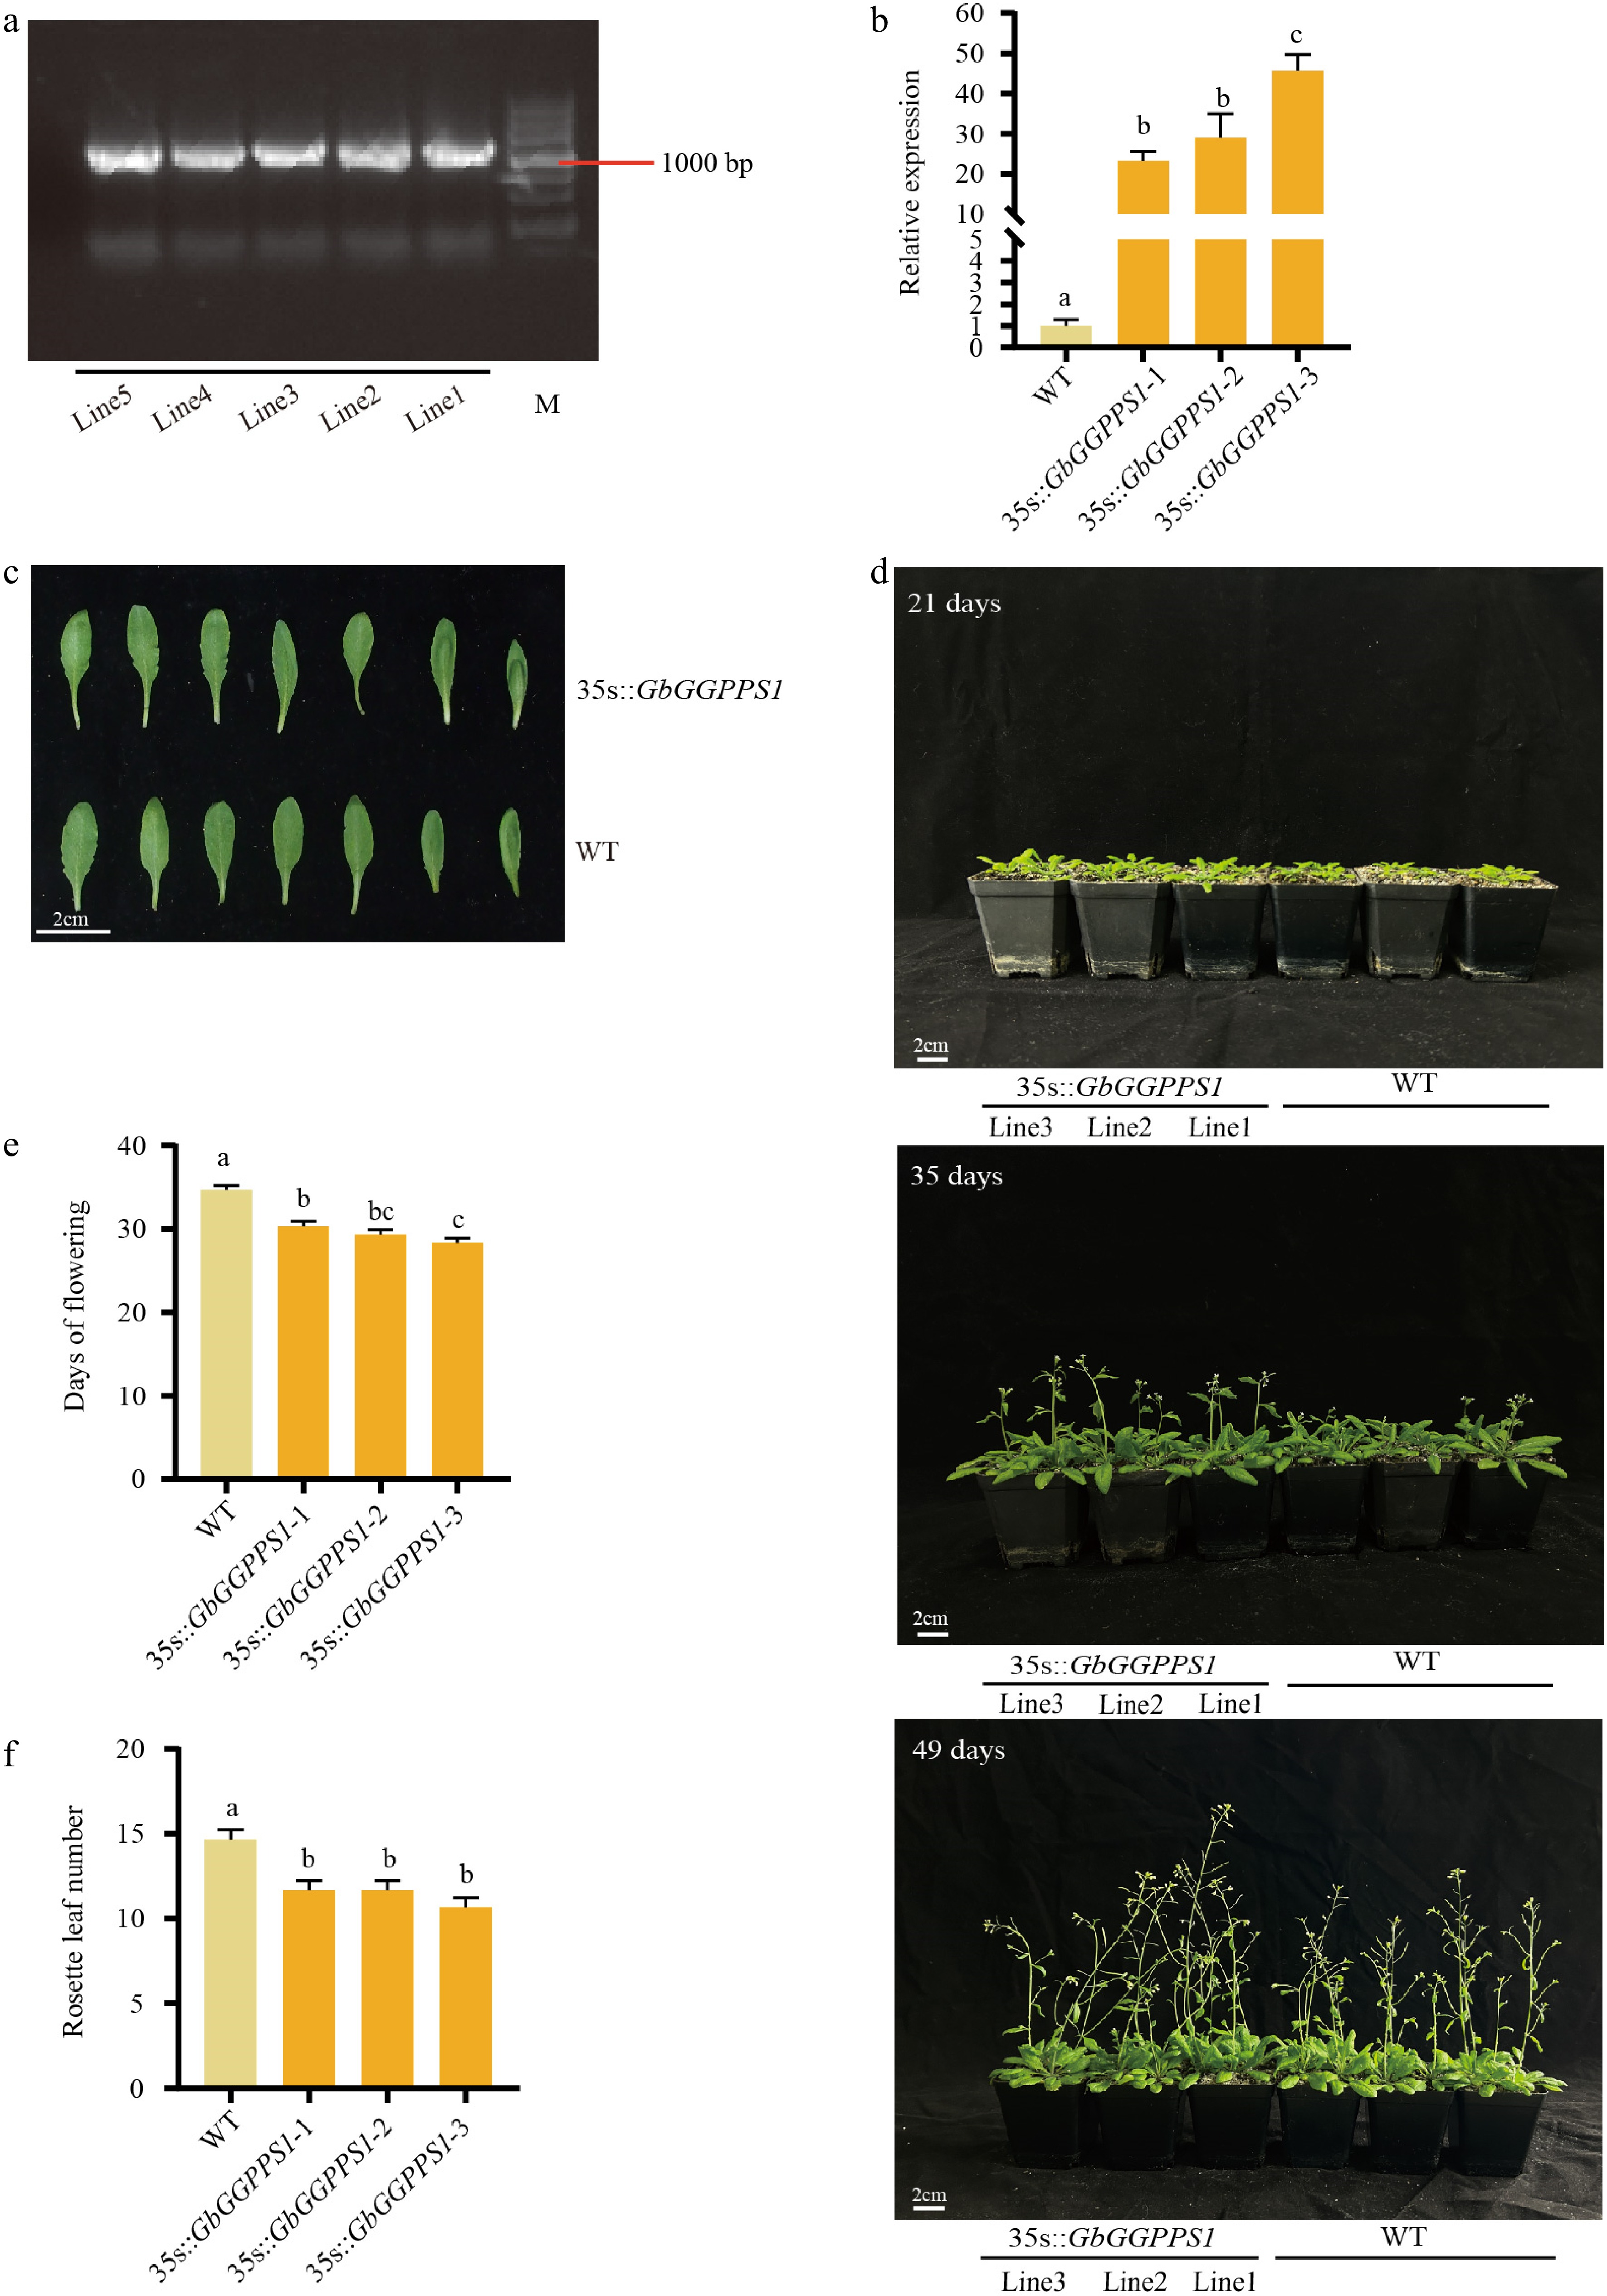
Figure 4.
Phenotypes of WT and transgenic Arabidopsis plants. Identification of transgenic plants by (a) PCR and (b) qRT-PCR. (c) Comparison of leaf phenotypes between WT and 35s::GbGGPPS1 Arabidopsis. (d) Phenotypes of WT and the 35s::GbGGPPS1 Arabidopsis at 21, 35, and 49 d. (e) Days to first flowering of WT and 35s::GbGGPPS1 Arabidopsis. (f) Number of rosette leaves of WT and 35s::GbGGPPS1 Arabidopsis.
-
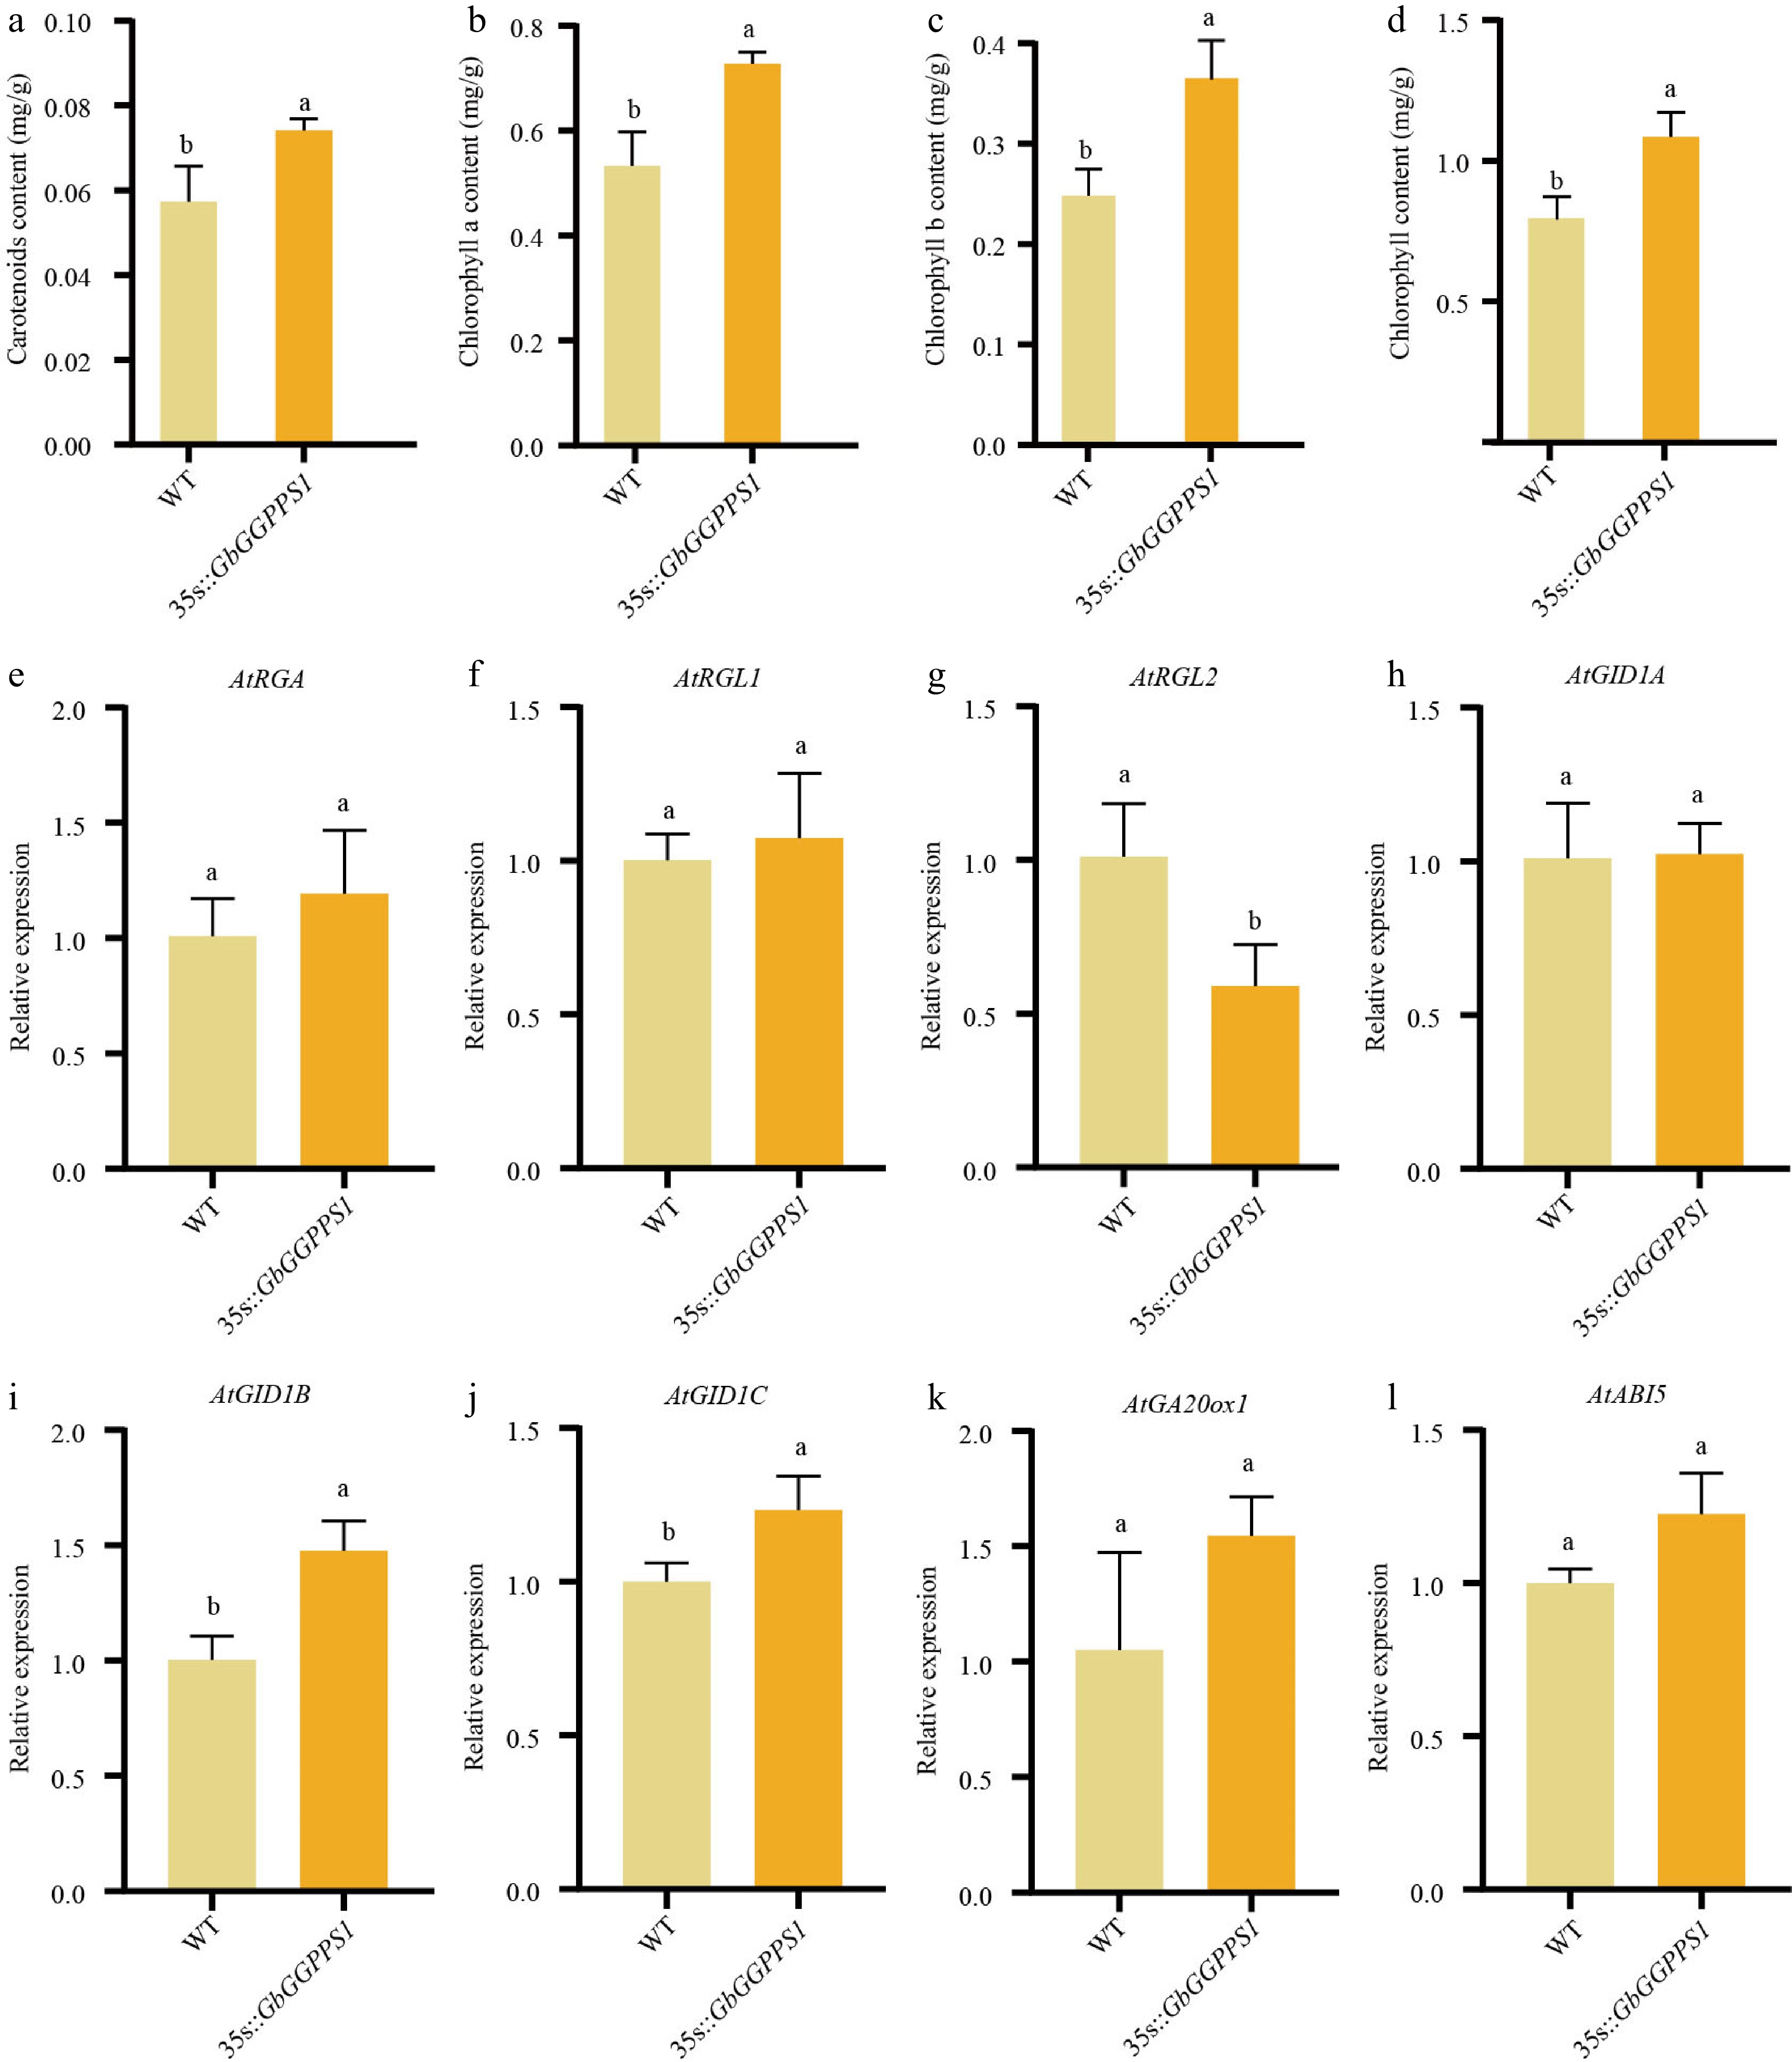
Figure 5.
Functional characterization of WT and transgenic Arabidopsis. (a)−(d) Chlorophyll content in WT and 35S::GbGGPPS1 Arabidopsis. (e)−(l) qRT–PCR analysis of the expression levels of GA- and ABA-associated genes in WT and transgenic Arabidopsis.
-
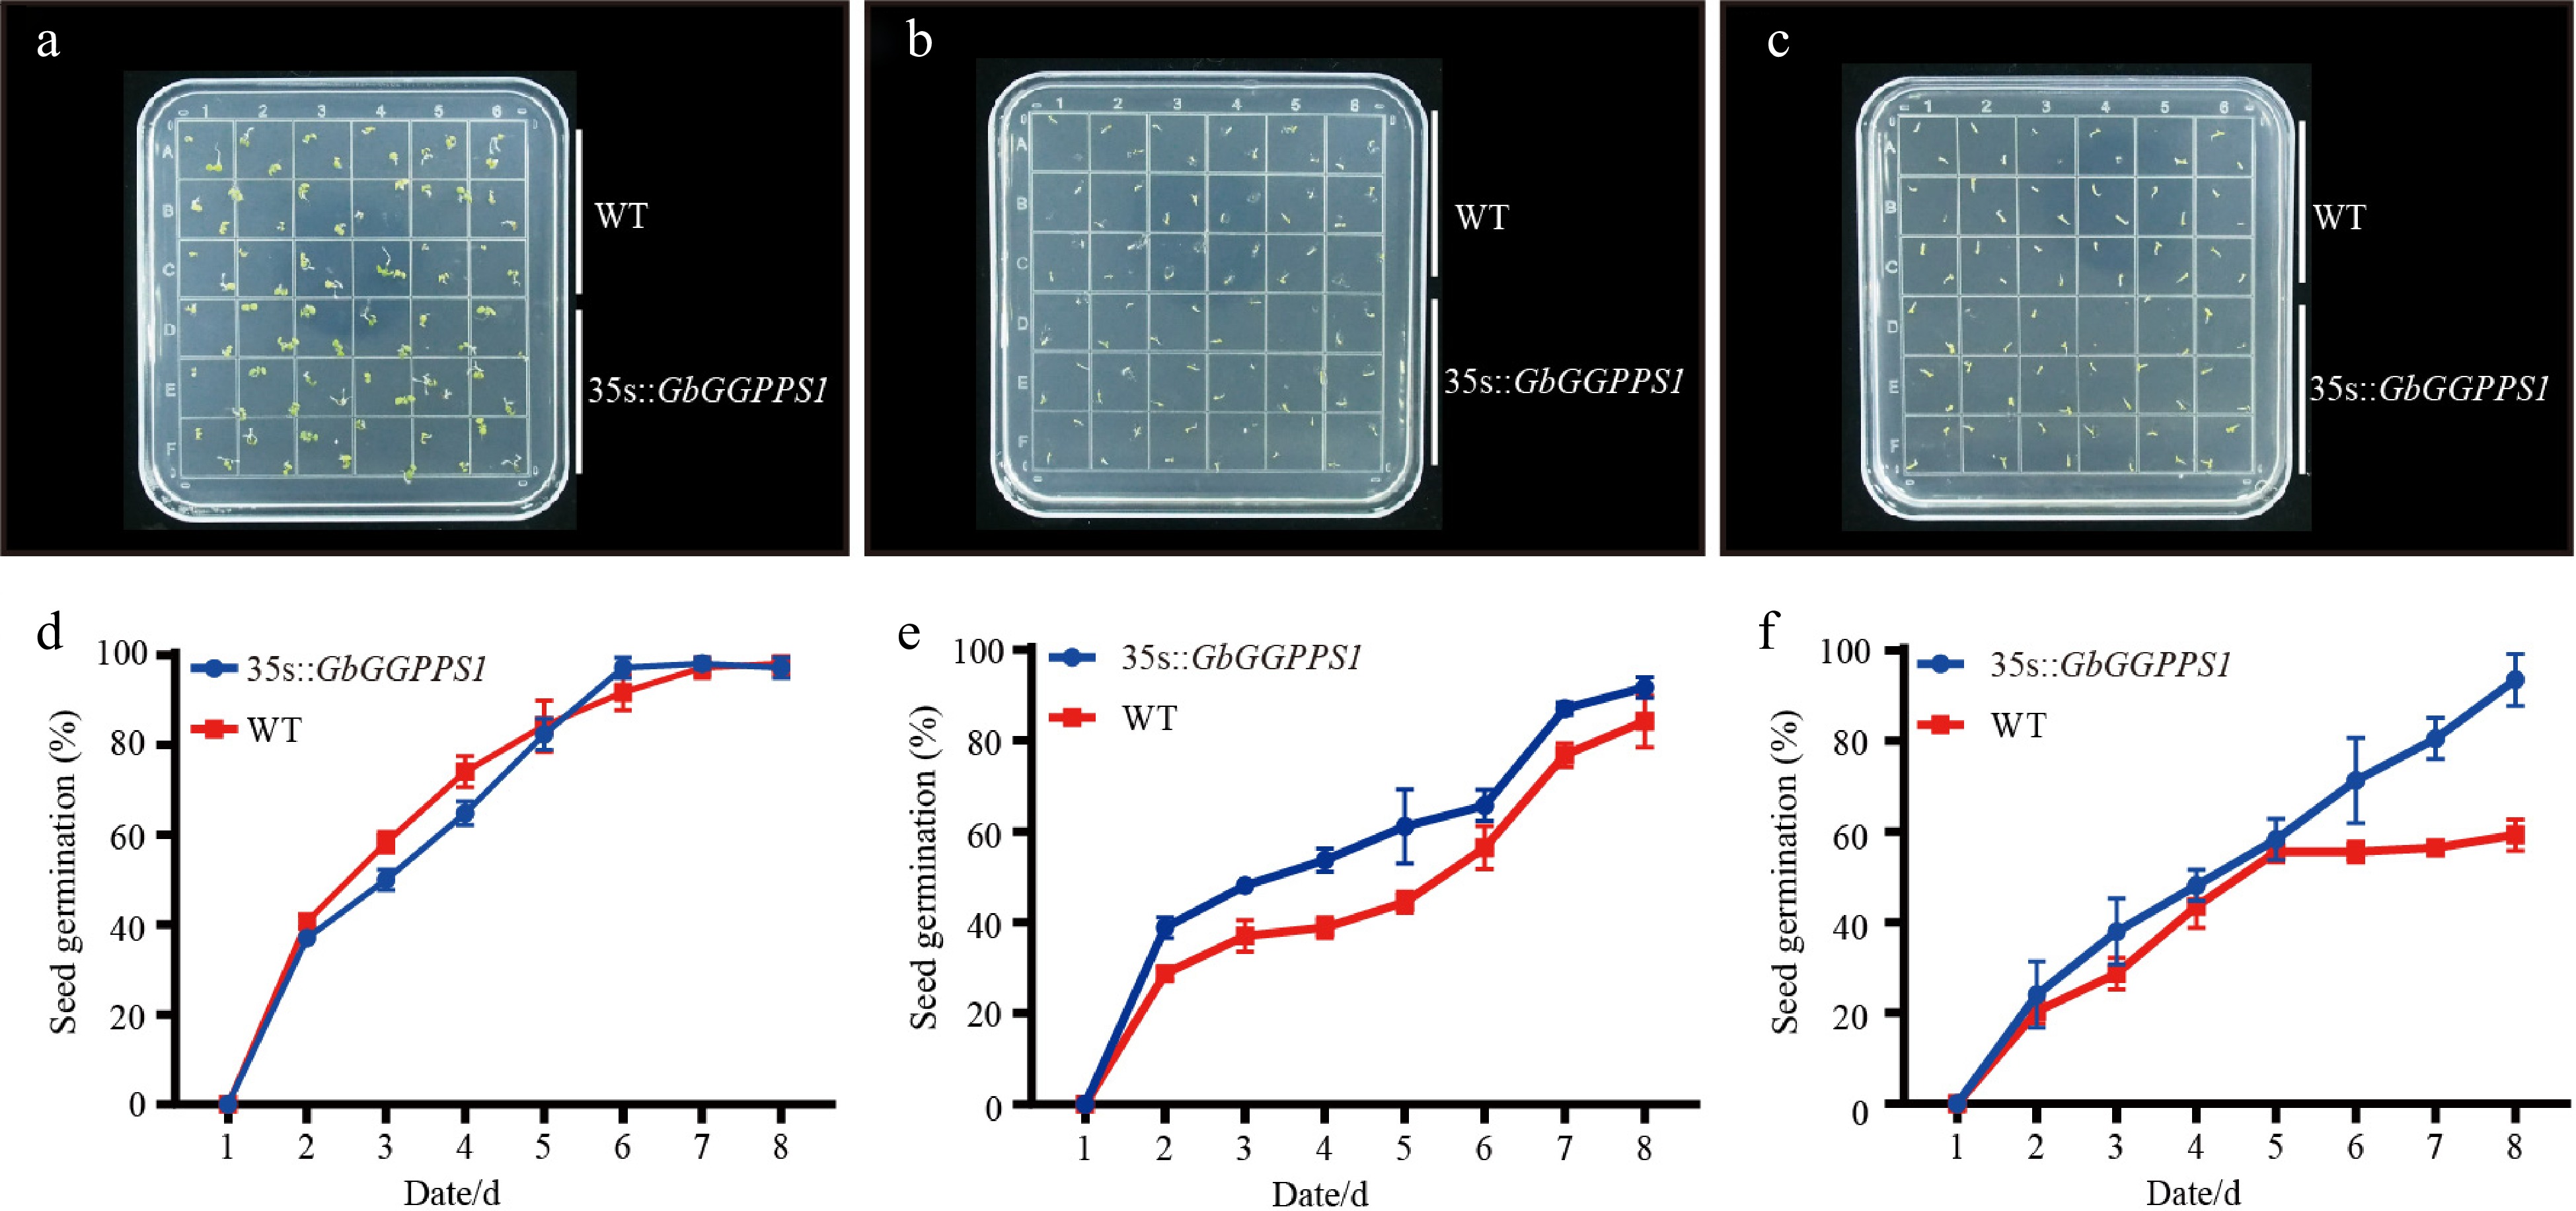
Figure 6.
Germination rates of Arabidopsis seeds treated with (a), (d) 0 mM NaCl, (b), (e) 100 mM NaCl, and (c), (f) 150 mM NaCl.
Figures
(6)
Tables
(0)