-
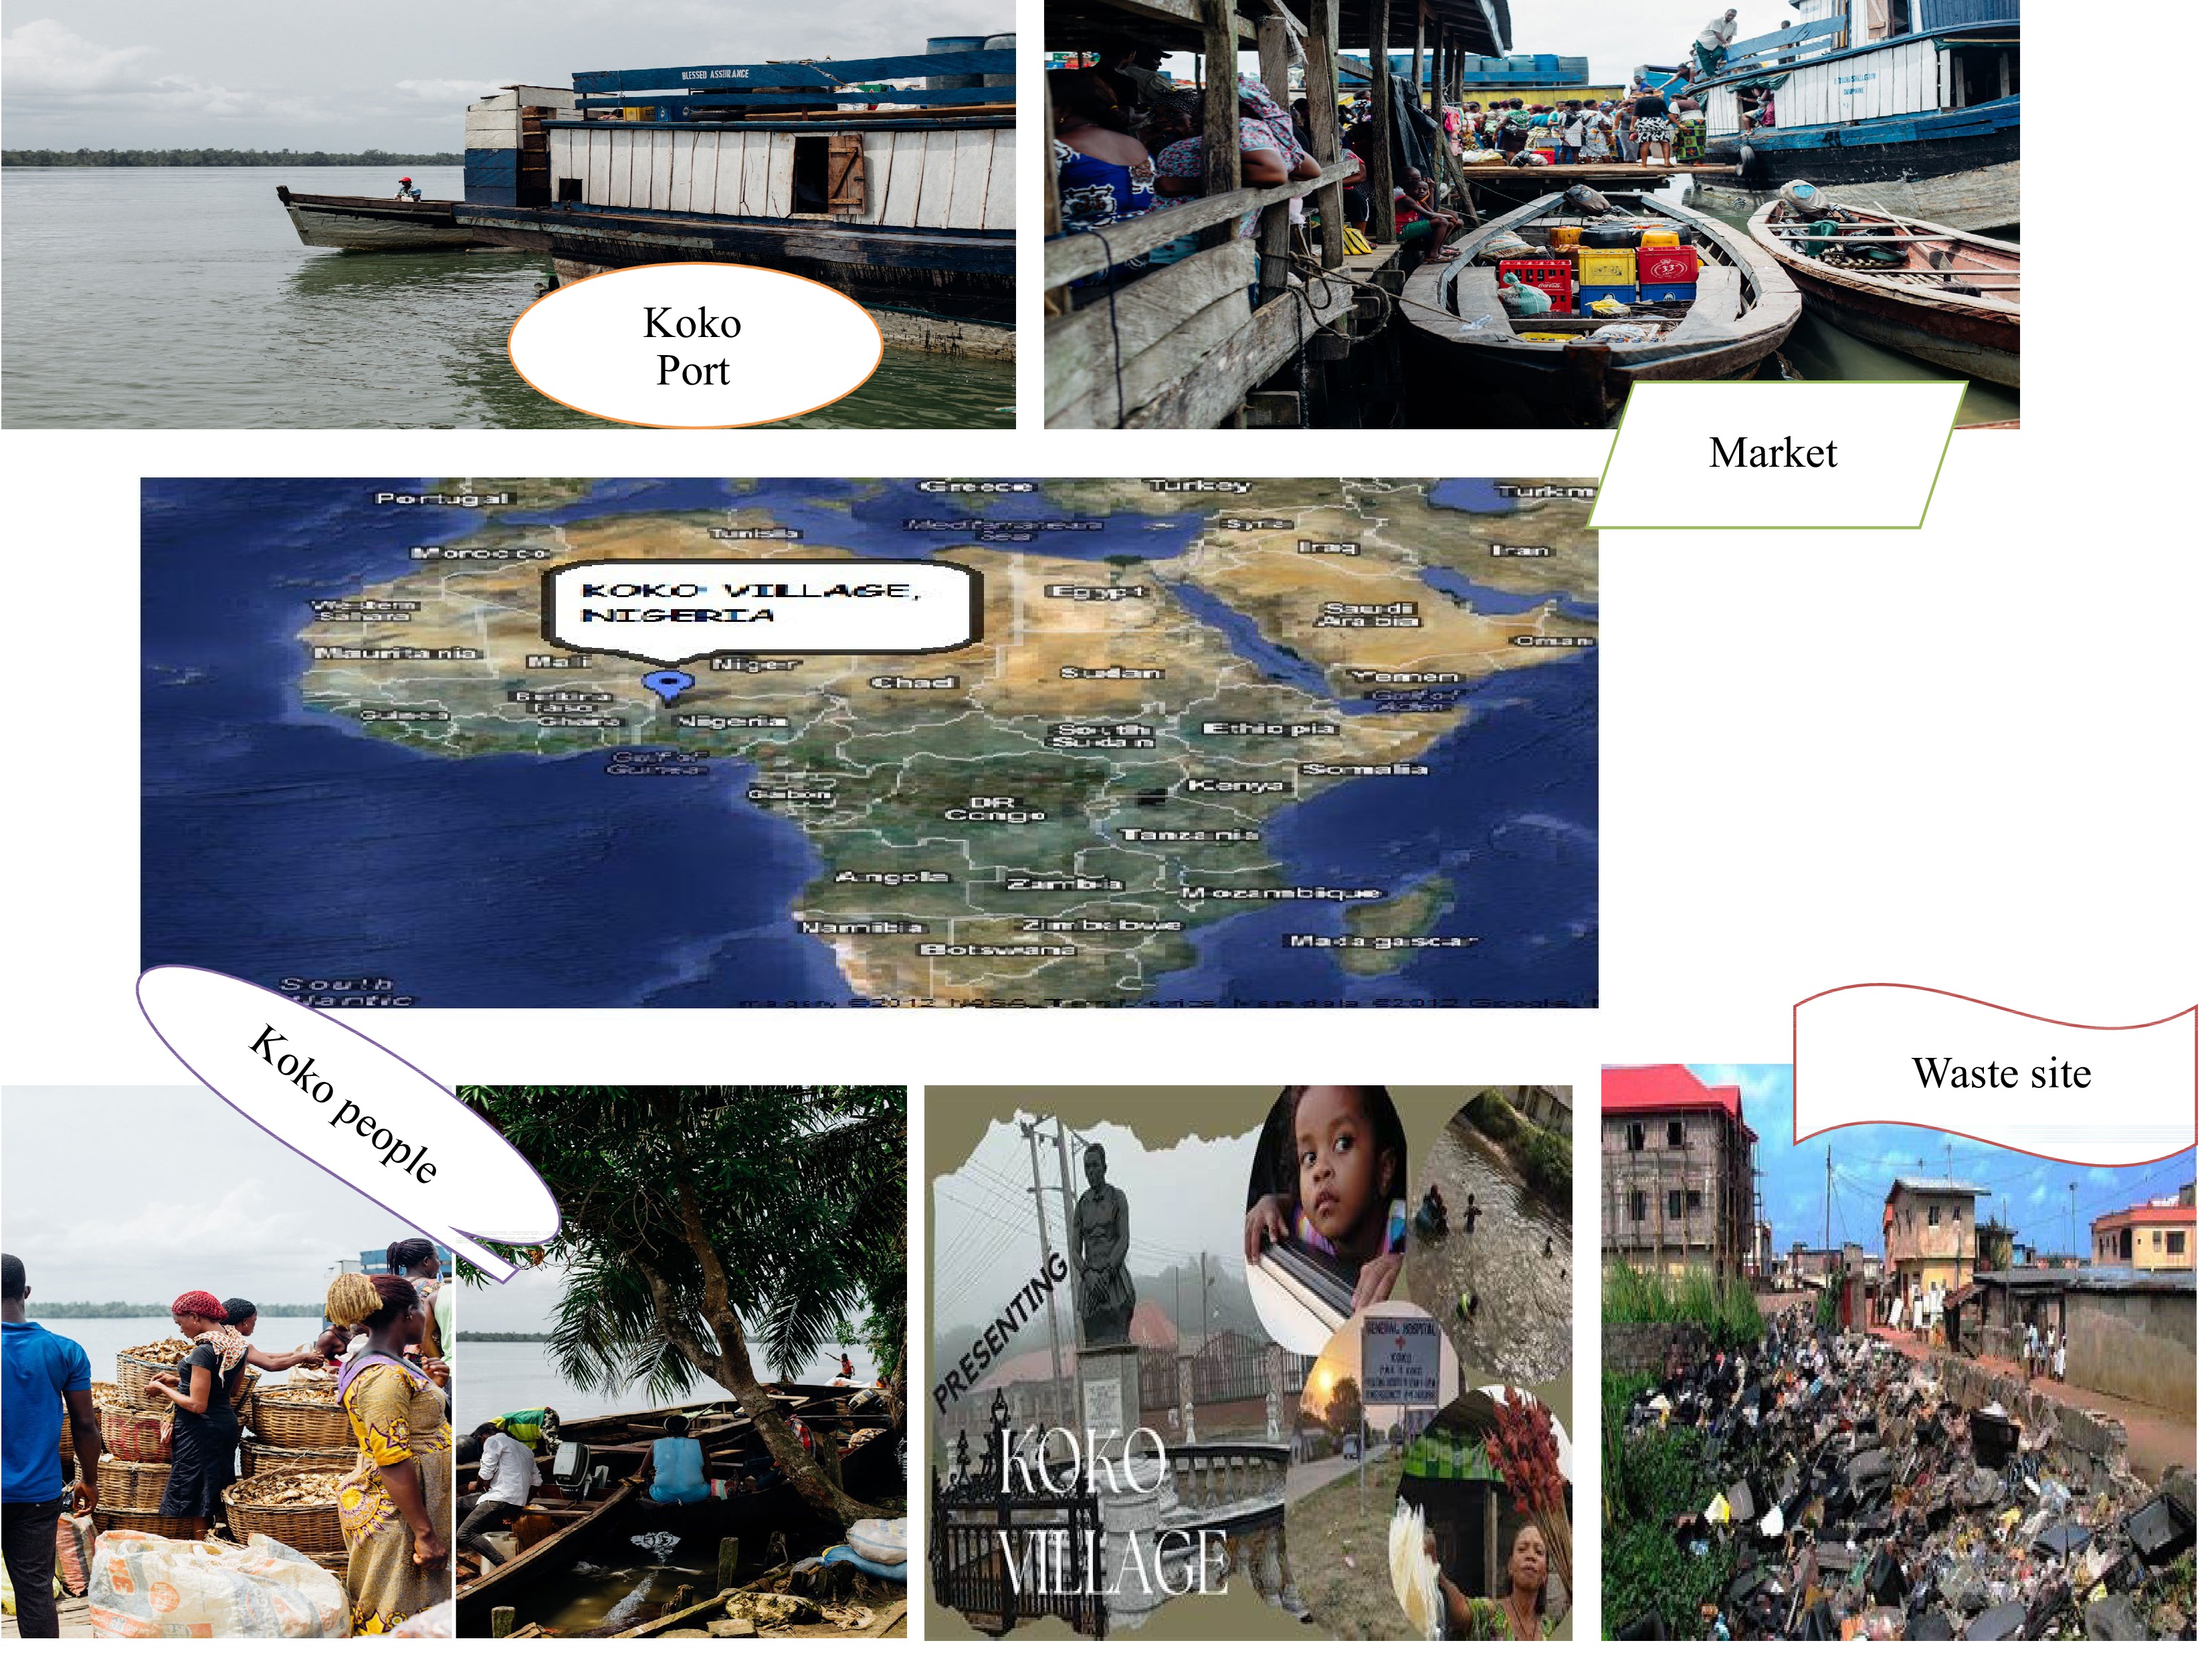
Figure 1.
Study region showing Koko village in Warri North Local Government Area, Nigeria.
-
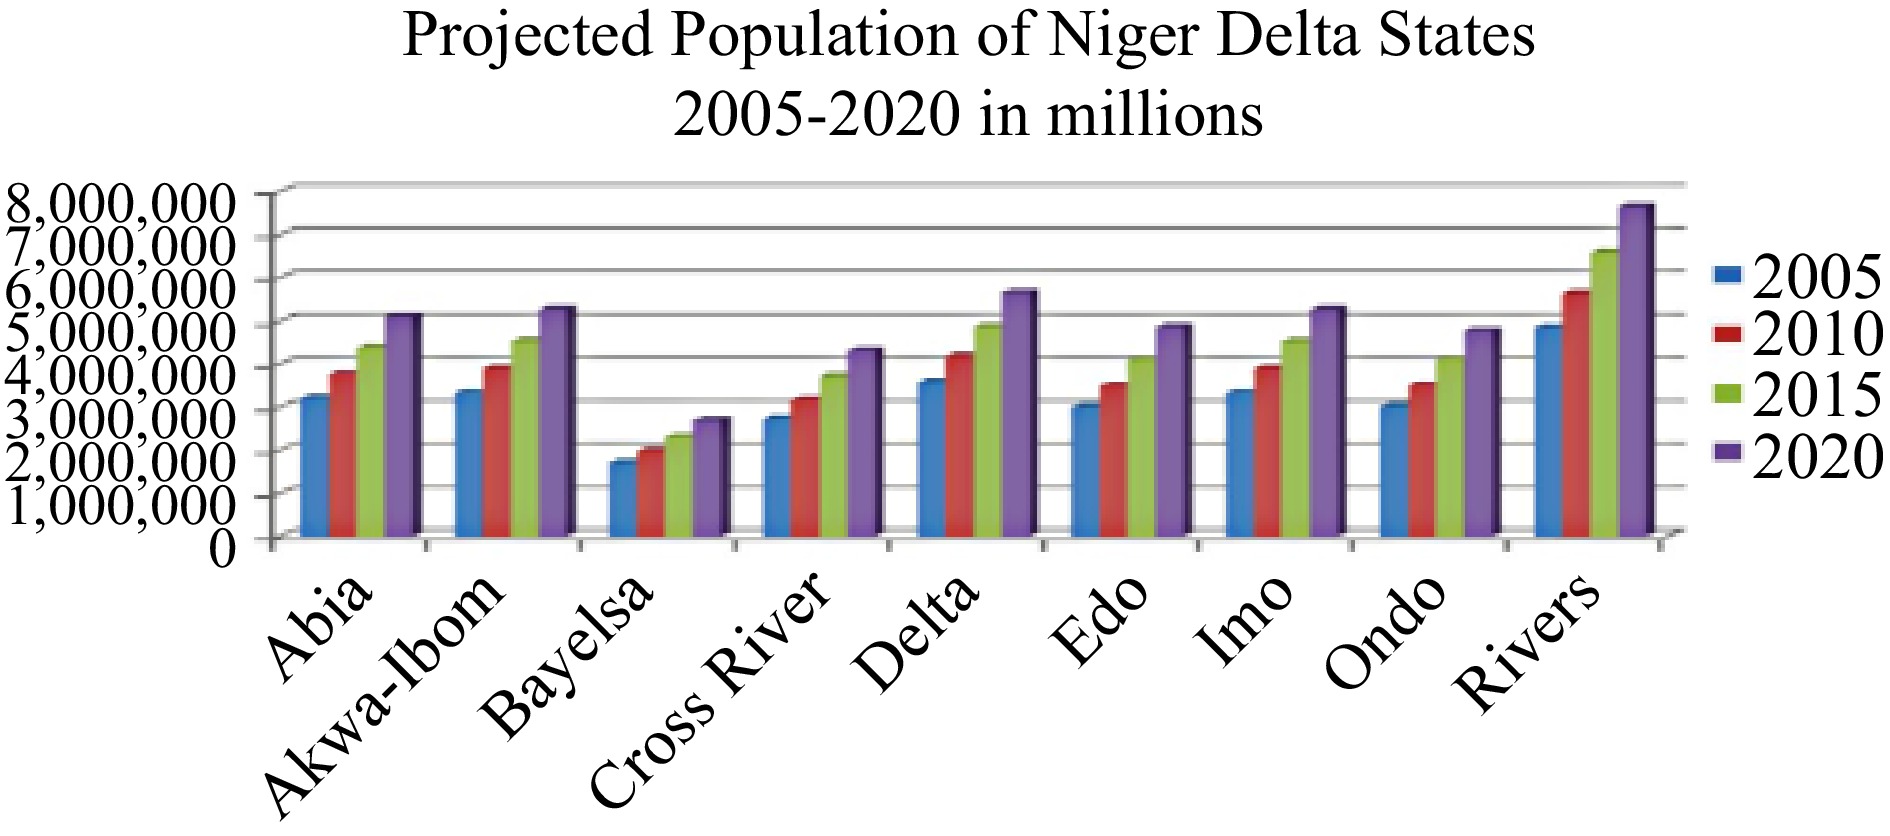
Figure 2.
Niger Delta state population projection based on NPC data and growth rates.
-

Figure 3.
Typical tank farm and fire pump station.
-
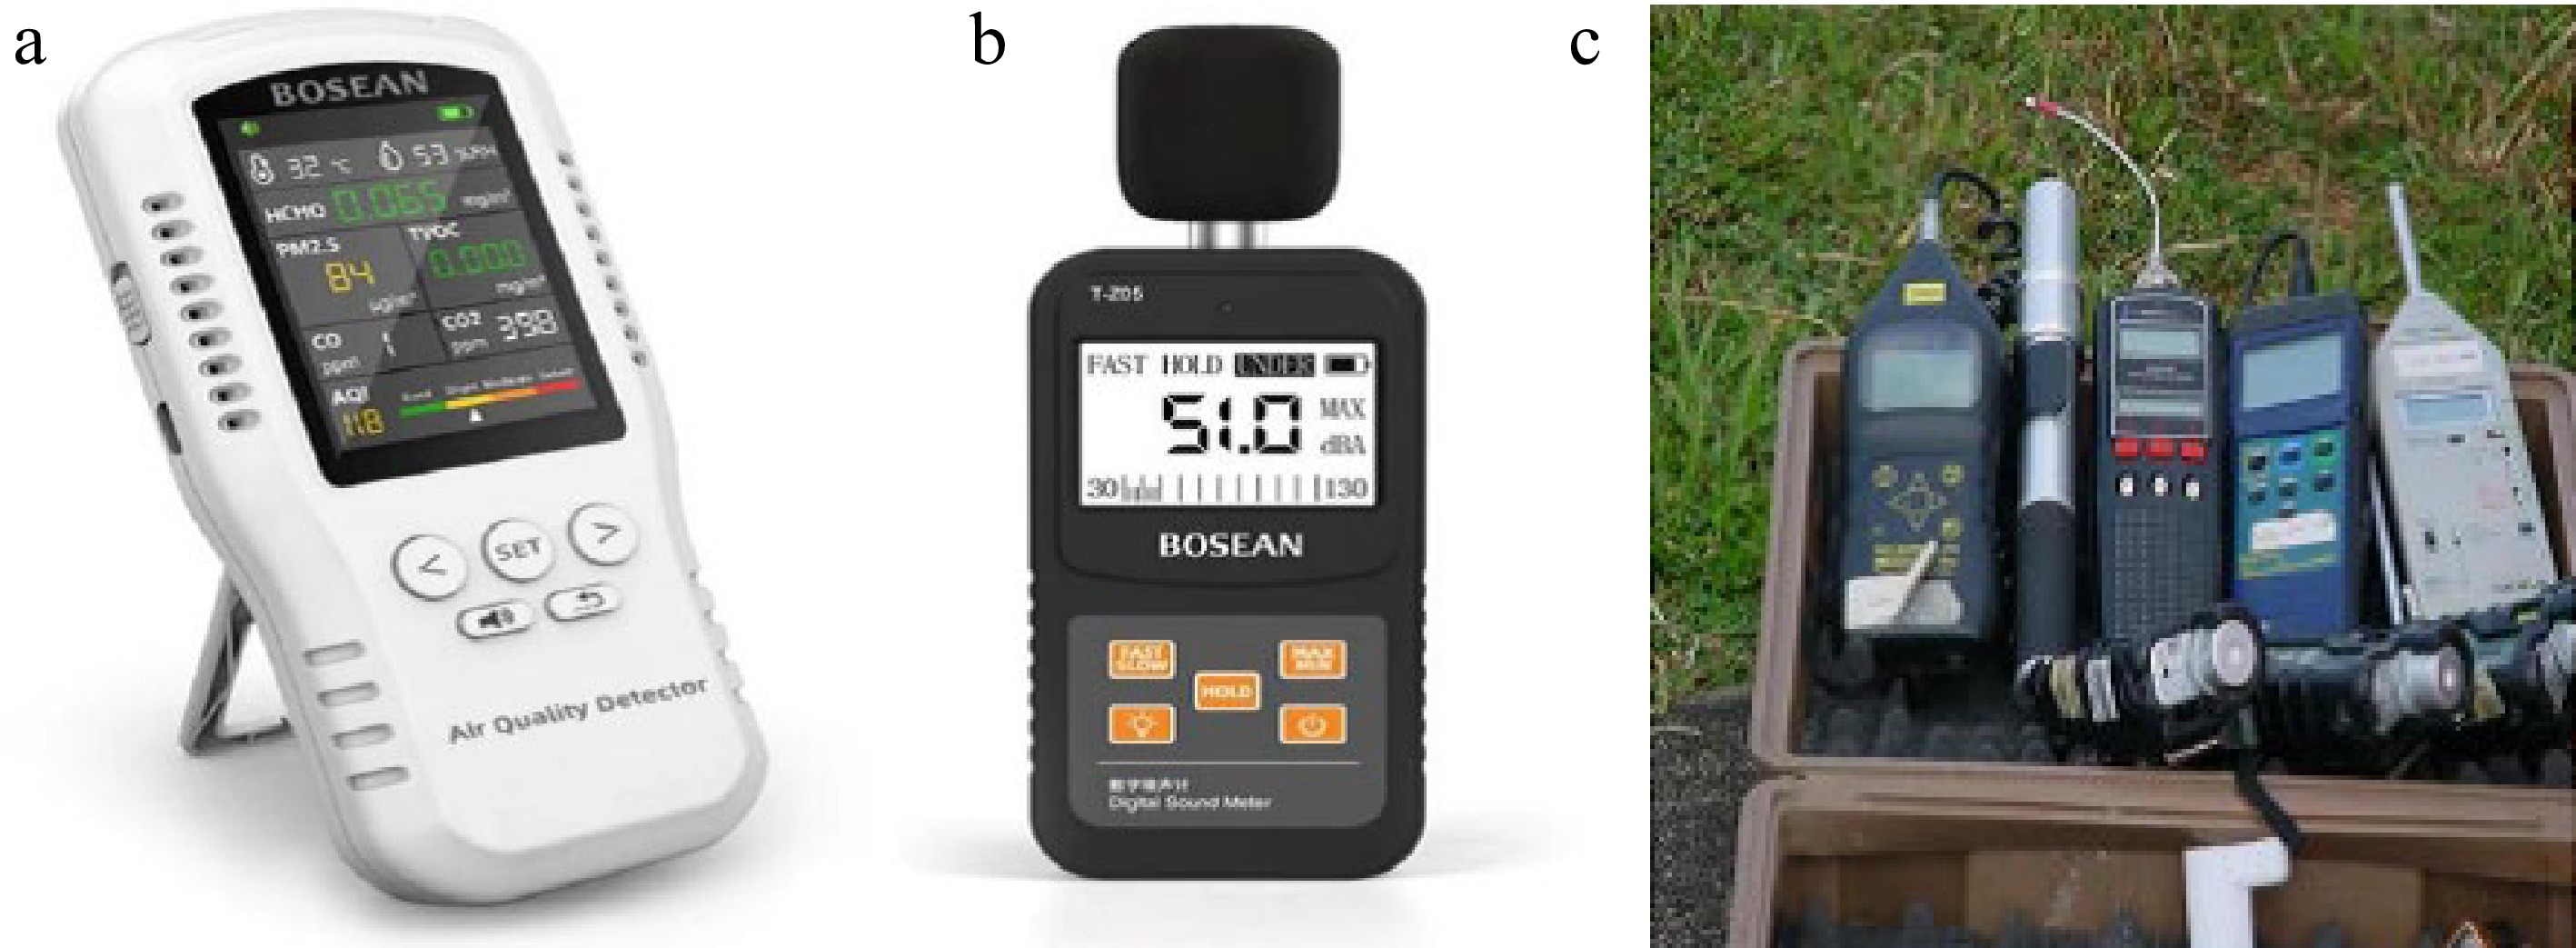
Figure 4.
Bosean. (a) Airborne particulate. (b) Noise level monitor counter. (c) Multigas monitor.
-
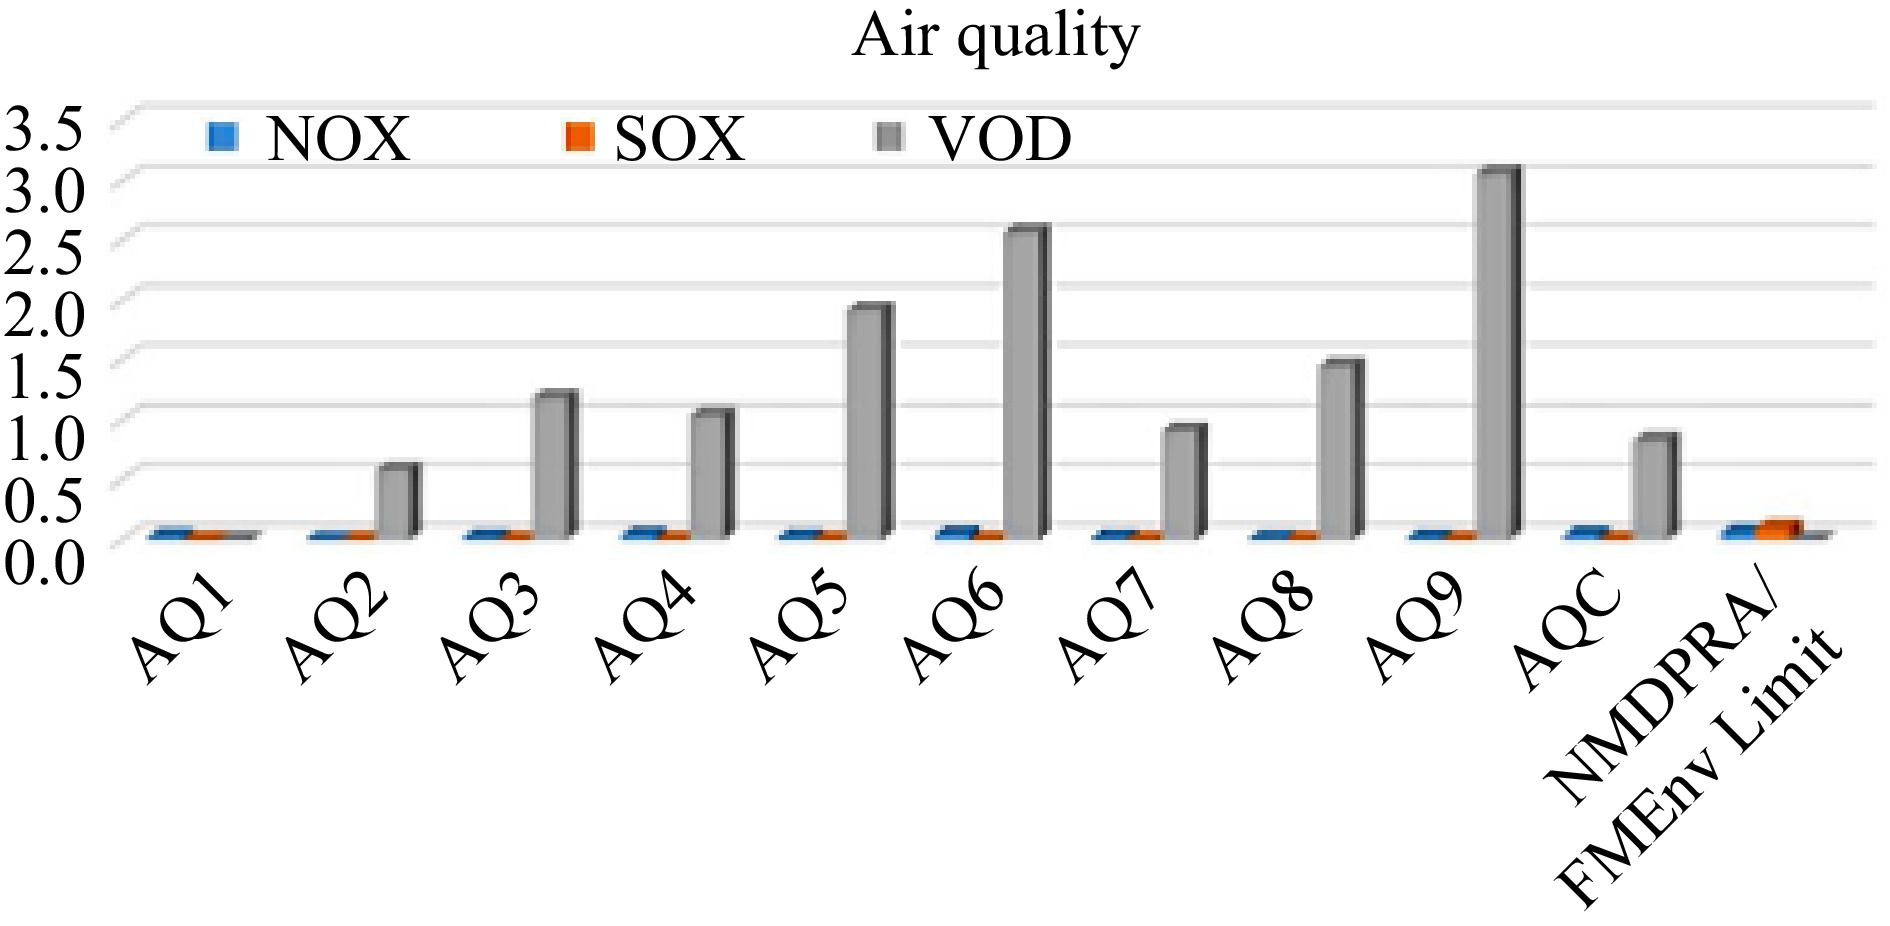
Figure 5.
Comparison of VOC, NO2 and SO2 concentrations with regulatory standards.
-

Figure 6.
Water attribute scrutiny outcome for: (a) DO, (b) BOD, (c) calcium and (d) TSS.
-
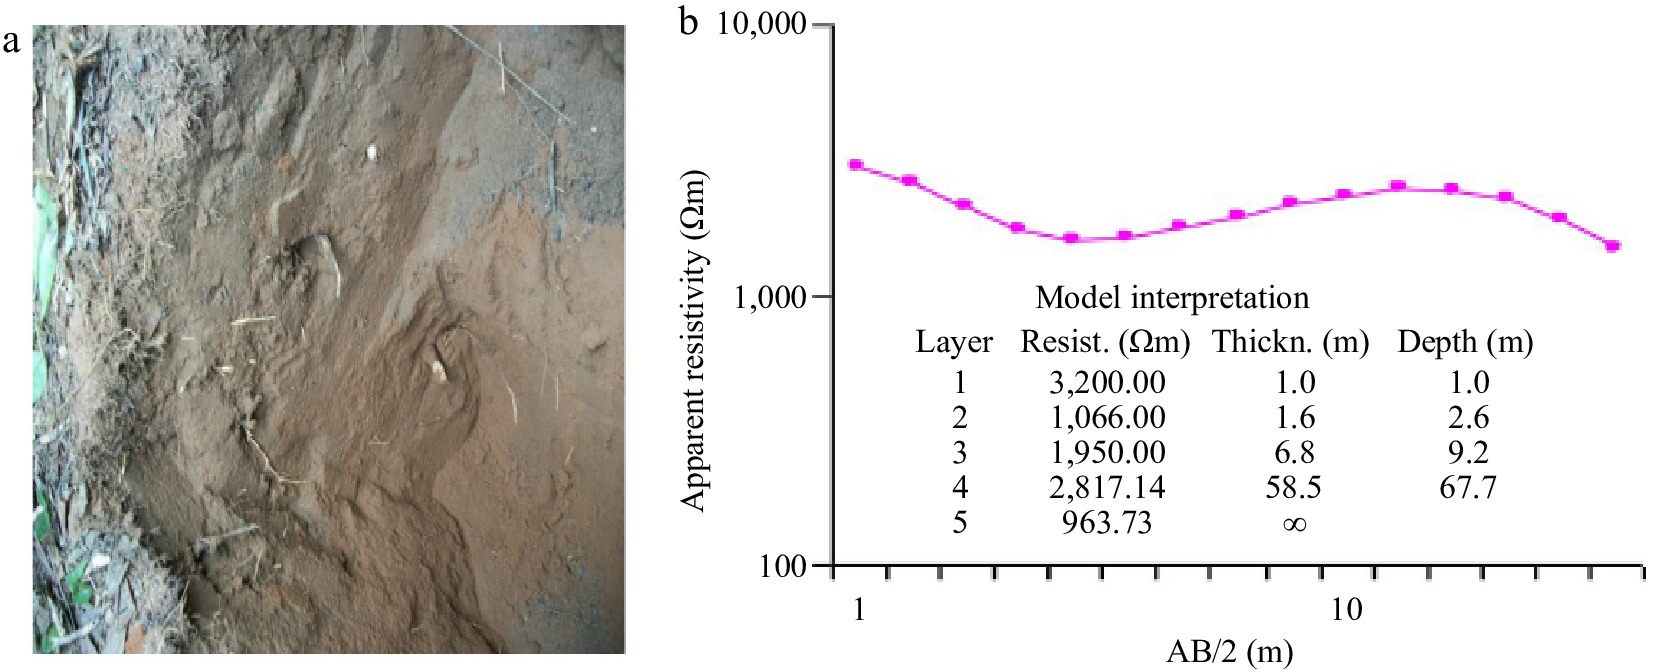
Figure 7.
(a) Friable poorly sorted loose sandy-silt (0.05–0.002) with moderately frequent roots inclusions and, (b) response PNG-VES data for environmental geophysical investigation.
-

Figure 8.
Delta soil contents in borehole log.
-

Figure 9.
Outcome of various conflict issues.
-
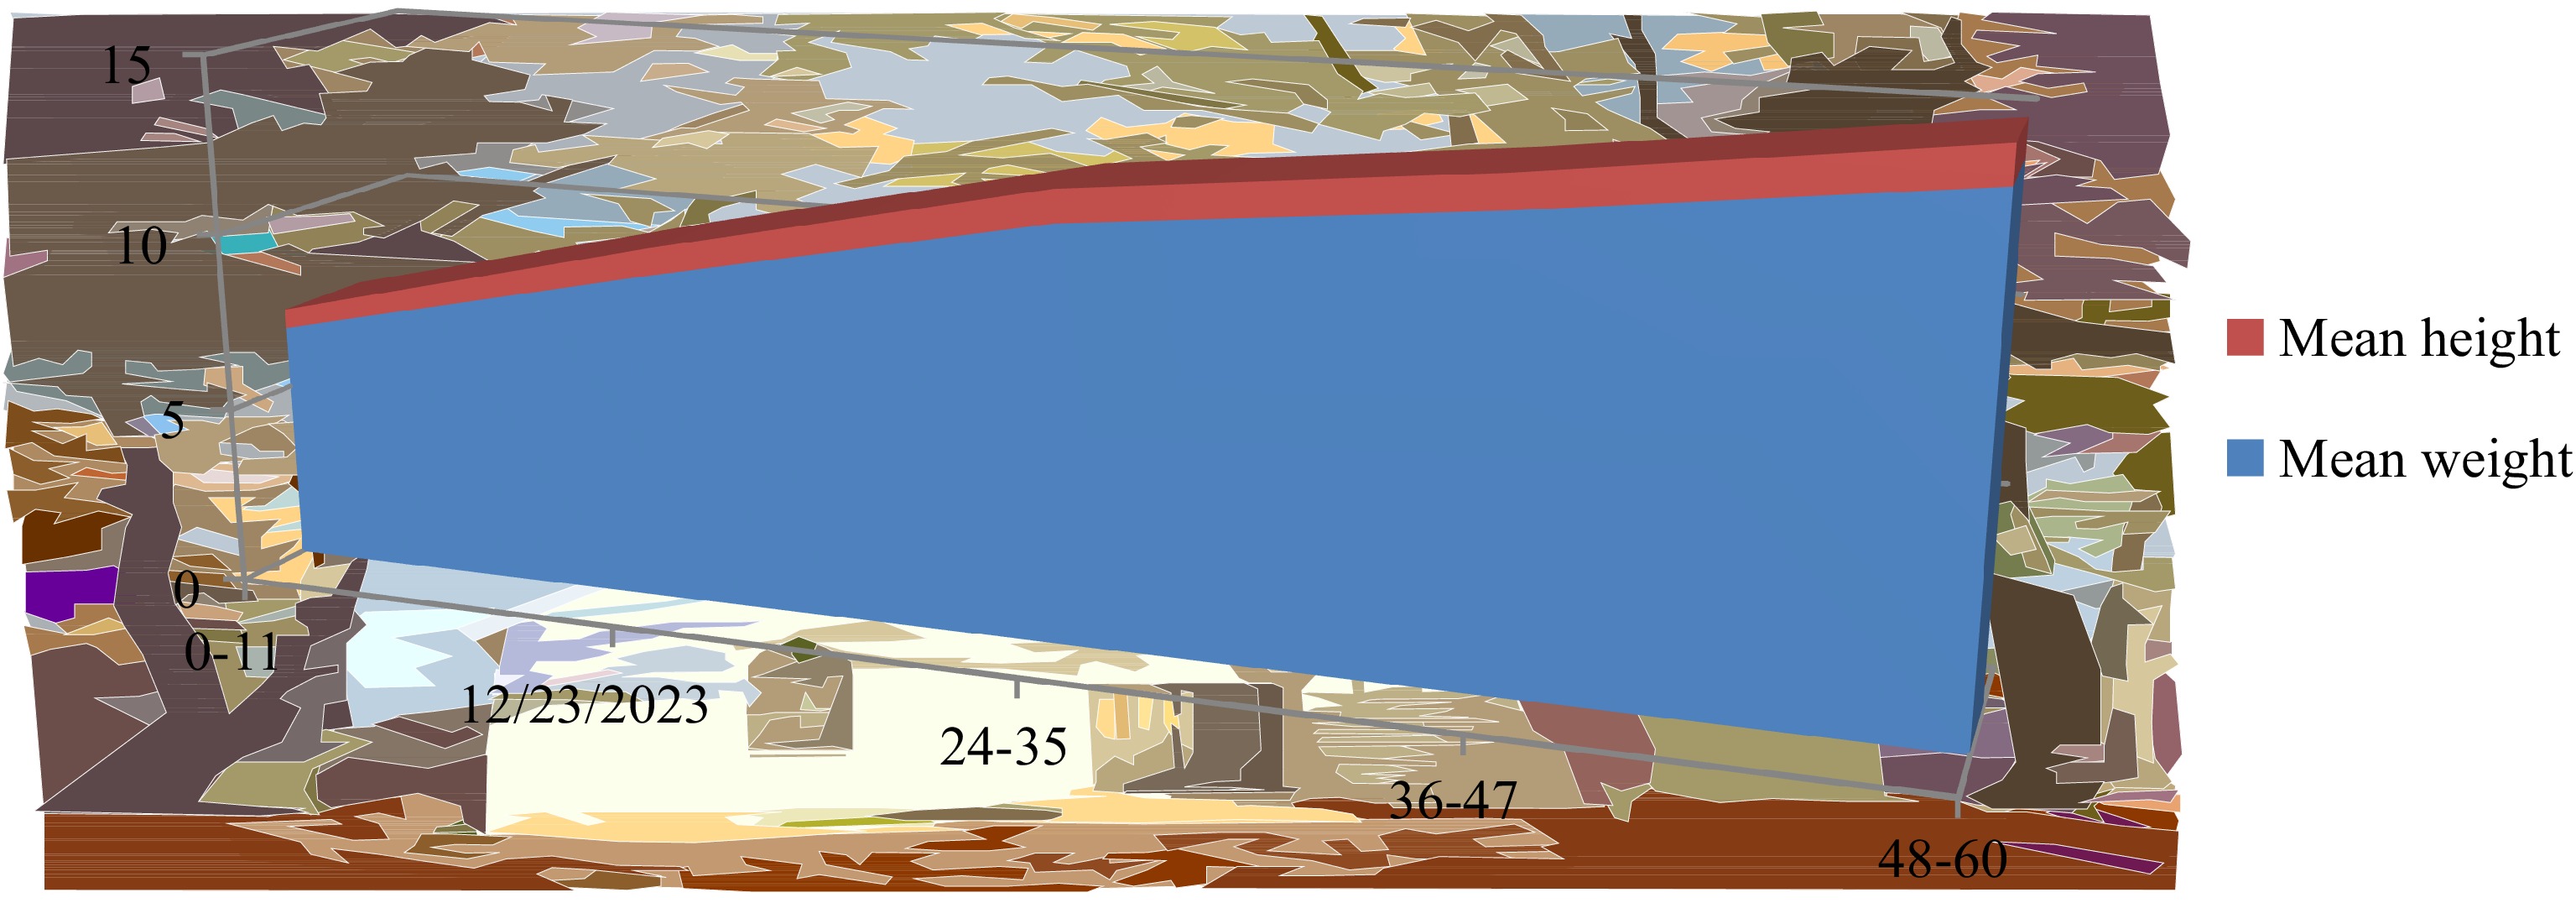
Figure 10.
Graphical displaying of weight and height of the populace in the scrutiny commune.
-
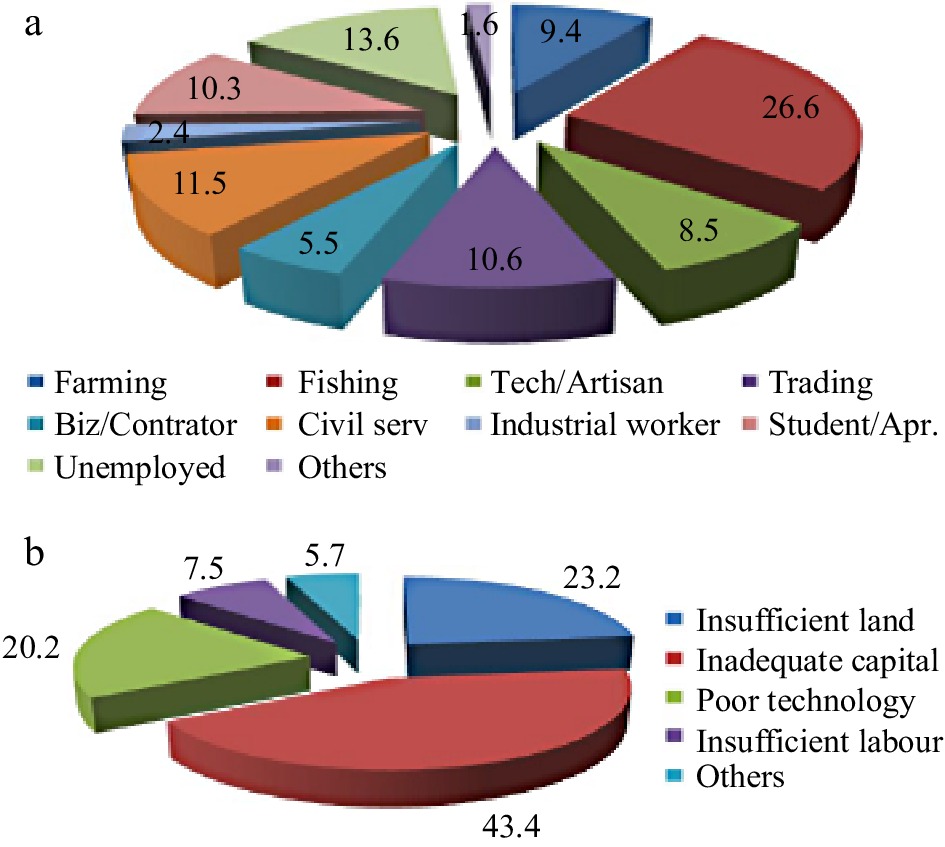
Figure 11.
Respondent (a) occupations and (b) farmer constraints.
-
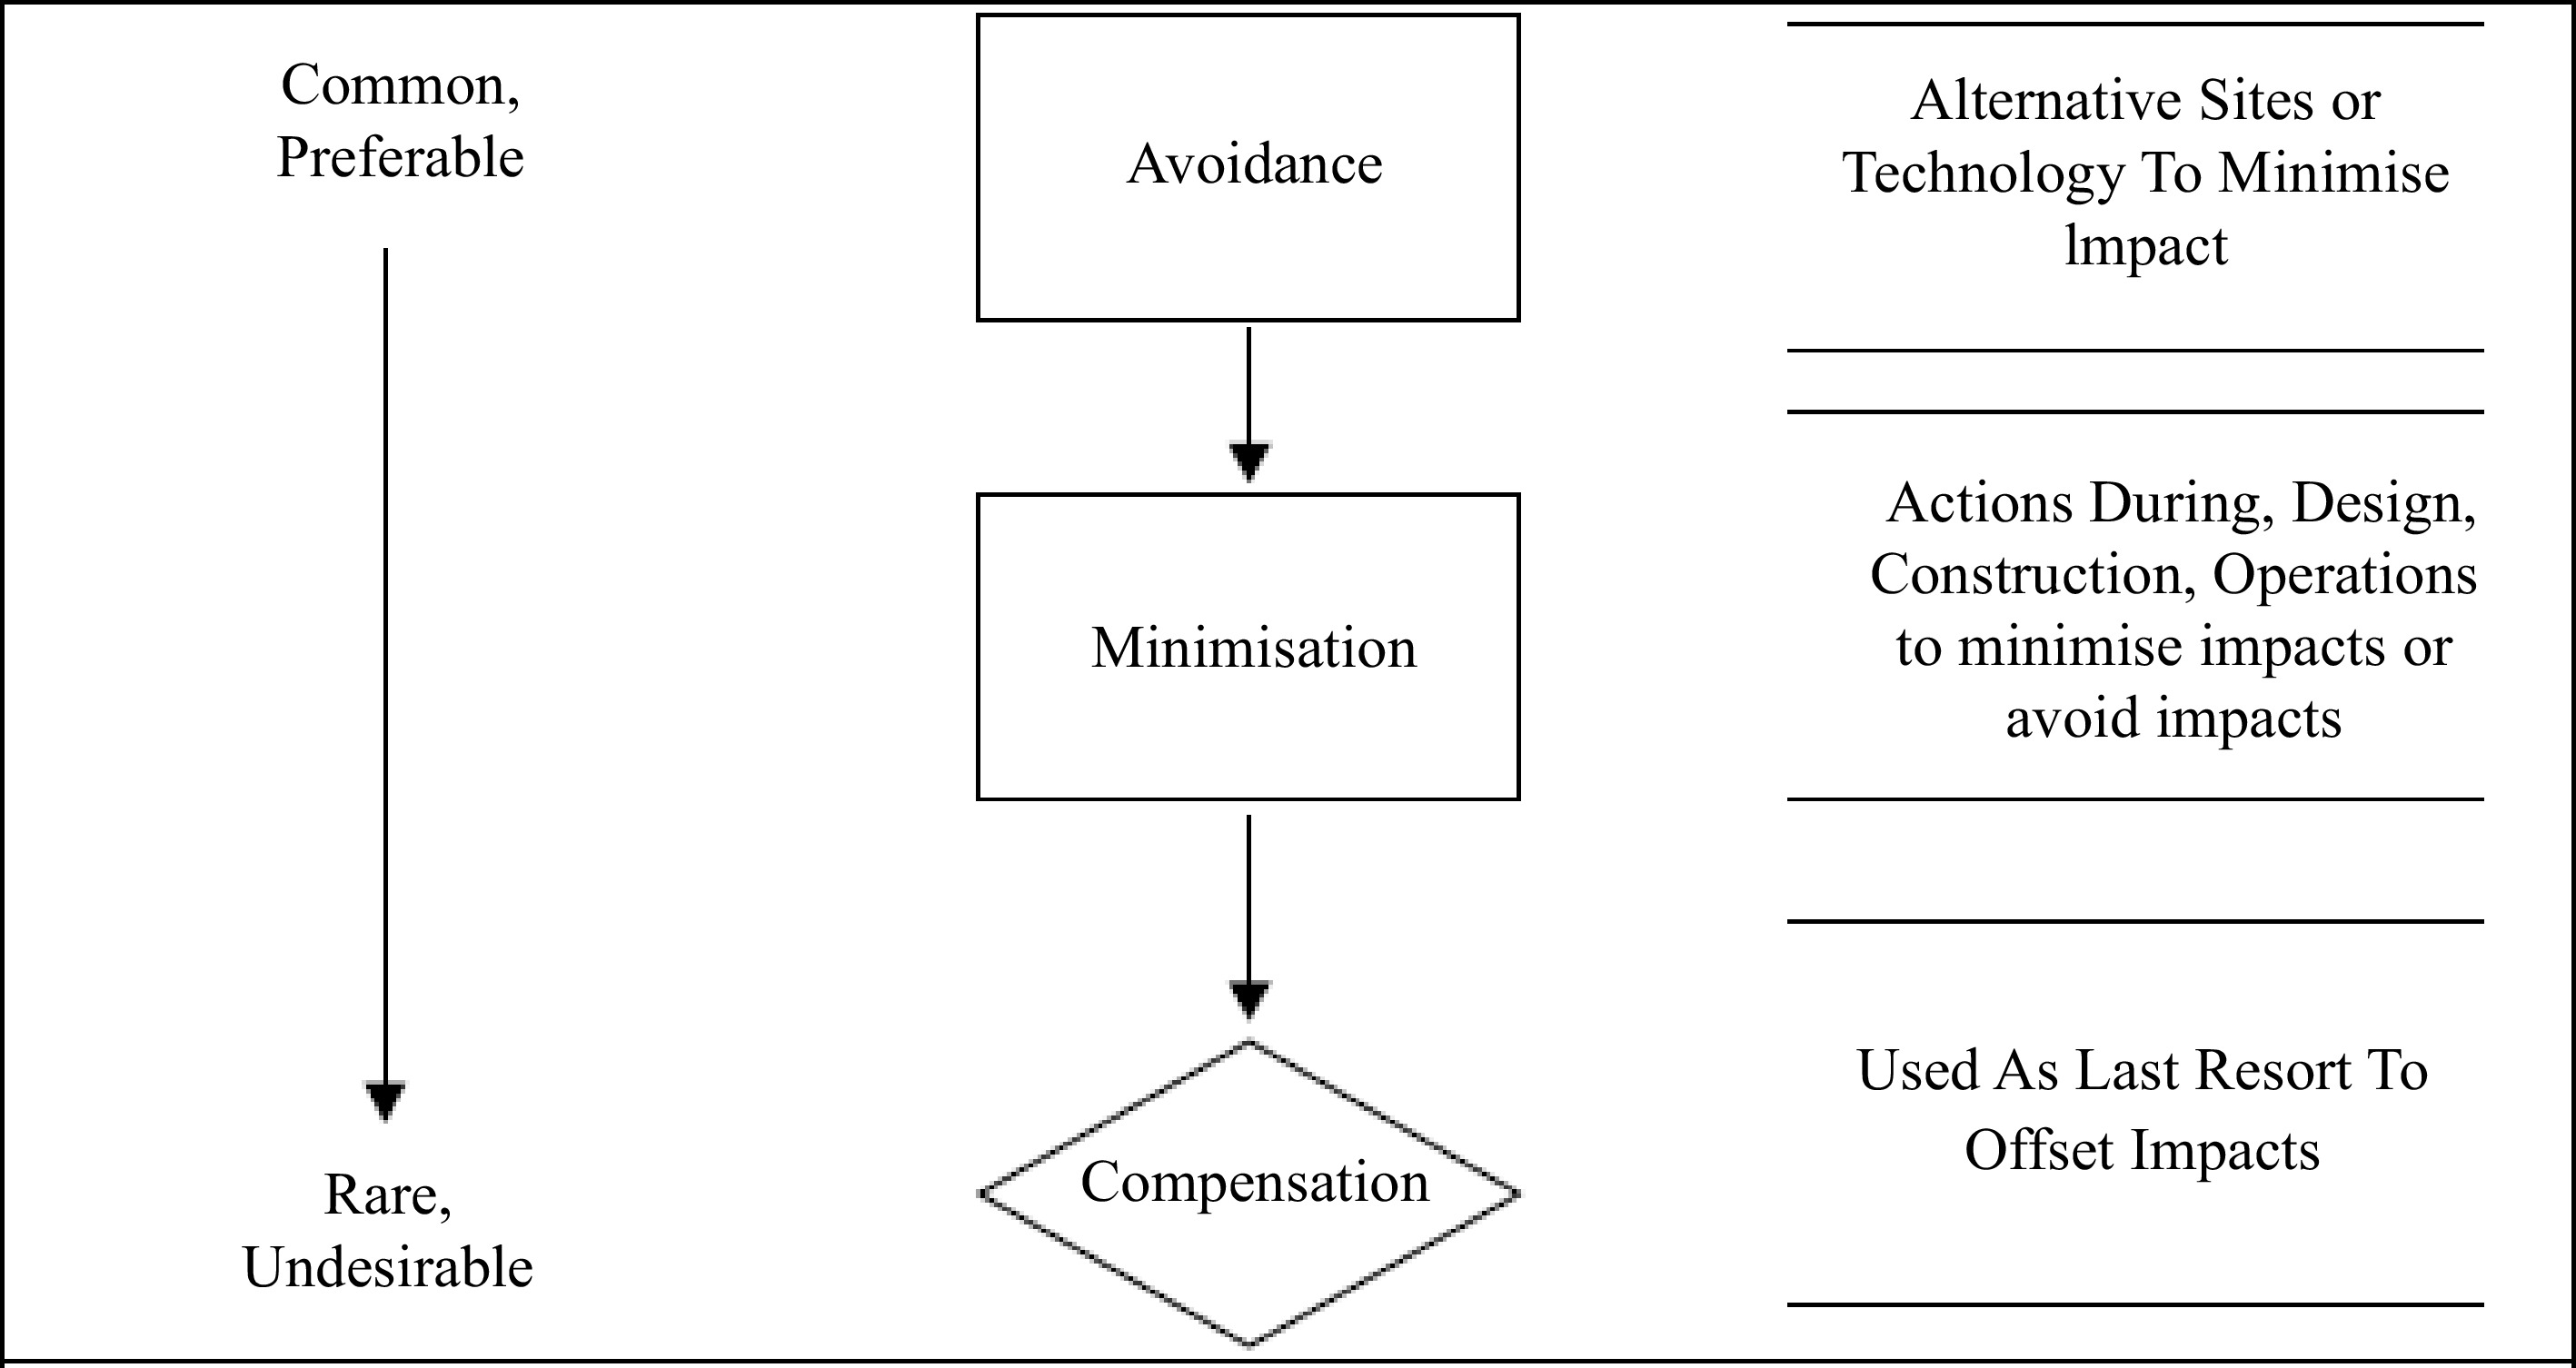
Figure 12.
Outcome of mitigation fundamentals for Delta.
-
Parameters Unit Acronyms Techniques and instruments Total Suspended Particle TSP Temptop PMD 351Handheld air borne aerosoil meter,
(HPPC 6+) sum efficiency –50.0% @0.30µmTemperature, dew point, relative humidity and wind speed T (°C), DP, RH
and WSKestrel 5500 weather meter was utilized for the microclimate measurement. Heavy metals Manganese, Lead, Copper, Nickel, Cadmium, Cobalt, Zinc Mg, Pb, Cu, Ni,
Cd, Co, ZnAPHA 3111B, UNICAM 969 AAS Microbiology (cfu/mi) Coliform, Ecoli, Staphylococcu, Vibrio, Total coliforms, Aerobic plant count, Yeast & Mould APHA 9215C Anions Nitrate, Nitrite (mg/l) ${\text{NO}^-_3},\; {\text{NO}^-_2} $ APHA 4500, UN spectrophotometer Sulphate, Phosphate (mg/l) SO4, ${\text{PO}^{3-}_4} $ APHA 4500B, UN spectrophotometer Calcium (mg/l) Ca APHA 4500A, UN spectrophotometer Physico-chemical Hydrogen ion concentration pH pH meter/insitu Colour (Pt.Co) APHA 2120A Dissolved oxygen (mg/l) DO APHA 5220A, DO meter Conductivity (µs/cm) Cond APHA 2510A, multi- parameter Chloride (mg/l) Cl− APHA 4500 B, titration Total dissolve solids (mg/l) TDS APHA 2540A, gravimetric Total suspended solids (mg/l) TSS APHA 2540D Appearance APHA 2110 Acidity (mg/l) APHA 2310B Ammonia Nitrogen (mg/l) NH3C APHA 4500 Turbidity (mg/l) Turb APHA 2130B, turbidity meter Bacterial oxygen demand (mg/l) BOD APHA 5210B, Incubator/winkler Chemical oxygen demand (mg/l) COD APHA 5220D, K2C-207 reflux Alkalinity (mg/l) Alk APHA 2320B, Titration Detergent (mg/l) APHA 5540C Oil and grease (mg/l) APHA 5520B Table 1.
Measurement techniques with its water attributes physiognomies.
-
Parameters Instrument Techniques Above permissible limit health impact Sulphur IV oxide (SO2) SO2 Gas Alert test meter Direct reading Causes irritation of the respiratory tract Particulate matter (PM) Gas Alert test meter Gravimetric Causes catarrh, cough, lung infections and other respiratory diseases Combustible gas (CHN) Gas Alert test meter Direct reading Induces a despondent and depressed state Carbon monoxide (CO) CO test meter Direct reading Lessens the oxygen-carrying blood capability to damage of the central nervous system Oxides of Nitrogen (NOX) NOx test meter Direct reading Causes inflammation of the lungs but less toxic Noise Noise meter, Rion sound
level meter, NA modelDirect Reading Table 2.
Scrutiny techniques and some health impact of contagions.
-
Contagions Health impacts Short term Long term Ethylbenzene Dizziness, eye and throat irritation Blood disorders Benzene Skin blister and irritation, upper respiratory tract Developmental and reproductive disorders n-Hexane Headache, giddiness and nausea. Blurred vision, fatigue, extremities and headaches
Birth defectsToluene Sleep difficulty, dizziness, skin and eyes irritation Nervous system disorder Xylenes Nose, gastric and throat irritation, neurological, vomiting and nausea Table 3.
Some contagions and effects.
-
Parameter Unit NMDPRA/
FMEnv LimitSites Limit (%) A1 A2 A3 A4 A5 Within Not Ambient temp °C 30 31.7 32.4 33.2 32.8 30.7 0 100 Wind velocity m/s N/A 2 1.8 1.5 1.9 1.7 − − Wind direction N/A SW SW SW SW SW − − Atm. pressure hPa N/A 1,011 1,011 1,012 1,011 1,011 − − Rel. humidity % N/A 72.4 67.2 64.1 66.5 76.9 − − Noise level dBA 80−100 58.7 62.8 52.0 50.5 53.7 100 0 SPM μg/m3 90/250 69.8 72.7 81.4 70.1 85.4 100 0 NOx ppm 0.04−0.06 0.026 < 0.001 0.018 0.035 0.02 100 0 SOx ppm 0.01 0 0 0 0 0 − − CO2 ppm 425 289 296 320 288 279 100 0 CO ppm 0.03 2 1.65 0.38 1.24 1.96 0 100 H2S ppm 0.008 0.01 0.01 0.01 0.01 0.01 0 100 VOC ppm 8.53 0.75 0.58 1.19 1.04 1.92 100 0 Ozone ppm N/A 0.05 0.05 0.06 0.06 0.05 − − NH3 ppm No limit < 0.001 < 0.001 < 0.001 < 0.001 < 0.001 − − CH4 ppm 250 < 0.001 < 0.001 < 0.001 < 0.001 < 0.001 − − Table 4.
Outcome of ambient air and noise quality at Delta state.
-
Variables Unit Sites Limits Compliant status (%) 1 2 3 FEPA WHO USEPA NIS EU Compliant Non-within pH 7.08 7.09 7.07 6.5−8.5 6.5−8.5 100 0 Conductivity µs/cm 1,694.9 1,695.0 1,695.1 1,000 − 1,000 1,000 2,500 0 100 Calcium mg/l 109.1 108.9 109.2 − 75 0 100 Phosphate mg/l 1.01 1.00 1.00 < 5.0 − − NS − 100 0 Ammonia mg/l 0.48 0.47 0.49 0.05 0 100 TSS mg/l 0.09 0.08 0.10 < 10 − − NS − 100 0 Temperature °C 25.4 25.5 25.3 Ambient 100 0 Turbidity NTU 0.01 0.02 0.01 5 5 5 5 − 100 0 Total acidity mg/l 61.4 61.3 61.4 NS − TDS mg/l 847.2 847.4 847.3 500 − 500 500 − 0 100 Total hardness mg/l 272.4 272.3 272.4 200 80-100 − 150 − 0 100 Total alkalinity mg/l 408.4 408.2 408.3 − − − 200 − 0 100 Total solids mg/l 1,039.9 1,040.2 1,040.3 NS − Magnesium mg/l 39.8 39.7 39.8 20 0 100 Sodium mg/l 10.7 10.8 10.6 200 100 0 Chloride mg/l 26.8 26.9 26.7 250 250 250 250 250 100 0 DO mg/l 2.07 2.06 2.07 2 0 100 Nitrite mg/l 0.13 0.14 0.12 0.2 100 0 Manganese mg/l 0.23 0.22 0.21 0.2 0 100 Total iron mg/l < 0.01 < 0.01 < 0.01 0.3 100 0 Sulphate mg/l 50.2 50.3 50.1 500 250 250 250 250 100 0 Silica mg/l 3.93 3.94 3.92 40 100 0 Salinity % 0.09 0.08 0.07 NS − Nitrate mg/l <0.01 <0.01 <0.01 50 50 50 50 50 100 0 Total oil/grease mg/l 0.08 0.09 0.10 10 100 0 Colour TCU 15 100 0 Appearance Colourless Colourless Odour Objectionable Unobjectionable Taste Objectionable Unobjectionable Table 5.
Outcome of water attributes.
-
Parameter Unit Site 1 Site 2 Site 3 Mean Limit EC mS 0.87 0.63 0.74 0.74 pH 7.47 7.90 8.21 7.87 6−9 TOC % 2.12 1.72 2.39 2.08 R/POL mV −167.8 −181.2 −298.8 −215.93 Salinity Psu 0.04 0.03 0.04 0.04 Cl mg/kg 236.38 165.74 201.06 201.07 100 CO3 mg/kg < 0.01 < 0.01 < 0.01 < 0.01 T/N % 0.09 0.06 0.08 0.08 10 PO4 mg/kg 1.84 1.29 1.58 1.59 SO4 mg/kg 11.30 7.93 9.61 9.62 100 NO3 mg/kg 2.11 1.48 1.65 1.76 NO2 mg/kg 0.35 0.25 0.27 0.28 NH4 mg/kg 1.15 0.81 0.90 0.95 Na mg/kg 53.27 37.35 45.31 45.31 K mg/kg 16.87 11.82 14.33 14.34 Ca mg/kg 93.93 65.87 79.70 79.71 Mg mg/kg 24.23 16.99 20.61 20.62 1.0 THC mg/kg < 0.01 < 0.01 < 0.01 < 0.01 TPH mg/kg < 0.001 < 0.001 < 0.001 < 0.001 BTEX mg/kg < 0.001 < 0.001 < 0.001 < 0.001 Phenol mg/kg < 0.001 < 0.001 < 0.001 < 0.001 PAH mg/kg < 0.001 < 0.001 < 0.001 < 0.001 THB cfu/g 5.78 4.74 5.12 5.22 THP cfu/g 1.56 1.28 1.38 1.41 HUB cfu/g 2.83 2.33 2.54 2.56 HUF cfu/g 0.65 0.54 0.58 0.59 Fe mg/kg 506.69 355.26 130.97 330.98 1.0 SKB cfu/g 1.97 1.6 1.74 1.78 Cu mg/kg < 0.001 < 0.001 < 0.001 < 0.001 Cr mg/kg 0.64 0.45 < 0.001 0.25 Pb mg/kg 0.12 0.09 < 0.001 0.10 Cu mg/kg 92.68 50.96 61.82 68.50 1.0 Ni mg/kg 4.82 3.45 < 0.001 4.14 V mg/kg < 0.001 < 0.001 < 0.001 < 0.001 Zn mg/kg 265.62 186.24 37.23 163.03 5.0 Hg mg/kg < 0.001 < 0.001 < 0.001 < 0.001 Ba mg/kg < 0.001 < 0.001 < 0.001 < 0.001 Table 6.
Outcome of physicochemical characteristics of sediments within the study vicinity.
-
Parameters Unit Sites 1 2 3 4 5 6 7 8 Limit Sand % 41.2 34.7 46.3 41.1 86.4 86.3 37.3 33.8 Silt % 37.3 40.9 36.8 37.5 6.8 6.3 43.1 42.7 Loam % 21.4 24.4 17.7 21.4 4.8 7.4 19.6 23.3 pH 6.9 7.55 6.22 6.12 6.01 5.99 5.76 6.00 6.5−8.5 EC mS 0.17 0.09 0.08 0.06 0.05 0.01 0.09 0.07 TOC % 2.87 2.38 2.64 2.16 0.64 0.47 3.05 2.47 T/N % 0.07 0.06 0.06 0.05 0.01 0.01 0.07 0.06 NO3 mg/kg 13.34 7.07 6.27 4.70 3.92 2.35 7.12 4.66 NO2 mg/kg 1.82 0.91 0.79 0.59 0.49 0.30 0.92 0.58 NH4 mg/kg 6.94 3.58 3.11 2.33 1.94 11.7 3.55 2.38 Na mg/kg 5.71 2.96 2.62 1.97 0.84 0.50 3.02 1.97 28.0 K mg/kg 1.34 0.67 0.58 0.44 0.36 0.22 0.71 0.45 0.05 Ca mg/kg 13.8 7.28 6.45 4.84 1.03 0.62 7.31 4.85 Mg mg/kg 44.49 23.40 20.78 15.38 6.99 4.19 23.55 15.60 THB cfu/g 5.46 3.51 5.04 3.25 1.36 0.97 5.80 3.72 THF cfu/g 1.47 0.95 1.36 0.87 0.37 NO 1.36 1.08 HUB cfu/g 2.68 1.72 2.47 1.59 0.67 0.48 2.84 1.82 HUF cfu/g 0.61 0.39 0.67 0.37 NO NO 0.65 0.43 Fe mg/kg 1142 864.5 1719 1214 74 52.03 265.5 311 1.0 Cd mg/kg < 0.001 < 0.001 < 0.067 < 0.058 < 0.001 < 0.001 < 0.001 < 0.001 Cr mg/kg 2.48 1.96 2.30 1.57 < 0.001 < 0.001 2.78 2.32 Pb mg/kg <0 .001 < 0.001 < 0.001 < 0.001 < 0.001 < 0.001 < 0.001 < 0.001 Cu mg/kg 1.68 0.49 0.82 0.78 1.37 1.05 0.58 1.47 0.01 N mg/kg 3.83 2.96 2.19 1.76 < 0.001 < 0.001 < 0.001 < 0.001 V mg/kg < 0.001 < 0.001 < 0.001 < 0.001 < 0.001 < 0.001 < 0.001 < 0.001 Zn mg/kg 3.83 2.65 3.43 2.47 0.27 0.17 3.90 3.21 0.1 Texture Loam Loam Loam Loam Loam Loam Loam Loam Table 7.
Outcome of soil properties within the study vicinity.
-
Age
(months)Mean weight
(kg)Mean height
(m)Weight for age
(normal range) (kg)0−11 6.72 0.55 3.5−9.5 12−23 9.18 0.77 9.6−12.3 24−35 11.46 0.91 12.6−14.5 36−47 12.61 0.95 14.6−17.5 48−60 13.97 1.03 17.6−19.5 Table 8.
Weight and height of the populace in the studied community.
-
Local names Botanical names Medicinal uses Alligator pepper plant Afromomum melegueta Sore throat, malaria,
purgativeBanana plant Musa spp. Fever treatment Lemon orange Citrus aurantium Abdominal upset and a base
for other treating malariaPawpaw leaves Carica papaya Malaria treatment Cashew fruit, leaf & bark Amarcadium occidentale Malaria treatment Guava tree leaves & bark Psidium guajava Treatment of malaria,
diarrhoea & menstrual disordersTable 9.
Common medicinal plants and their uses in the region.
-
Environmental components Indicator parameters Frequency Responsibility Soil pH, salinity, heavy metals, TPH etc. Monthly HSE/Regulator Air quality, noise and Vibration SO2, NO2, CO, VOC, particulate etc. Weekly HSE/Regulator Surface/ground water quality pH, nutrients content, BOD, suspended solids, hydrocarbon Monthly HSE/Regulator Vegetation Diversity and abundance of flora and fauna, endangered species Quarterly HSE/Regulator Common health Contagion diseases within the host communities Quarterly Oil & gas medical officer Components Techniques Responsibility Evidence Solid waste Excavation waste should be reused or backfilled. The site should have waste receptacles With bulk storage facilities at convenient Points to prevent littering. Management Presence of well-maintained eceptacles and central collection point. Security Control of secondary businesses
Round the clock security
Adequate lighting and an alarm
System installed at strategic pointsContractor & Management Number of business around the site and level of crime in the region. First Aid Maintaining of well-stocked first aid kit by qualified personnel Management Contents of the first aid kit Table 10.
Monitoring programme for environmental matrices (components).
-
Environmental Proposed mitigation measures Monitoring indicator Air contagion Control speed and operation of vehicles, prohibit idling of vehicles, spray water on dusty areas. Workers should be provided with dust masks when working in sensitive regions. Amount of dust produced and level Noise contagion Maintain plant equipment Workers to wear ear muffs if working in noisy sections. Noise should be kept within reasonable Amount of noise Soil erosion & compaction Provide soils conservation structures on the areas prone to soil. There should be designated pathways and driveways for movement. Paved and landscaped areas Table 11.
Impacts and proposed mitigation measures.
-
Consequence Increasing probability A B C D E Severity People Asset damage Environmental
effectReputation Never heard of
in the industryHas occurred in the industry Incident has occurred in Happens several times/year Happens several times/year 0 No injury None None None Low risk 1 Slight injury Slight Slight Slight 2 Minor injury Minor Minor Limited 3 Major Injury Localised Localised Considerable Medim risk 4 Single fatality Major Major National 5 Multiple fatalities Extensive Massive International High risk Table 12.
Probability trends and impact consequences on the Delta populace.
Figures
(12)
Tables
(12)