-
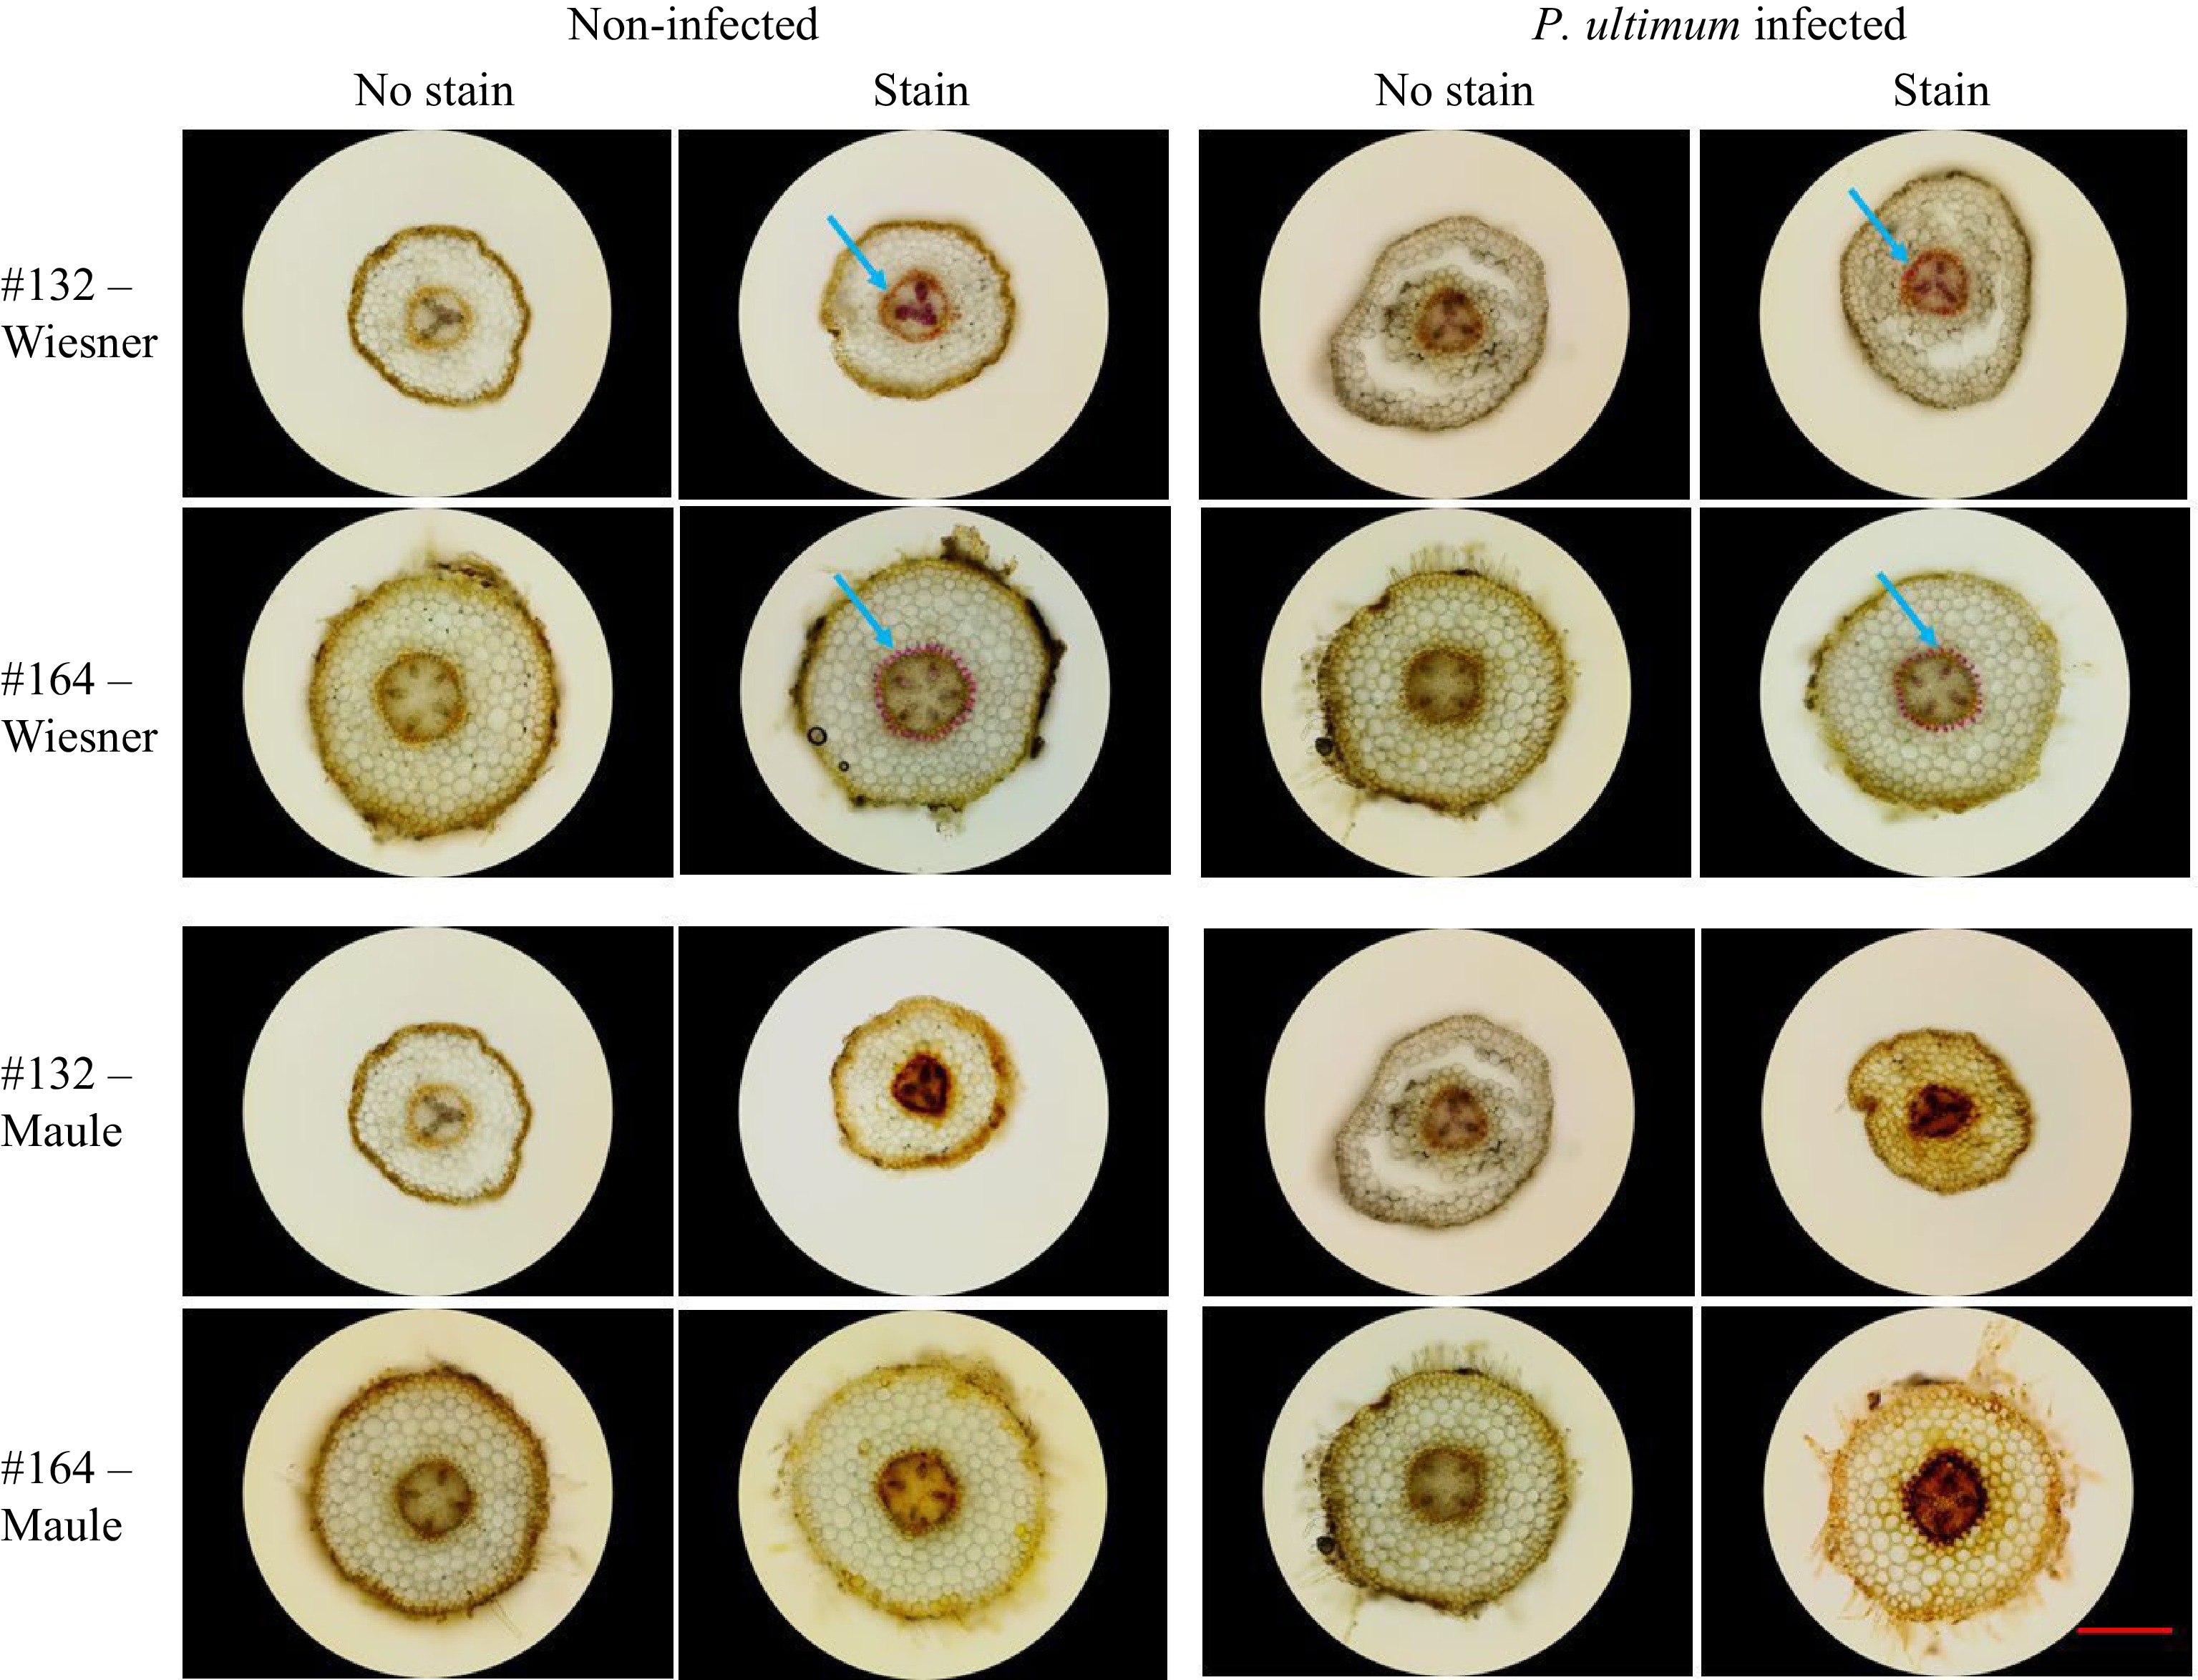
Figure 1.
Brightfield images of detected lignin deposition in apple roots. The top two rows are images from the Wiesner test, and the bottom two rows are from the Maule test. Two apple rootstock genotypes were included: the susceptible #132 and the resistant #164 each of which was infected vs mock-infected with P. ultimum. Each image is a representative of roots from three plants. The red bar represents 500 µm.
-
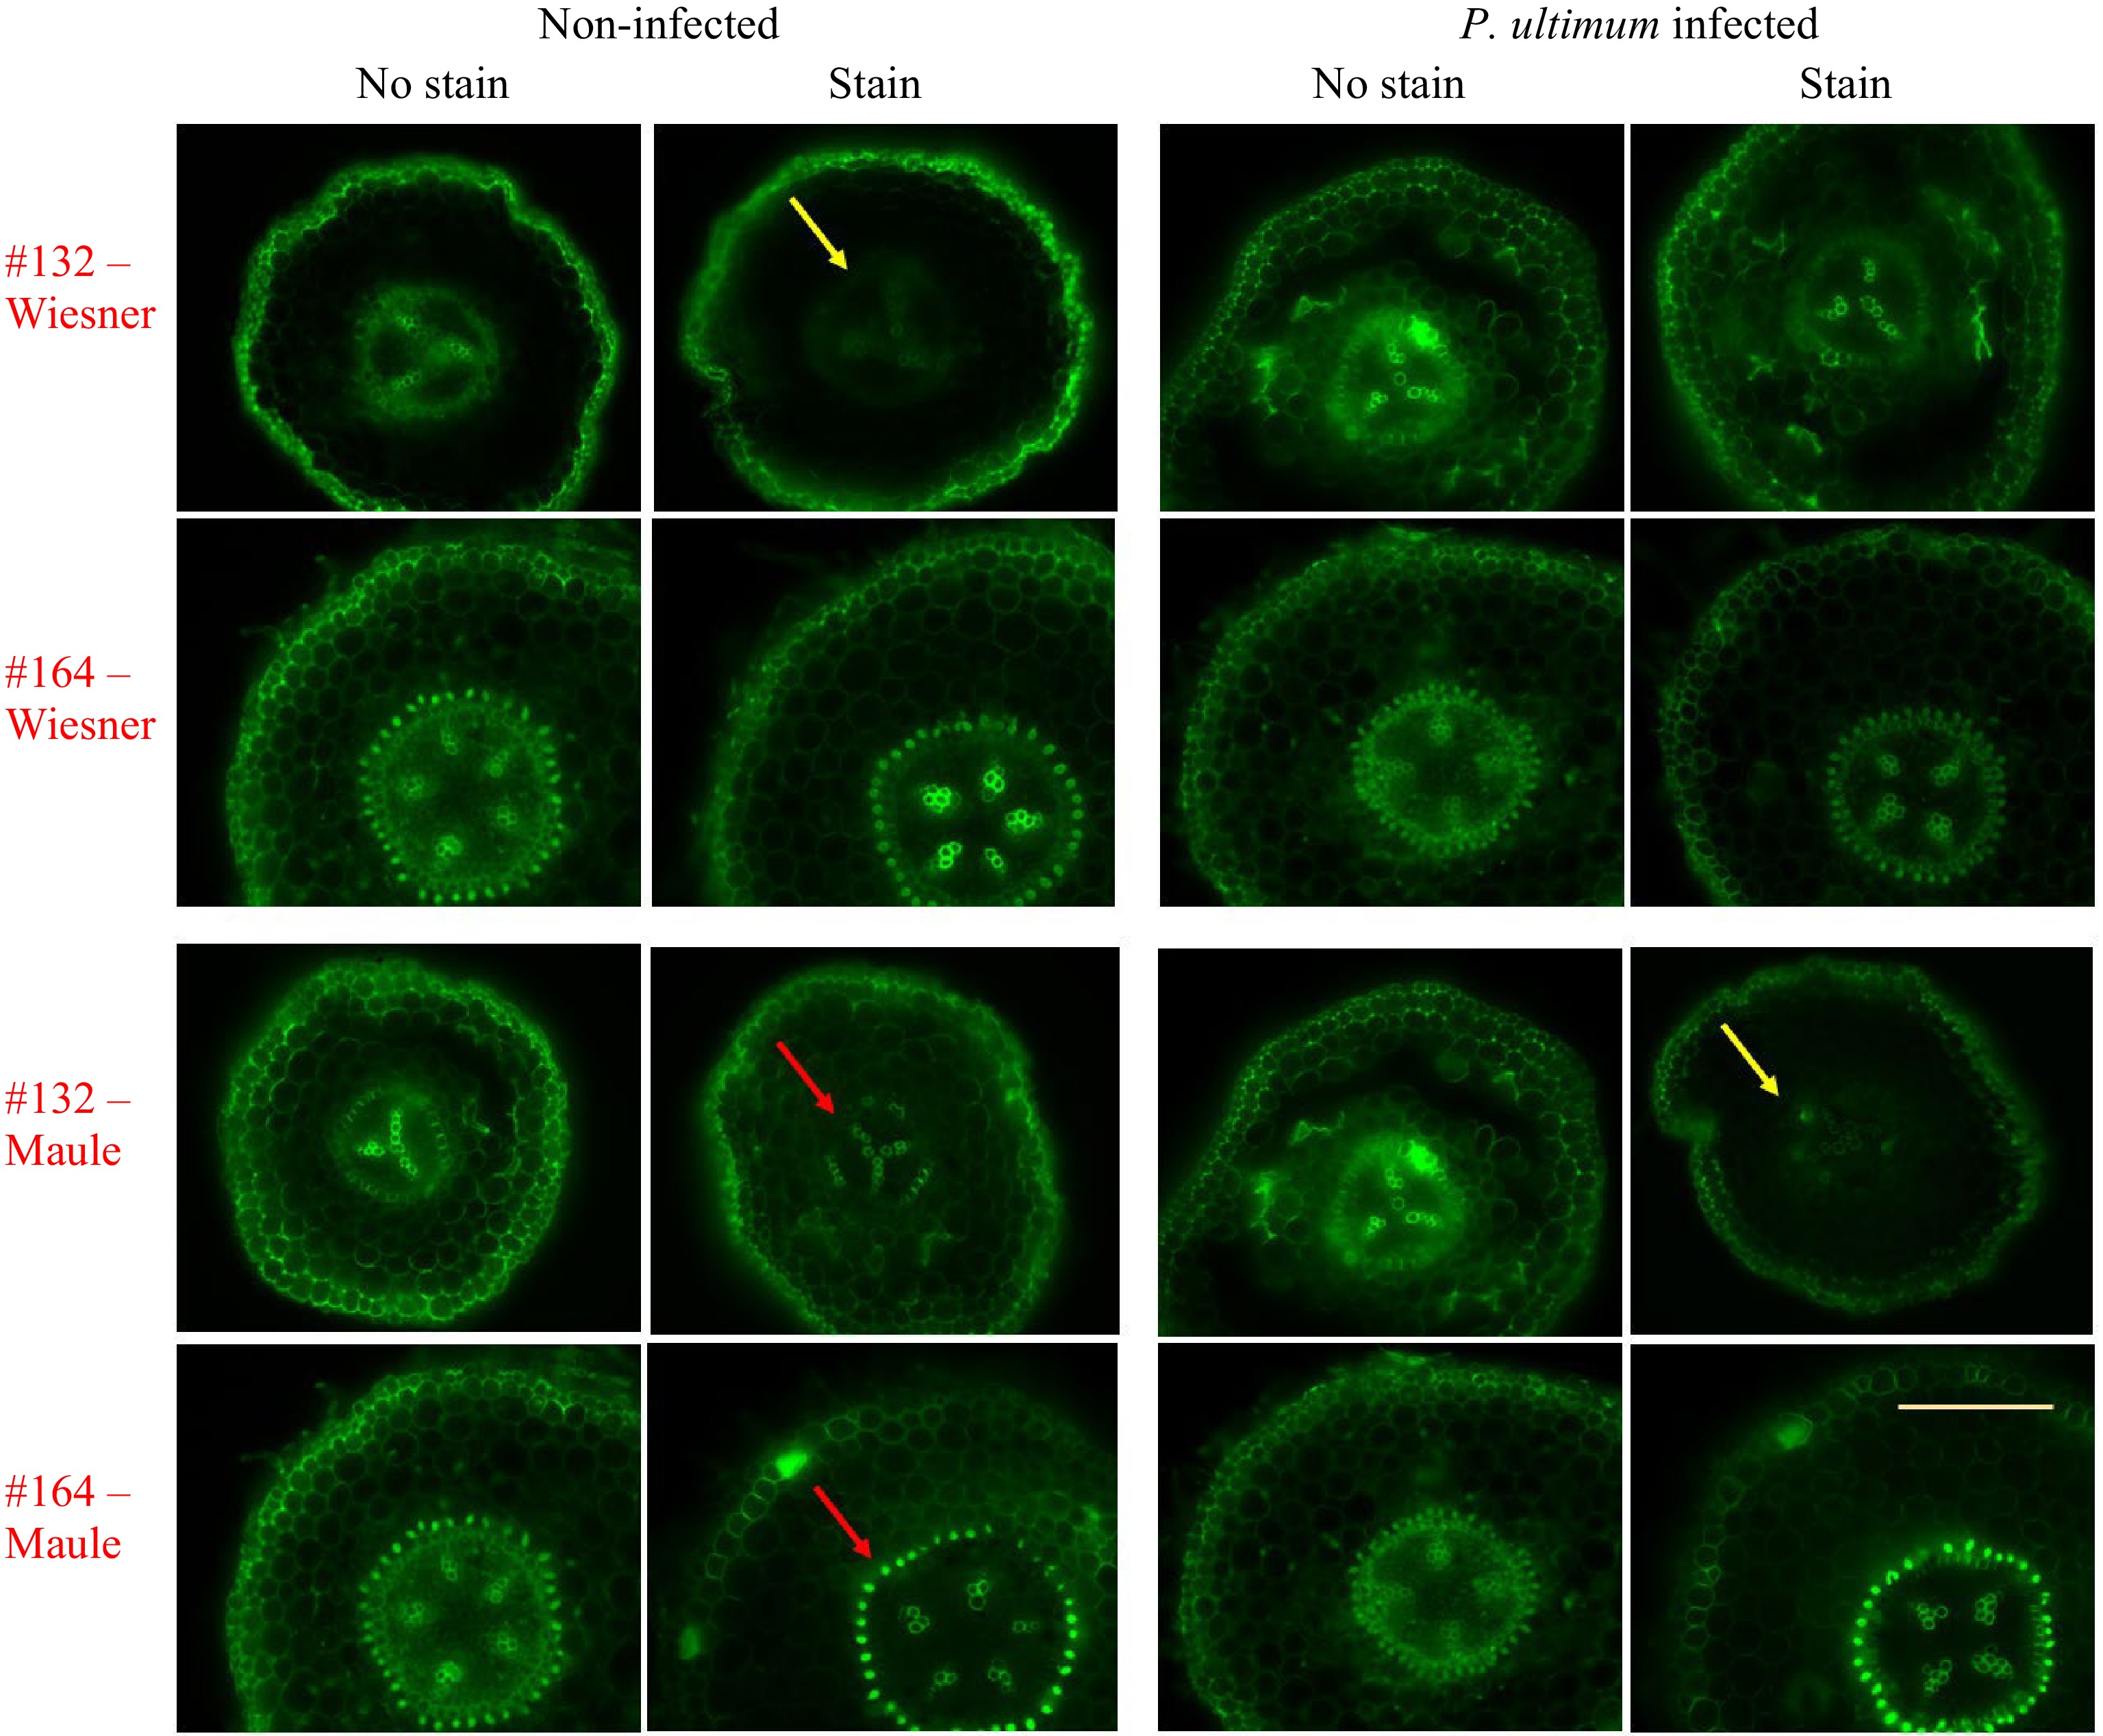
Figure 2.
Fluorescence images indicating lignin deposition in apple roots. The top two rows show sections from the Wiesner test, and the bottom two rows are those sections from the Maule test. Two apple rootstock genotypes were included: the susceptible #132 and the resistant #164. Each image is a representative of roots from three plants. The yellow bar represents 500 µm. Ex. 470/40 nm, Em. 525/50 nm, Dm. 495 nm.
-

Figure 3.
DMACA staining of proanthocyanidin in cell walls of apple root and stem tissues. Top row shows sections from root tissue from #164. Absence of blue coloration indicates lack of proanthocyanidin accumulation in apple root tissues. Bottom shows two sections from apple leaf tissue. The blue color (red arrows) is present on both sides of the leaf as well as inside the main vascular bundle, suggesting the existence of proanthocyanidin in these locations. White bars represent 500 µm.
Figures
(3)
Tables
(0)