-
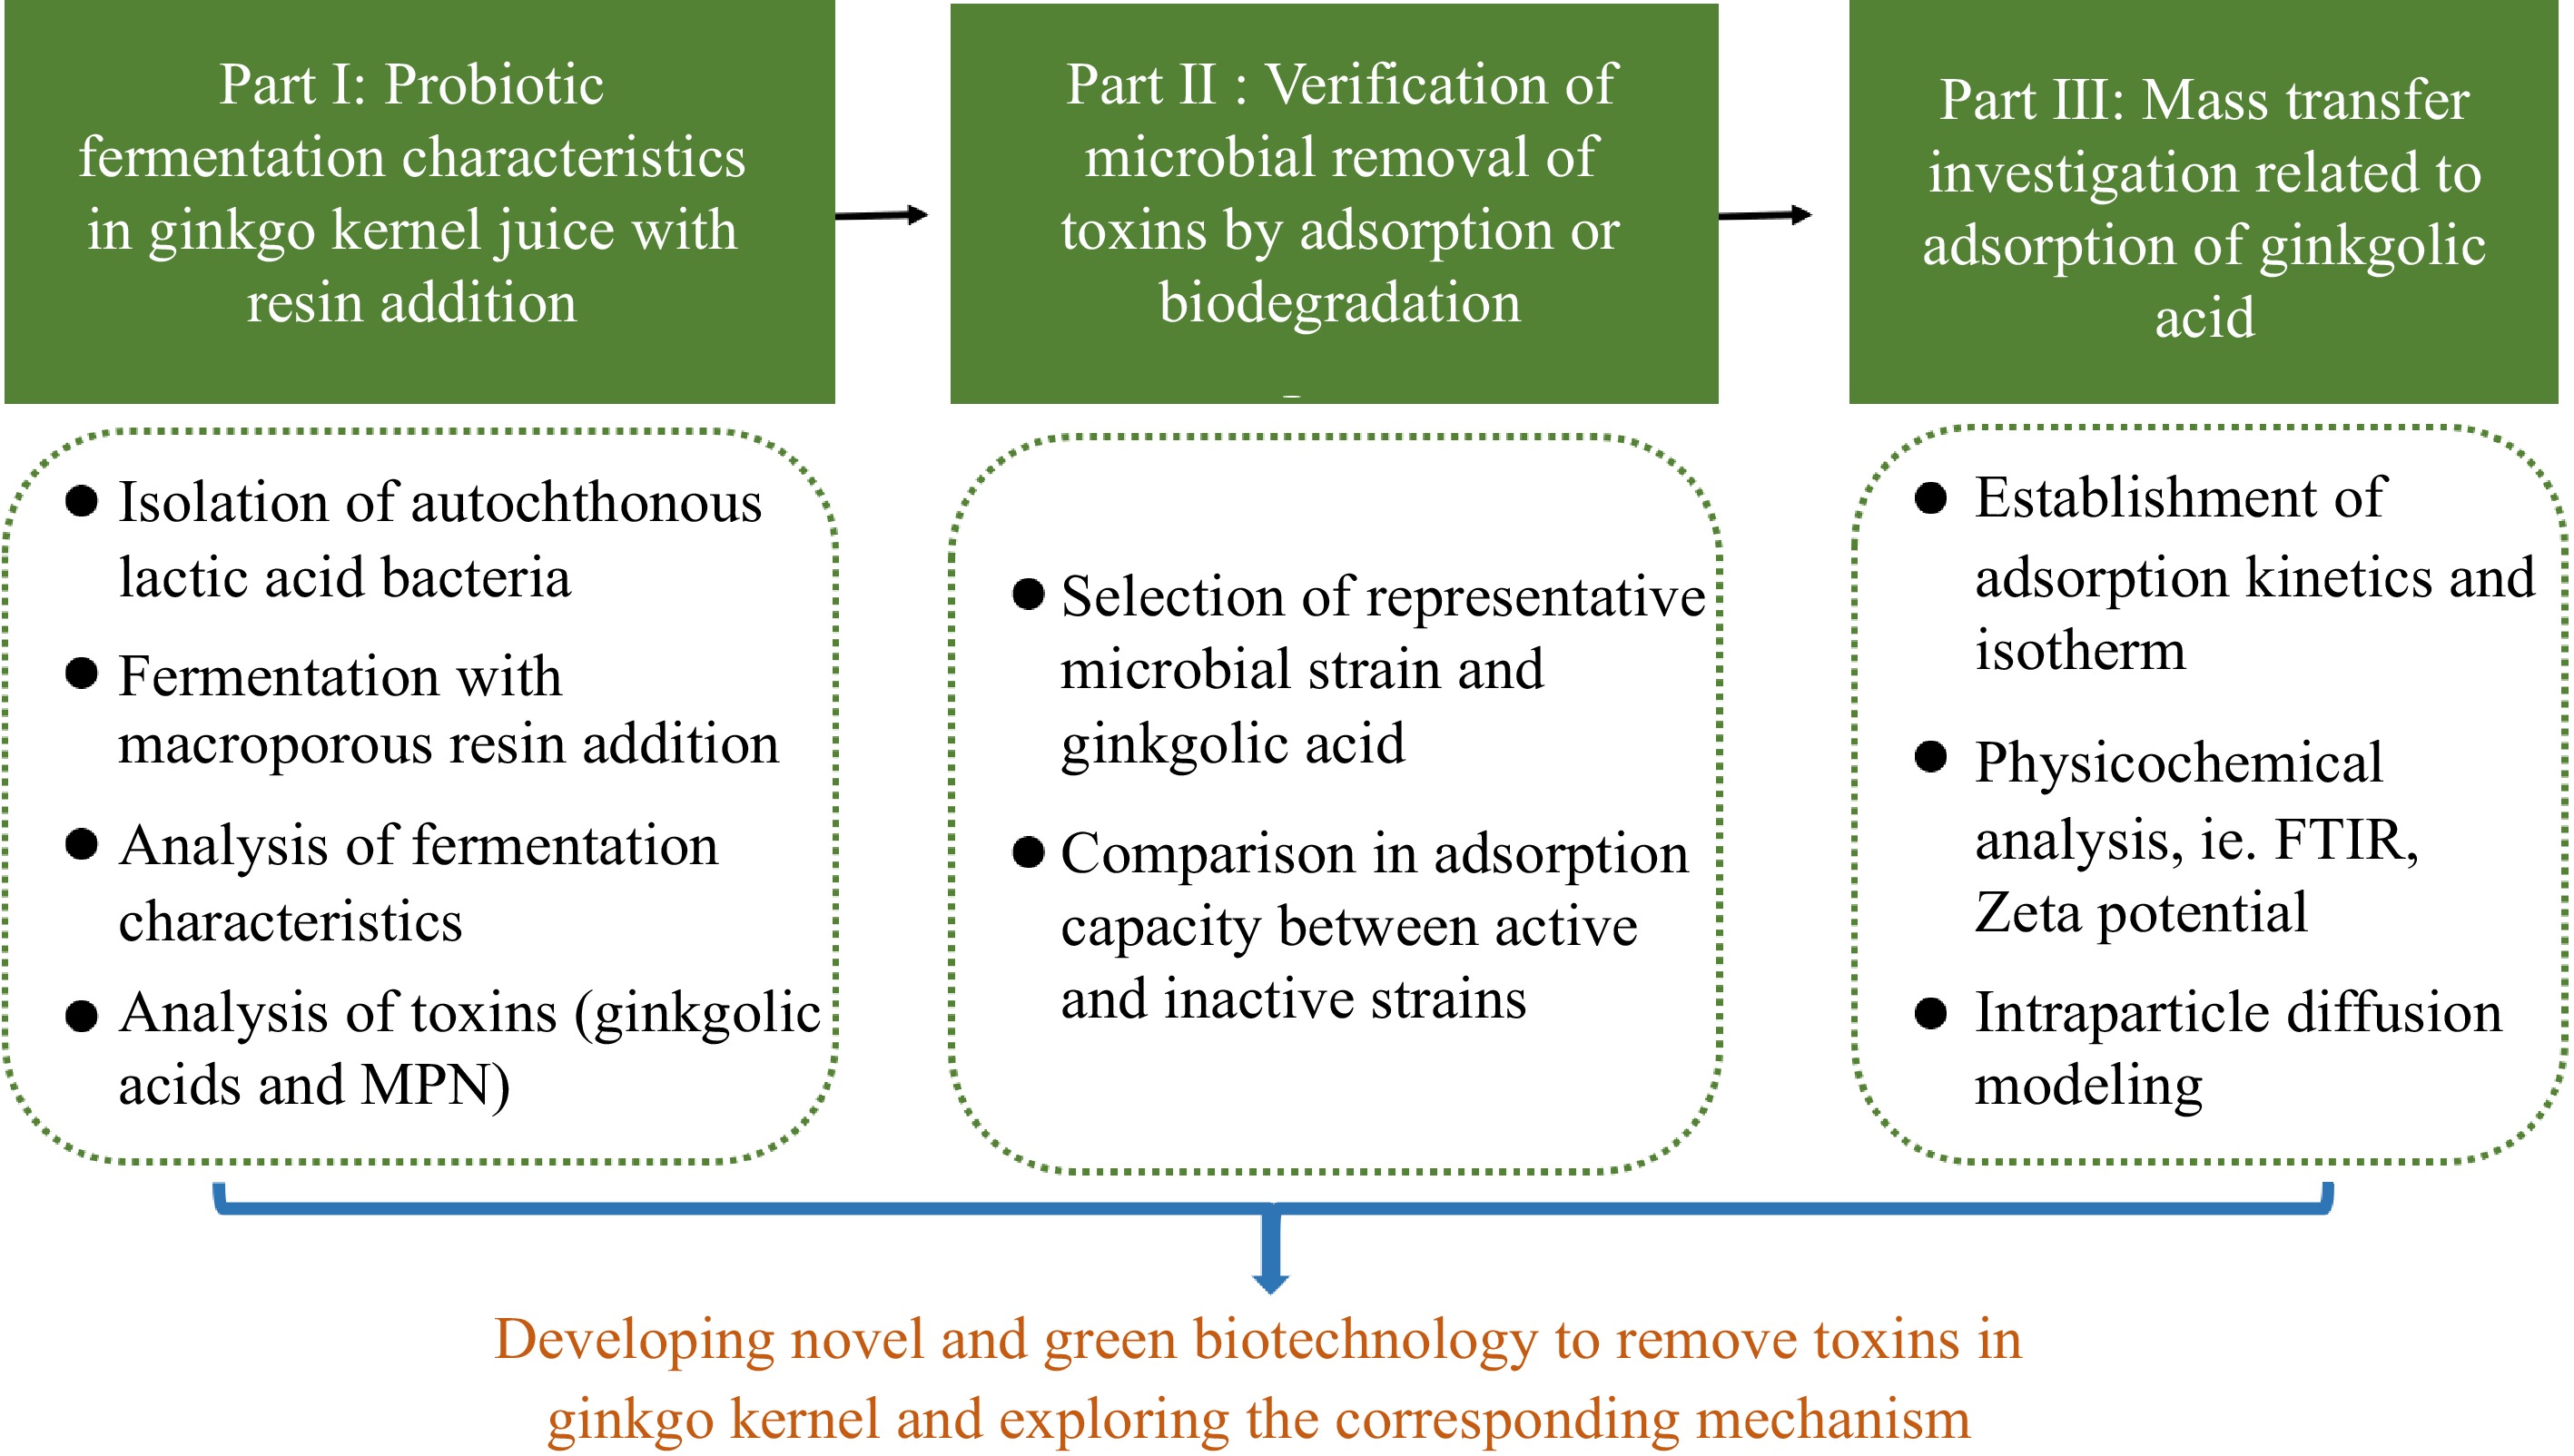
Figure 1.
Outline of this work illustrating investigations on the impact of probiotic fermentation combined with macroporous resin on eliminating toxic components in ginkgo kernel juice and exploring the underlying mechanism of toxin removal.
-
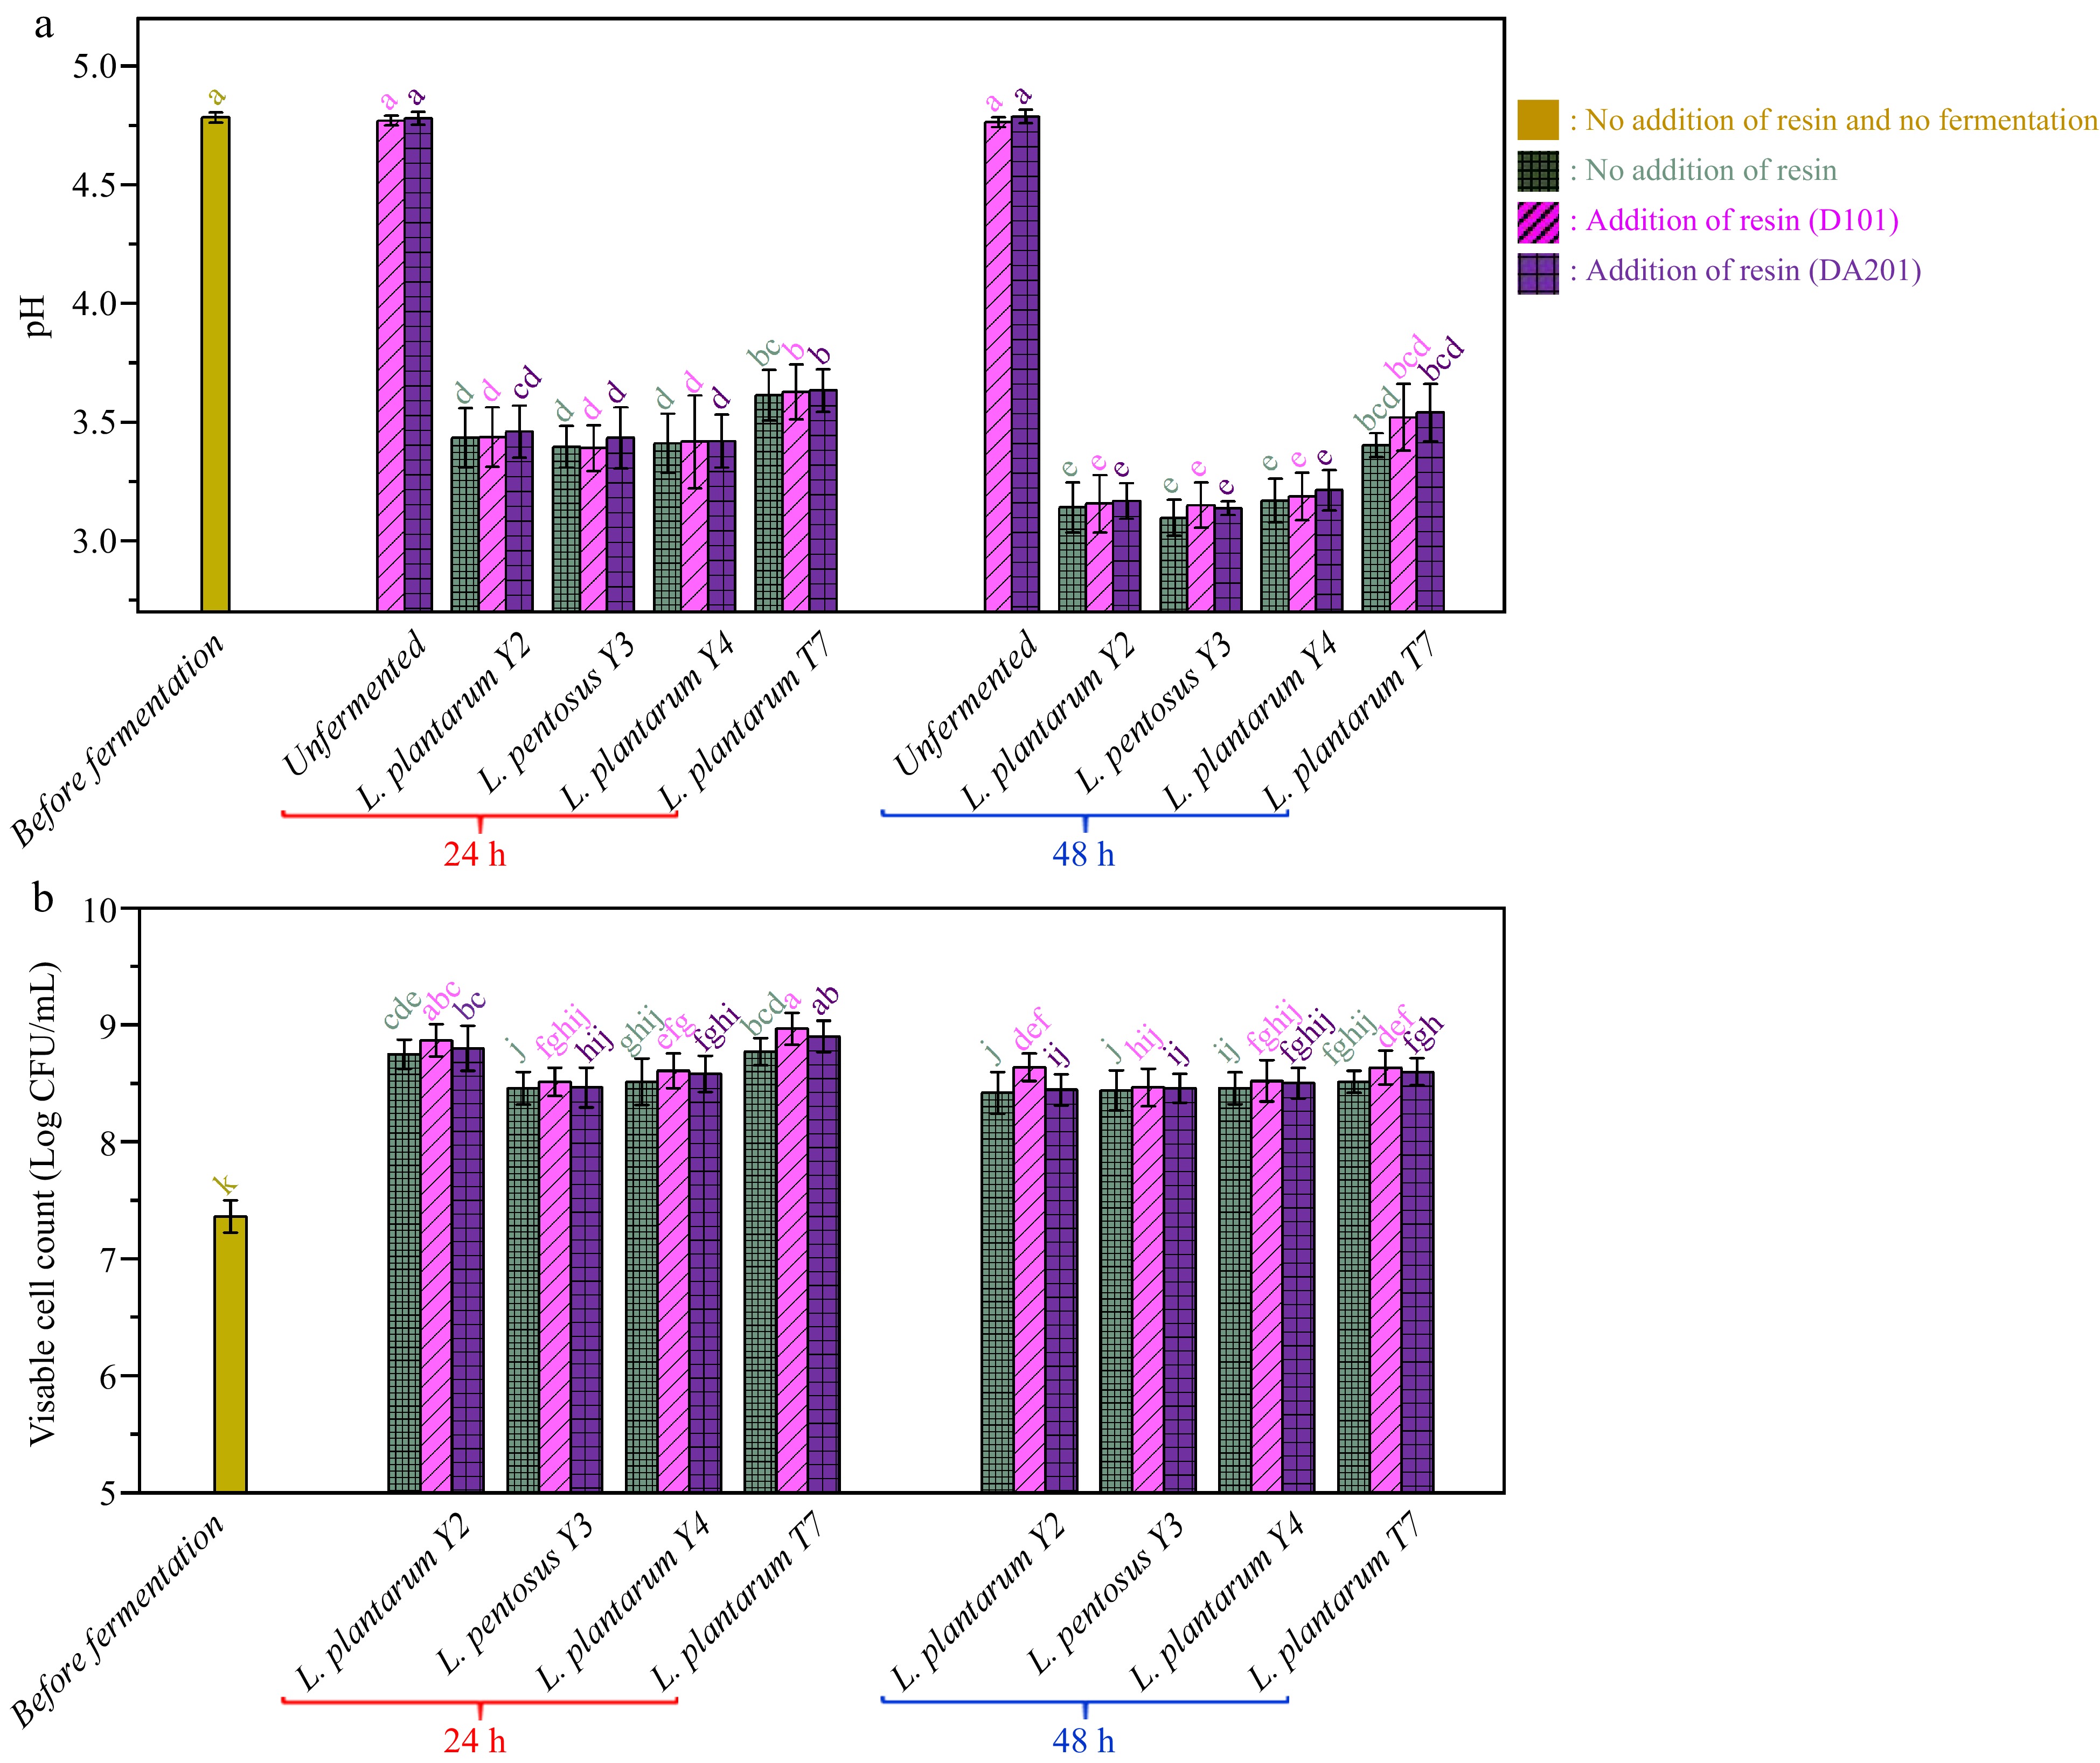
Figure 2.
(a) pH variations and (b) viable cell count changes during probiotic fermentation of ginkgo kernel juices with and without the addition of macroporous resin.
-
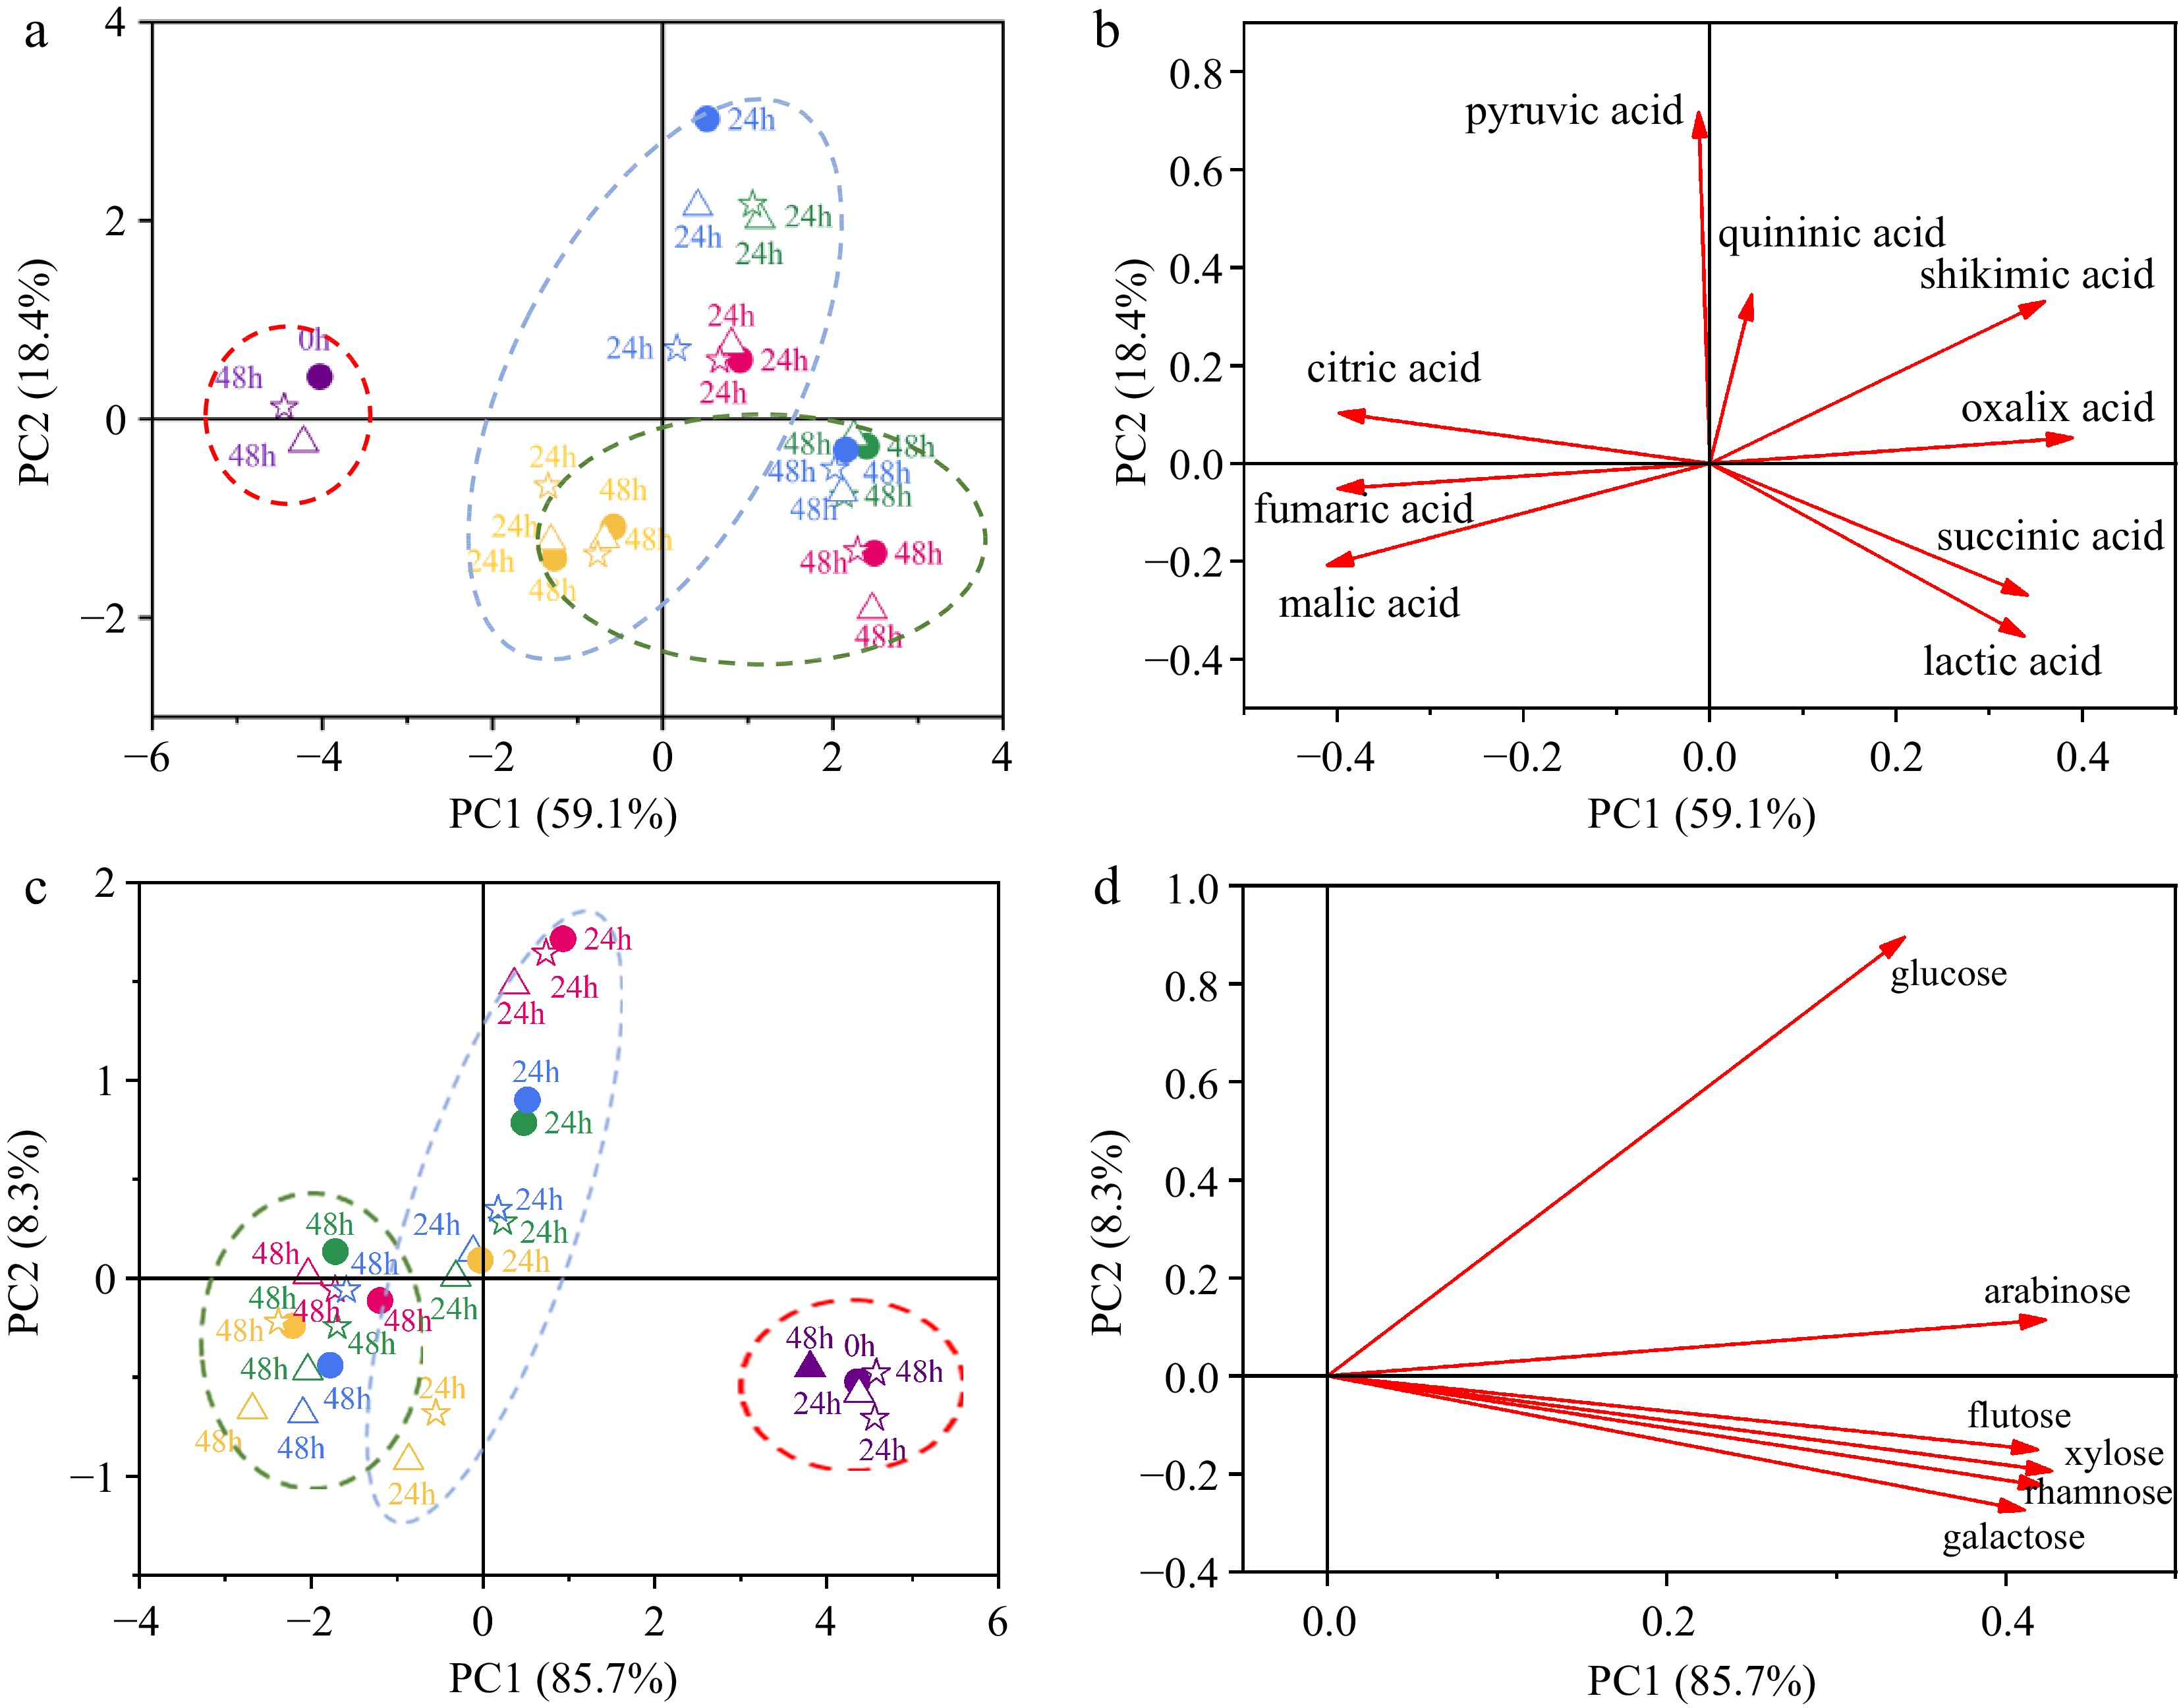
Figure 3.
Principal component analysis (PCA) conducted on the organic acid profile and monosaccharide profile during probiotic fermentation of ginkgo kernel juice, with and without the addition of macroporous resin. (a) Score plot based on the organic acid profile. (b) Loading plot based on the organic acid profile. (c) Score plot based on the monosaccharide profile. (d) Loading plot based on the monosaccharide profile. (●) Fermentation of samples without the addition of macroporous resin; (△) Fermentation of samples with the addition of macroporous resin D101; (☆) Fermentation of samples with the addition of macroporous resin DA201. Purple: unfermented samples; Red: fermentation of samples by L. plantarum Y2; Green: fermentation of samples by L. pentosus Y3; Blue: fermentation of samples by L. plantarum Y4; Yellow: fermentation of samples by L. plantarum T7.
-
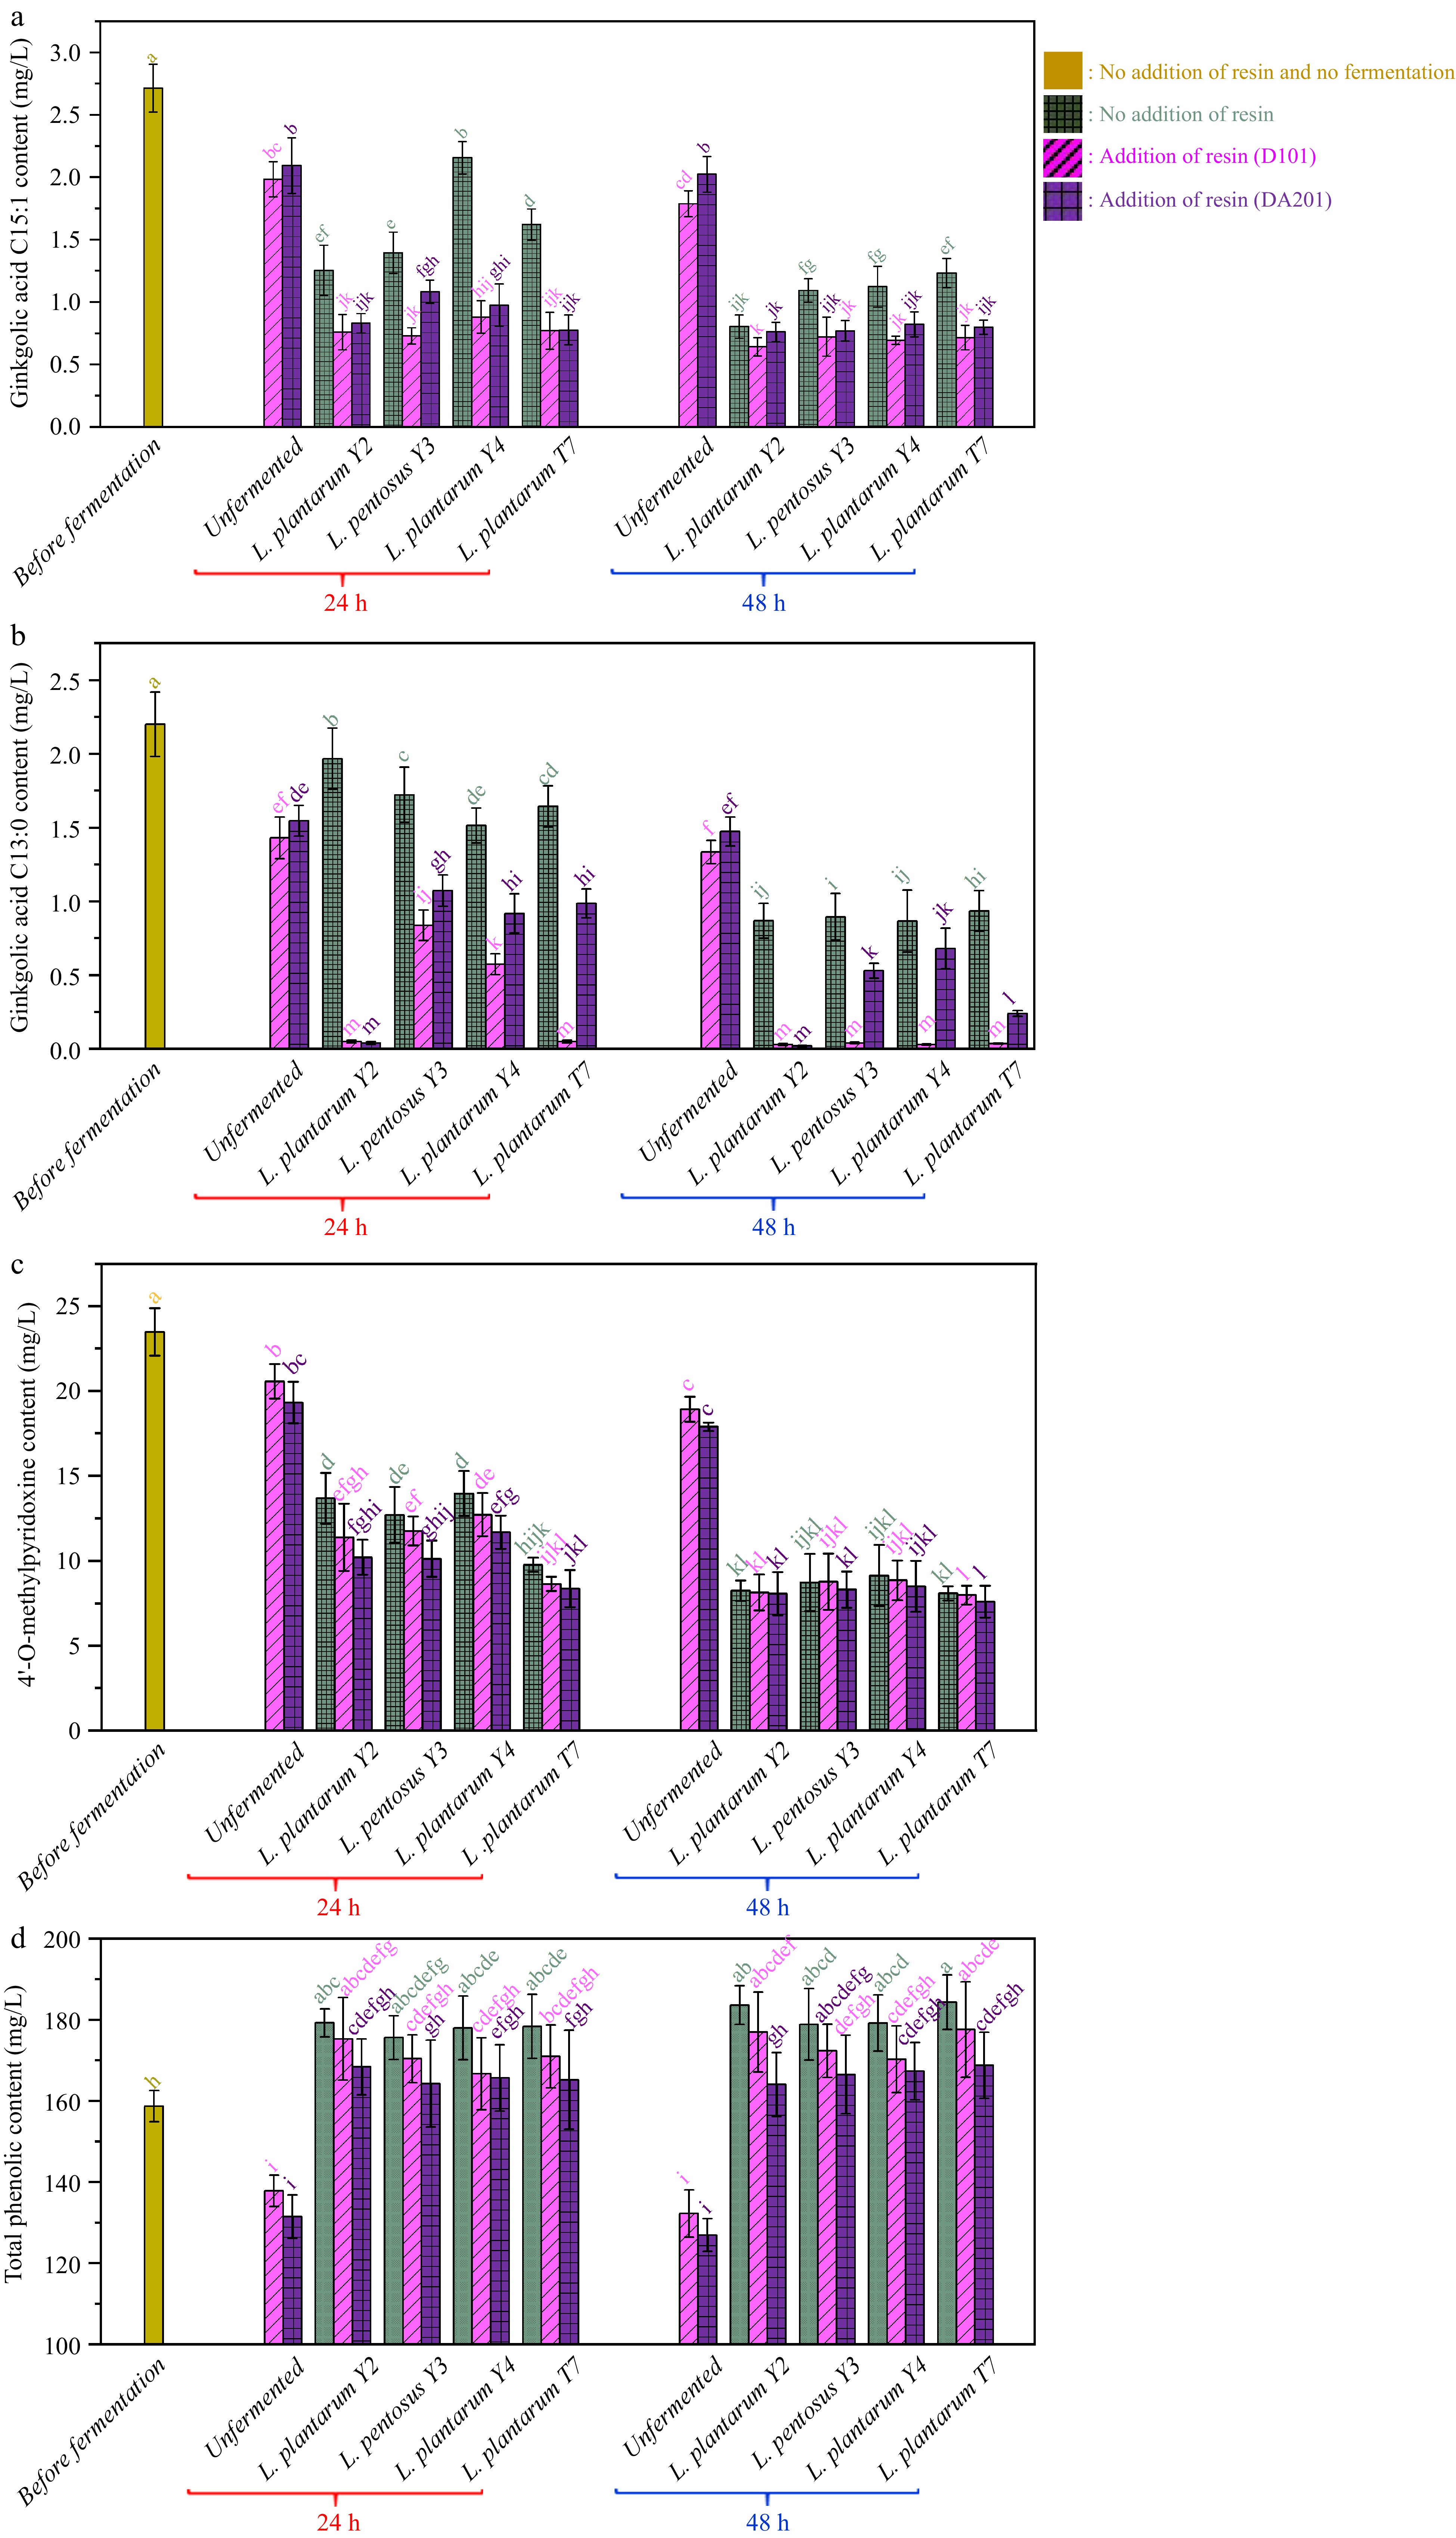
Figure 4.
Changes in the contents of (a) ginkgolic acid C15:1, (b) ginkgoic acid C13:0, (c) 4'-O-methylpyridoxine and (d) total phenolics during probiotic fermentation of ginkgo kernel juices with and without the addition of macroporous resin.
-

Figure 5.
(a) Changes in ginkgolic acid C15:1 content in the broths containing active and inactive L. plantarum Y2 and (b) amount of ginkgolic acid C15:1 desorbed from the microbial strains with previous adsorption.
-

Figure 6.
(a) Experimental and simulated adsorption kinetic curves and (b) adsorption isotherms of ginkgolic acid C15:1 by different adsorbents. The points represent the experimental data, and the solid lines represent the simulated results.
-
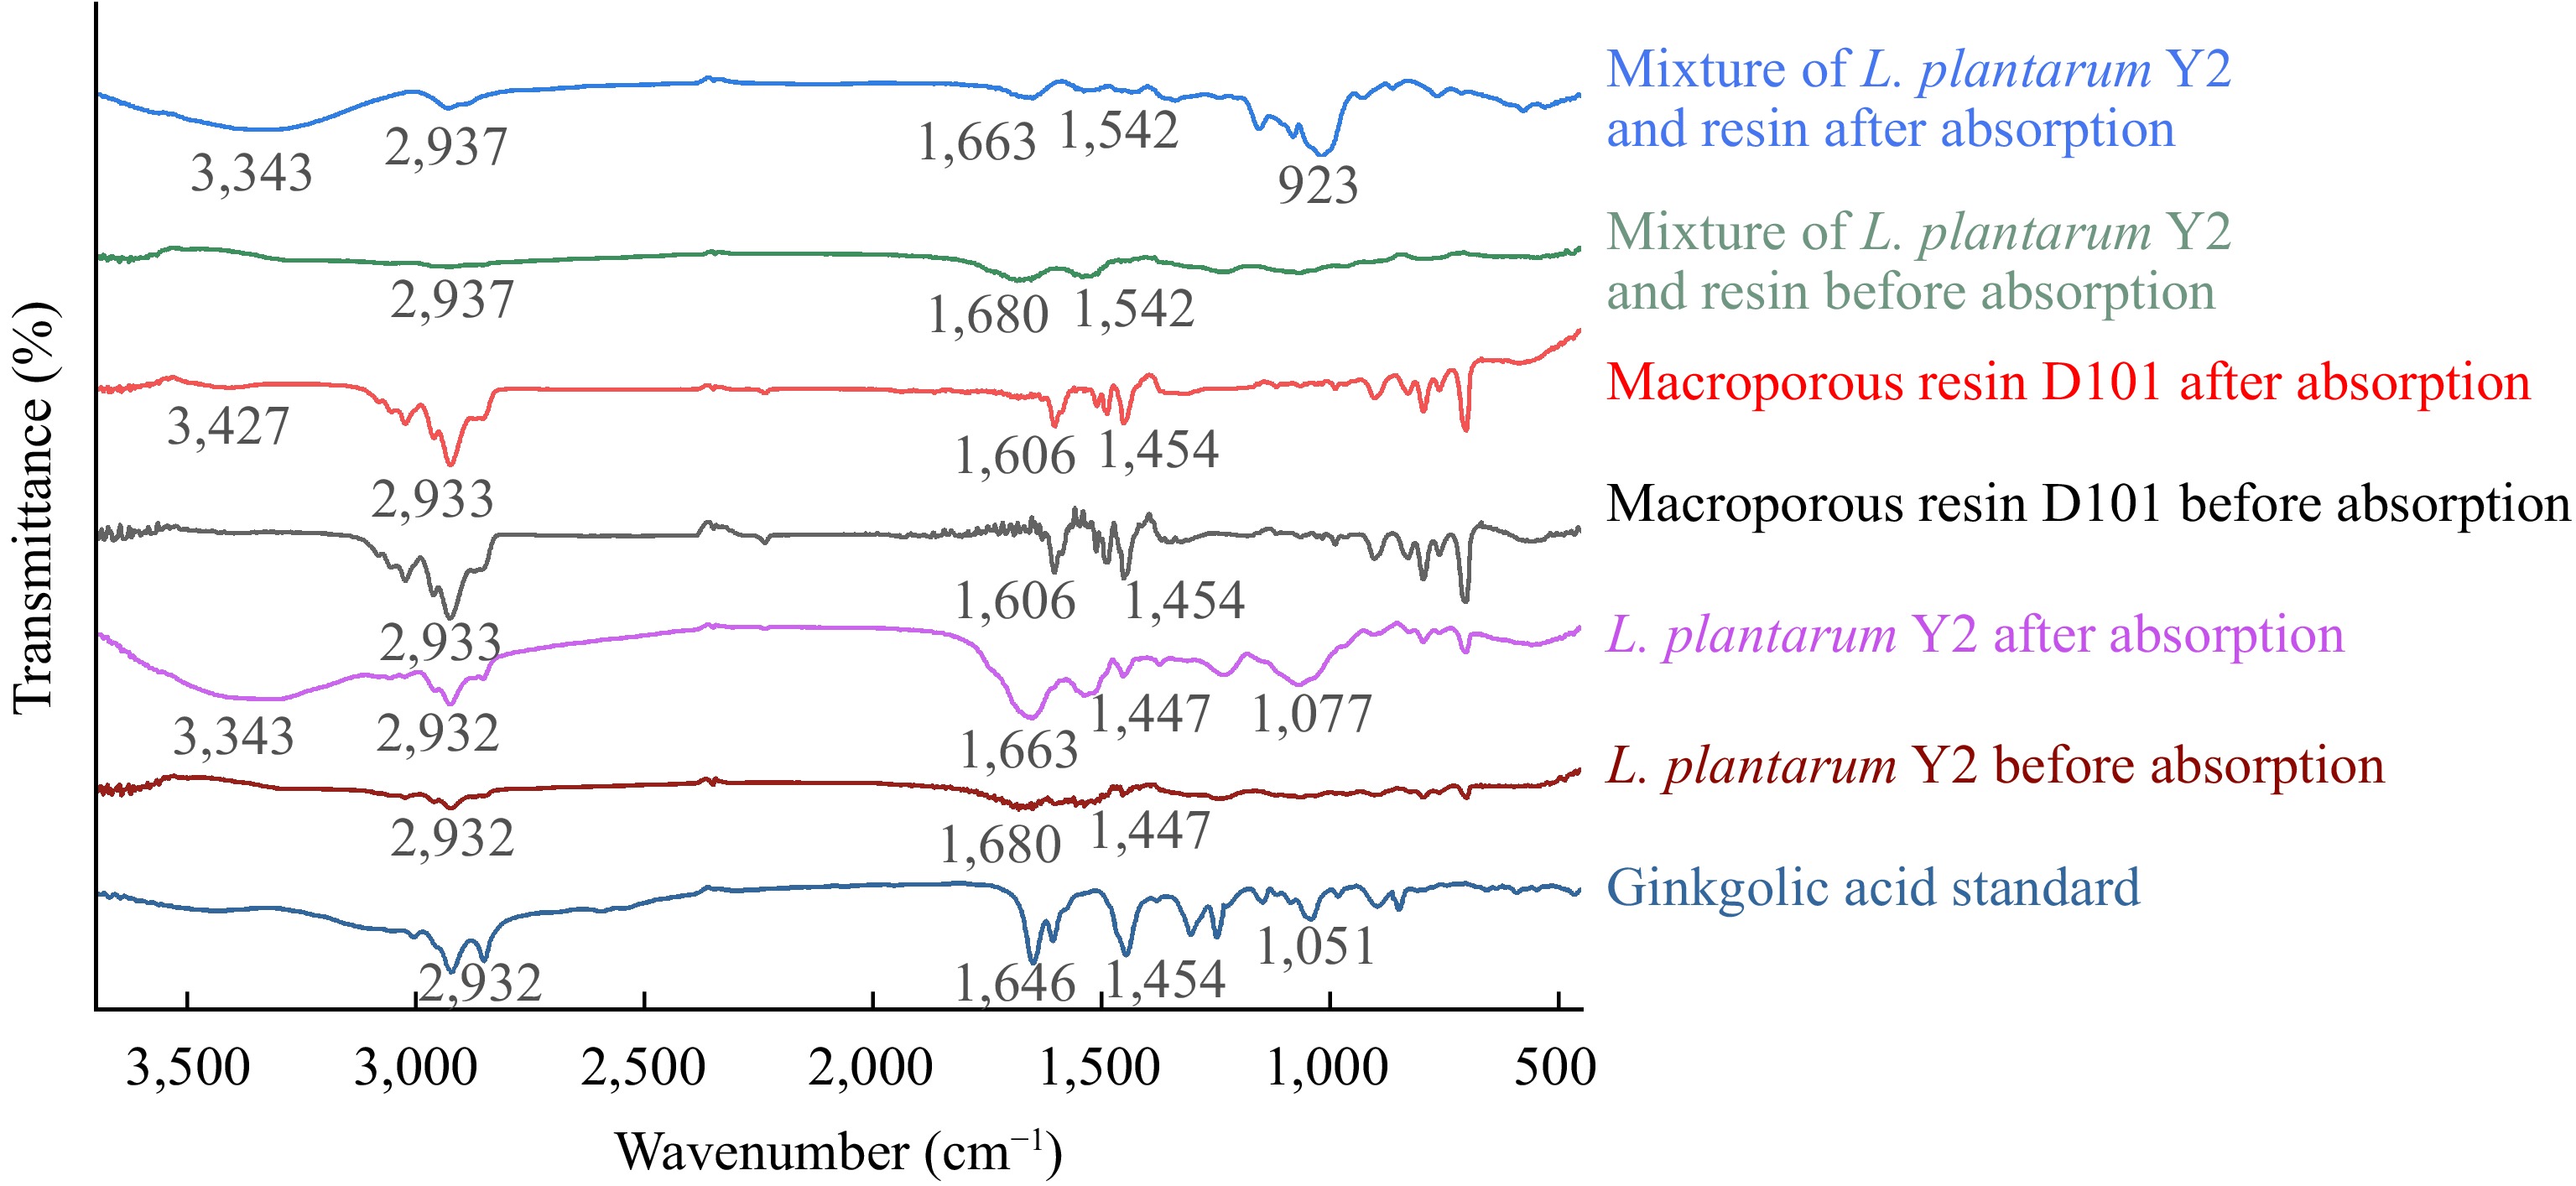
Figure 7.
FT-IR spectra of L. plantarum Y2, macroporous resin D101, and their mixture before and after the adsorption of ginkgolic acid C15:1.
-
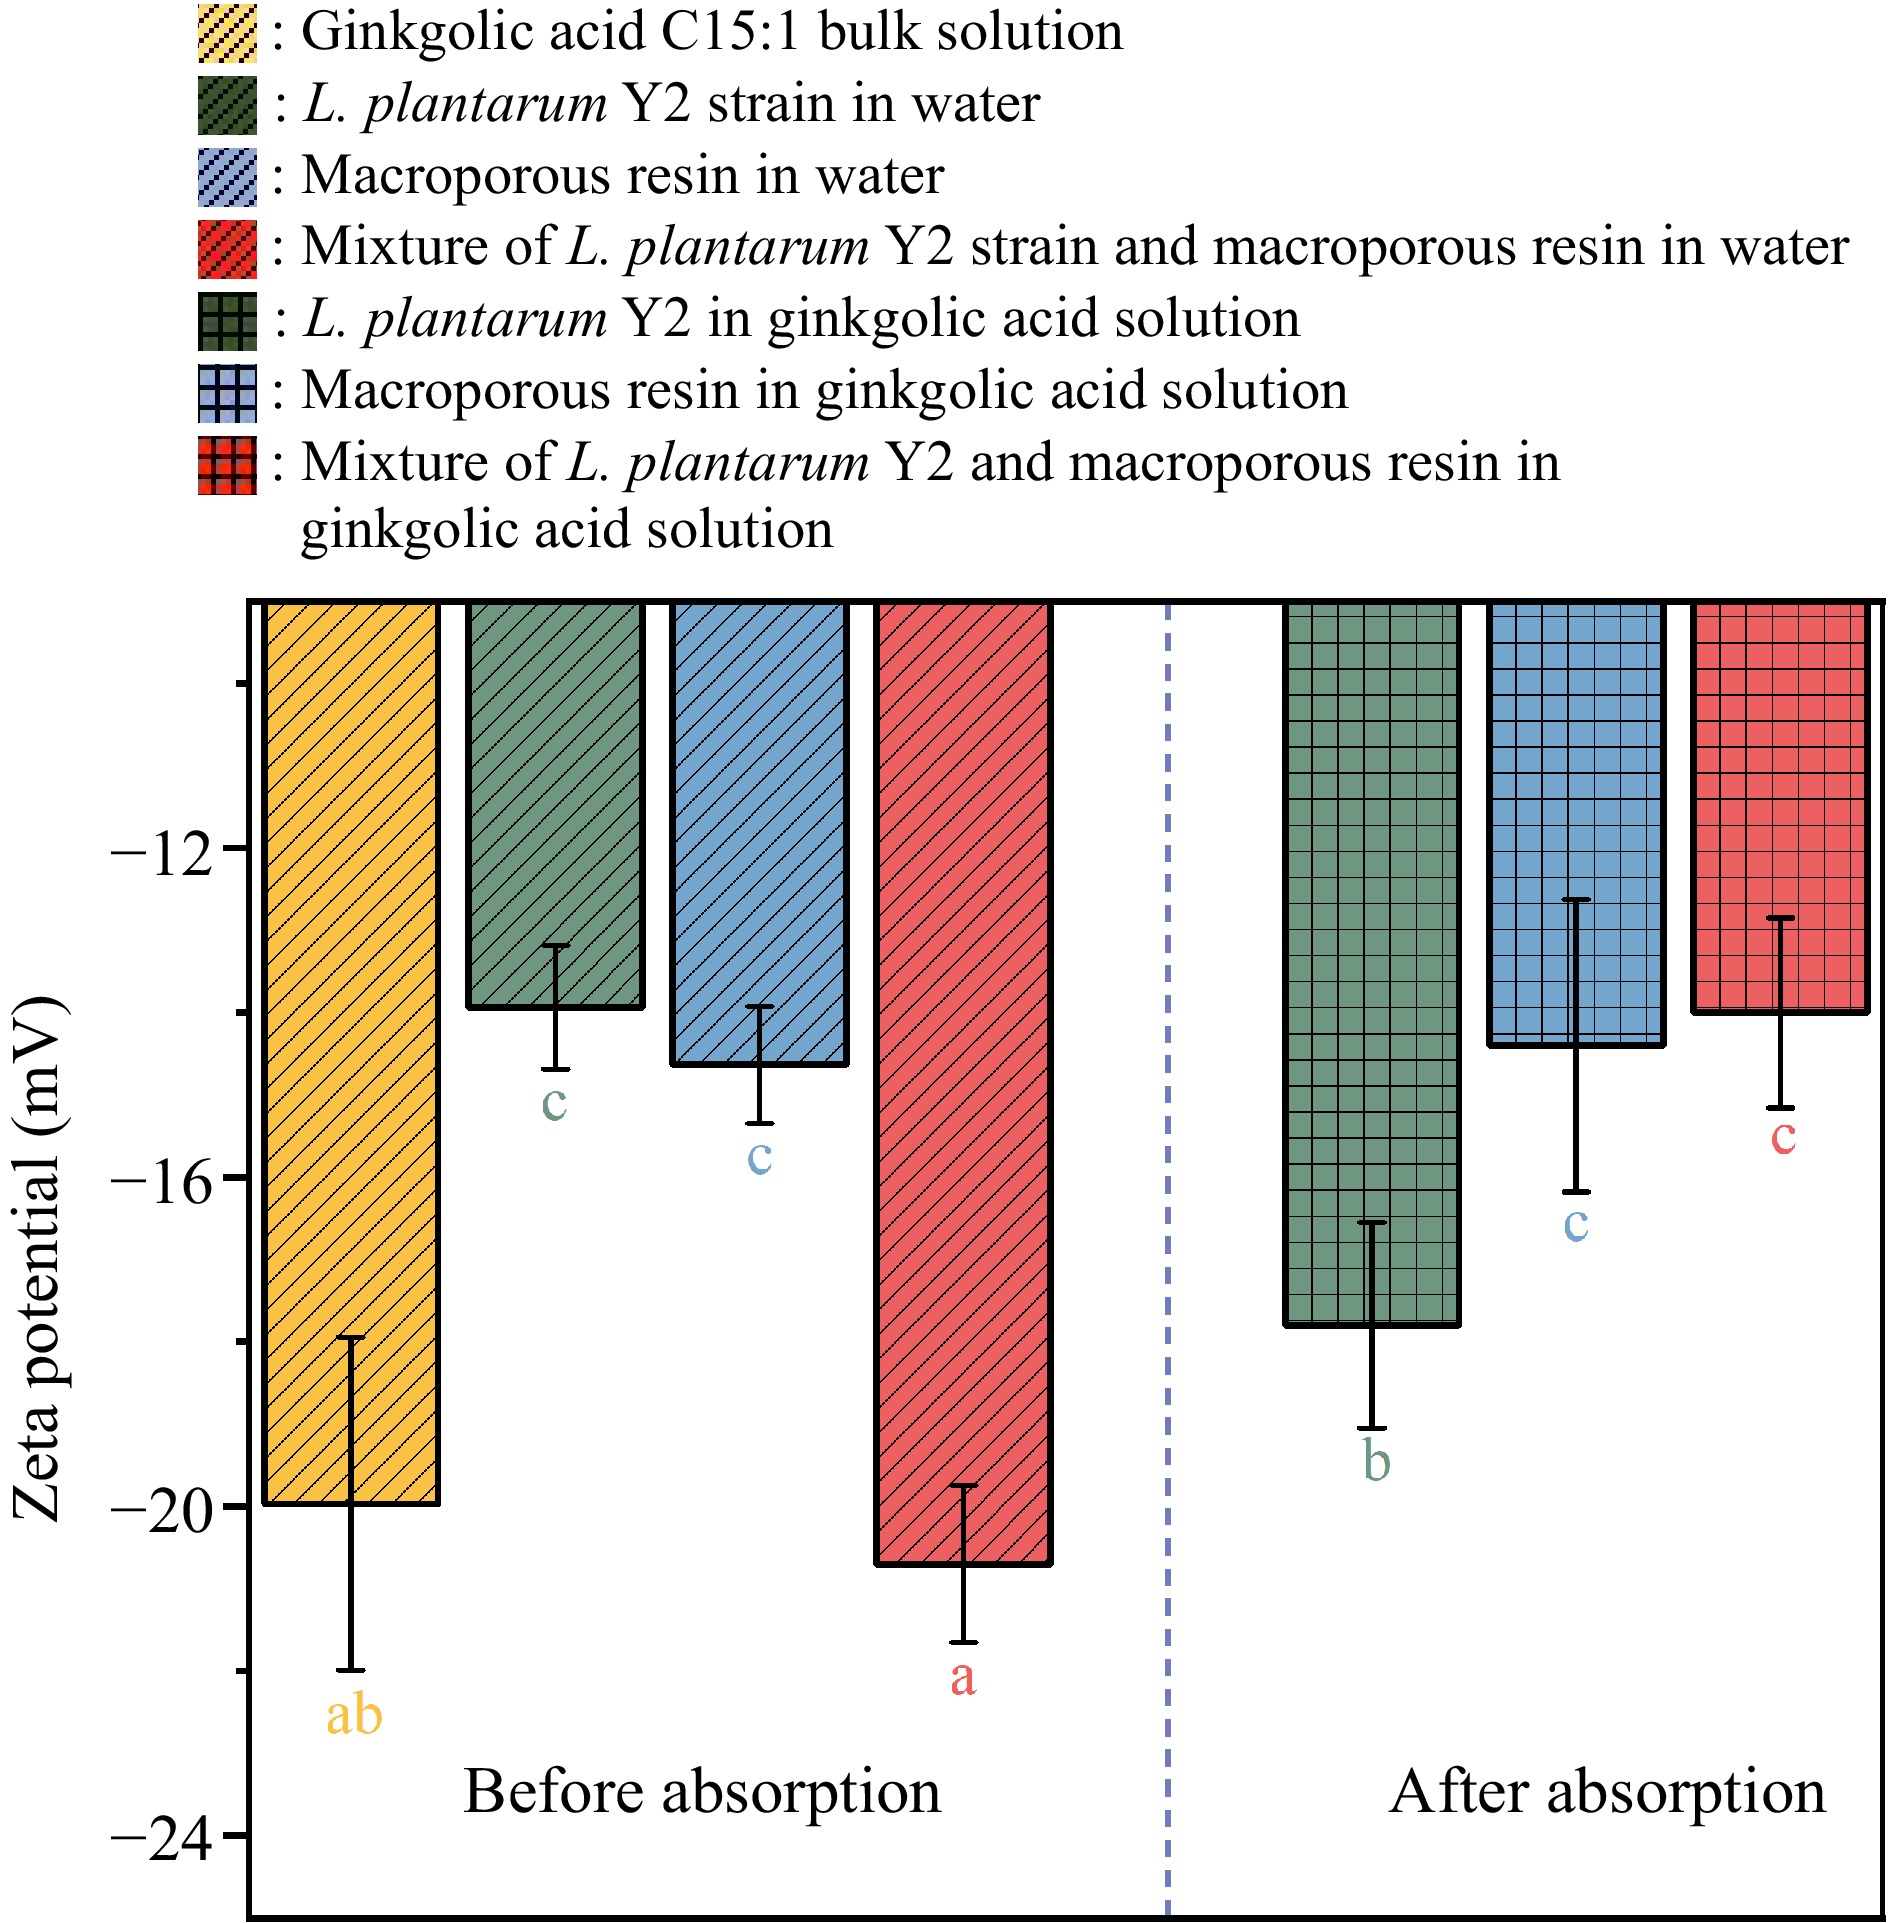
Figure 8.
Zeta potential values of the dispersions of L. plantarum Y2, macroporous resin, and their mixture before and after the adsorption of ginkgolic acid C15:1.
-

Figure 9.
SDCP% values at various times and different radial positions within the adsorbents, representing the contribution of surface diffusion to the overall intraparticle diffusion (green: L. plantarum Y2; purple: macroporous resin D101; orange: the mixture of L. plantarum and resin, where the combination was treated as a unified entity). (a) SDCP at the surface of each adsorbent (r = R). (b) SDCP at the center of each adsorbent (r = 0).
-

Figure 10.
The schematic of adsorption of ginkgolic acid by microbial strains, macroporous resin and their mixture.
-
Adsorbent kL (m/s) DAB (m2/s) Dep (m2/s) Ds (m2/s) AAD (%) R2 L. plantarum Y2 6.70 × 10⁻⁹ 5.57 × 10⁻¹⁰ n.s. 2.51 × 10⁻¹⁴ 8.78 0.975 Macroporous resin D101 6.74 × 10⁻⁶ 5.57 × 10⁻¹⁰ 8.22 × 10⁻¹¹ 1.67 × 10⁻¹² 10.16 0.947 Mixture of L. plantarum and resin 6.97 × 10⁻⁷ 5.57 × 10⁻¹⁰ 1.23 × 10⁻¹¹ 5.03 × 10⁻¹⁴ 13.27 0.933 n.s. refers to no pore volume diffusion. Table 1.
Mass transfer parameters obtained from the PVSDM model for simulating the adsorptions of ginkgolic acid C15:1 by L. plantarum Y2, macroporous resin, and their mixture.
Figures
(10)
Tables
(1)