-

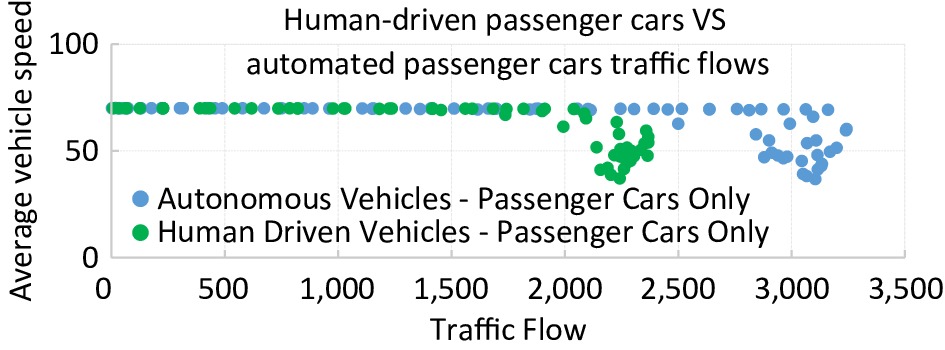
Figure 1.
Comparison of speed-flow diagram between human-driven passenger cars and APCs.
-

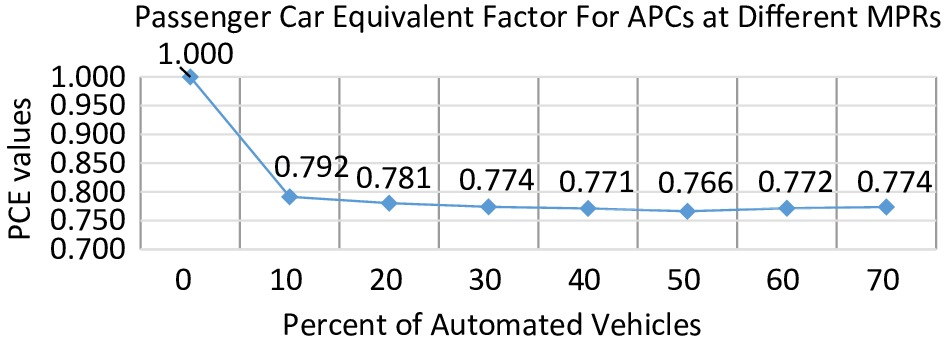
Figure 2.
Passenger car equivalent (EAV) at the various percent of APC penetration rates.
-

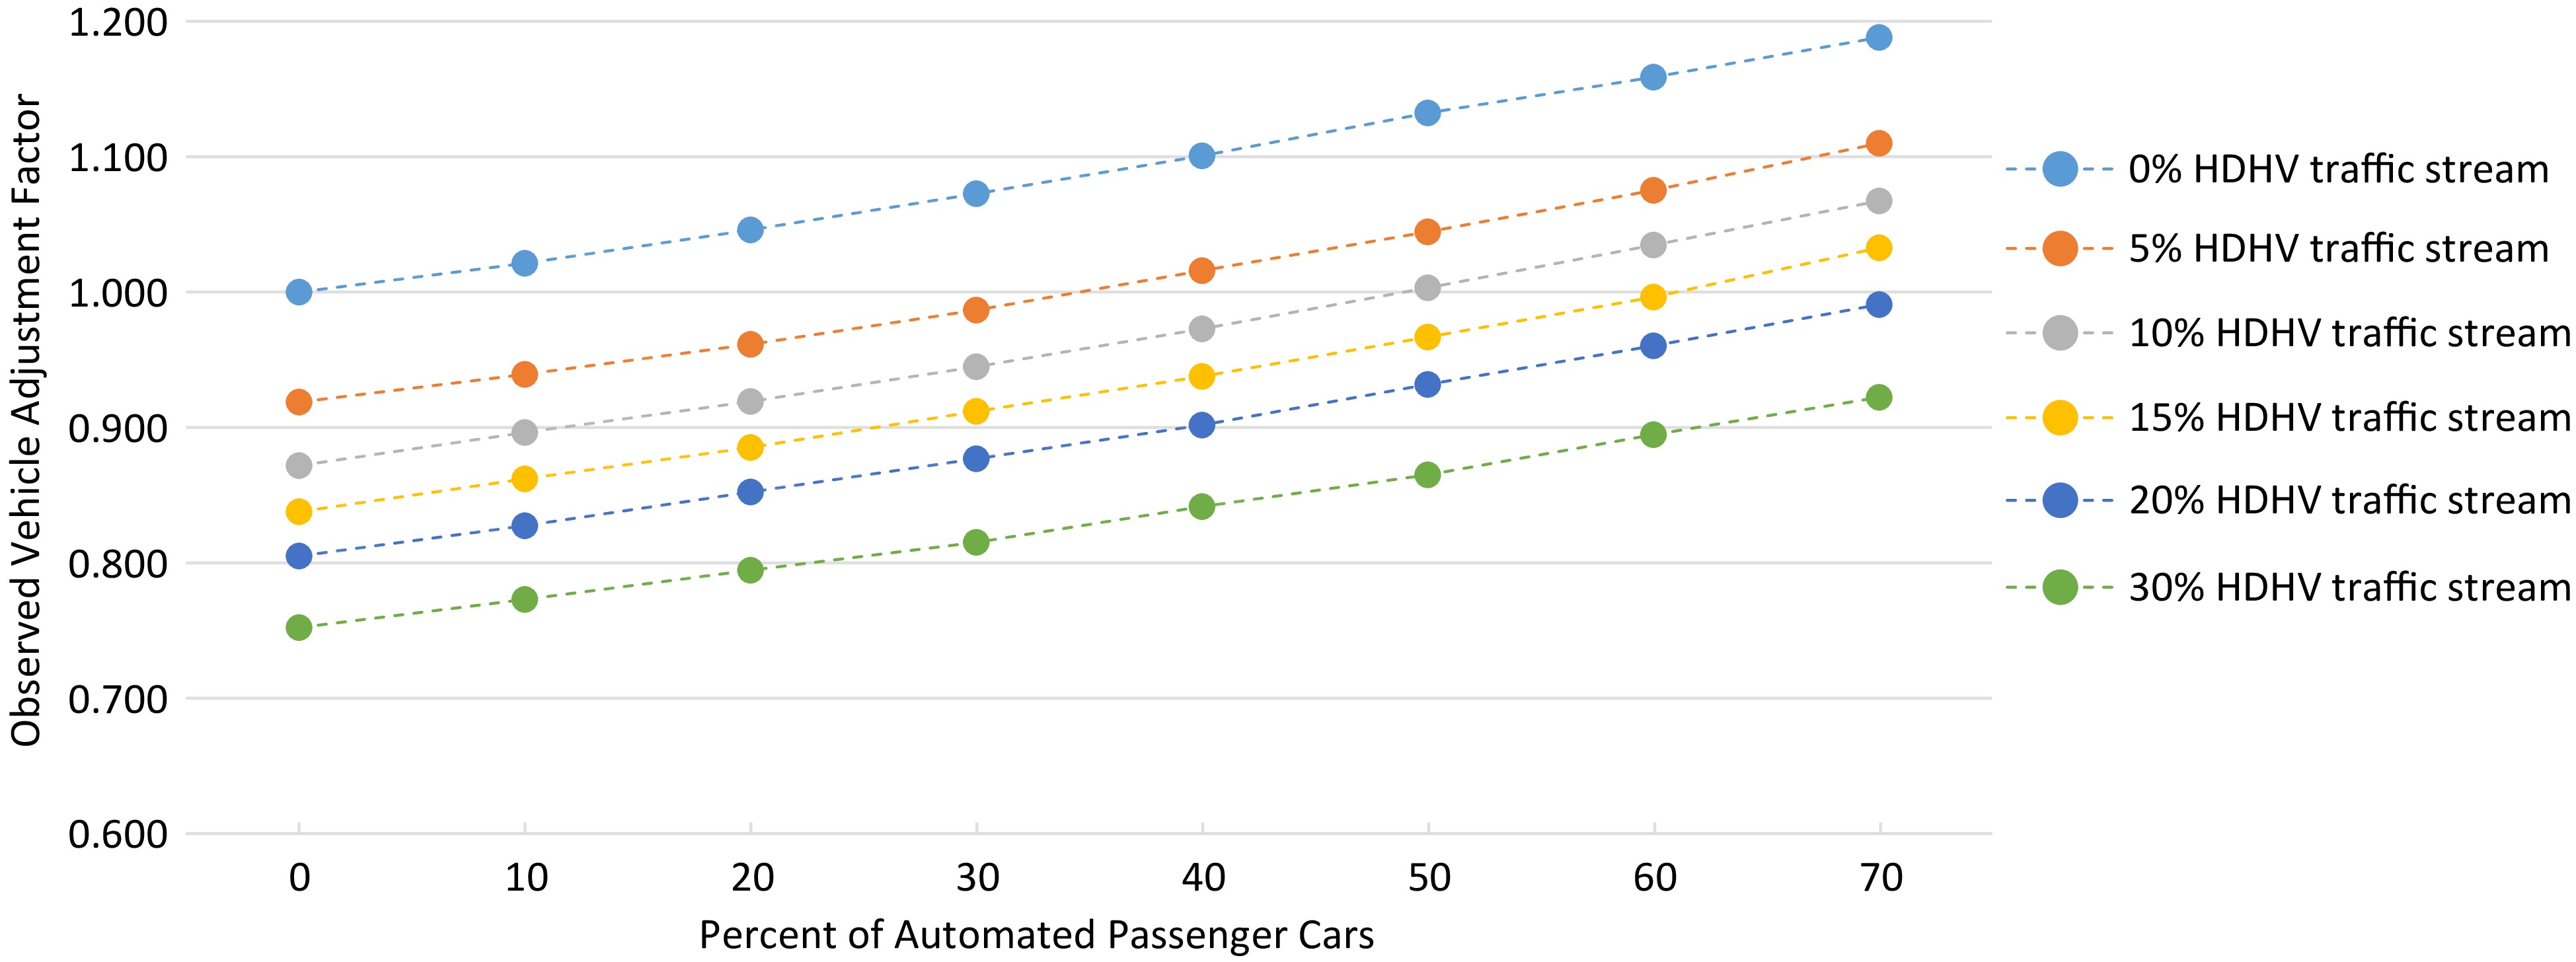
Figure 3.
Calculated adjustment (fAV) factors at various percentages of APCs.
-

Figure 4.
Impacts of the percentage of HDHV and APCs on fobserved.
-

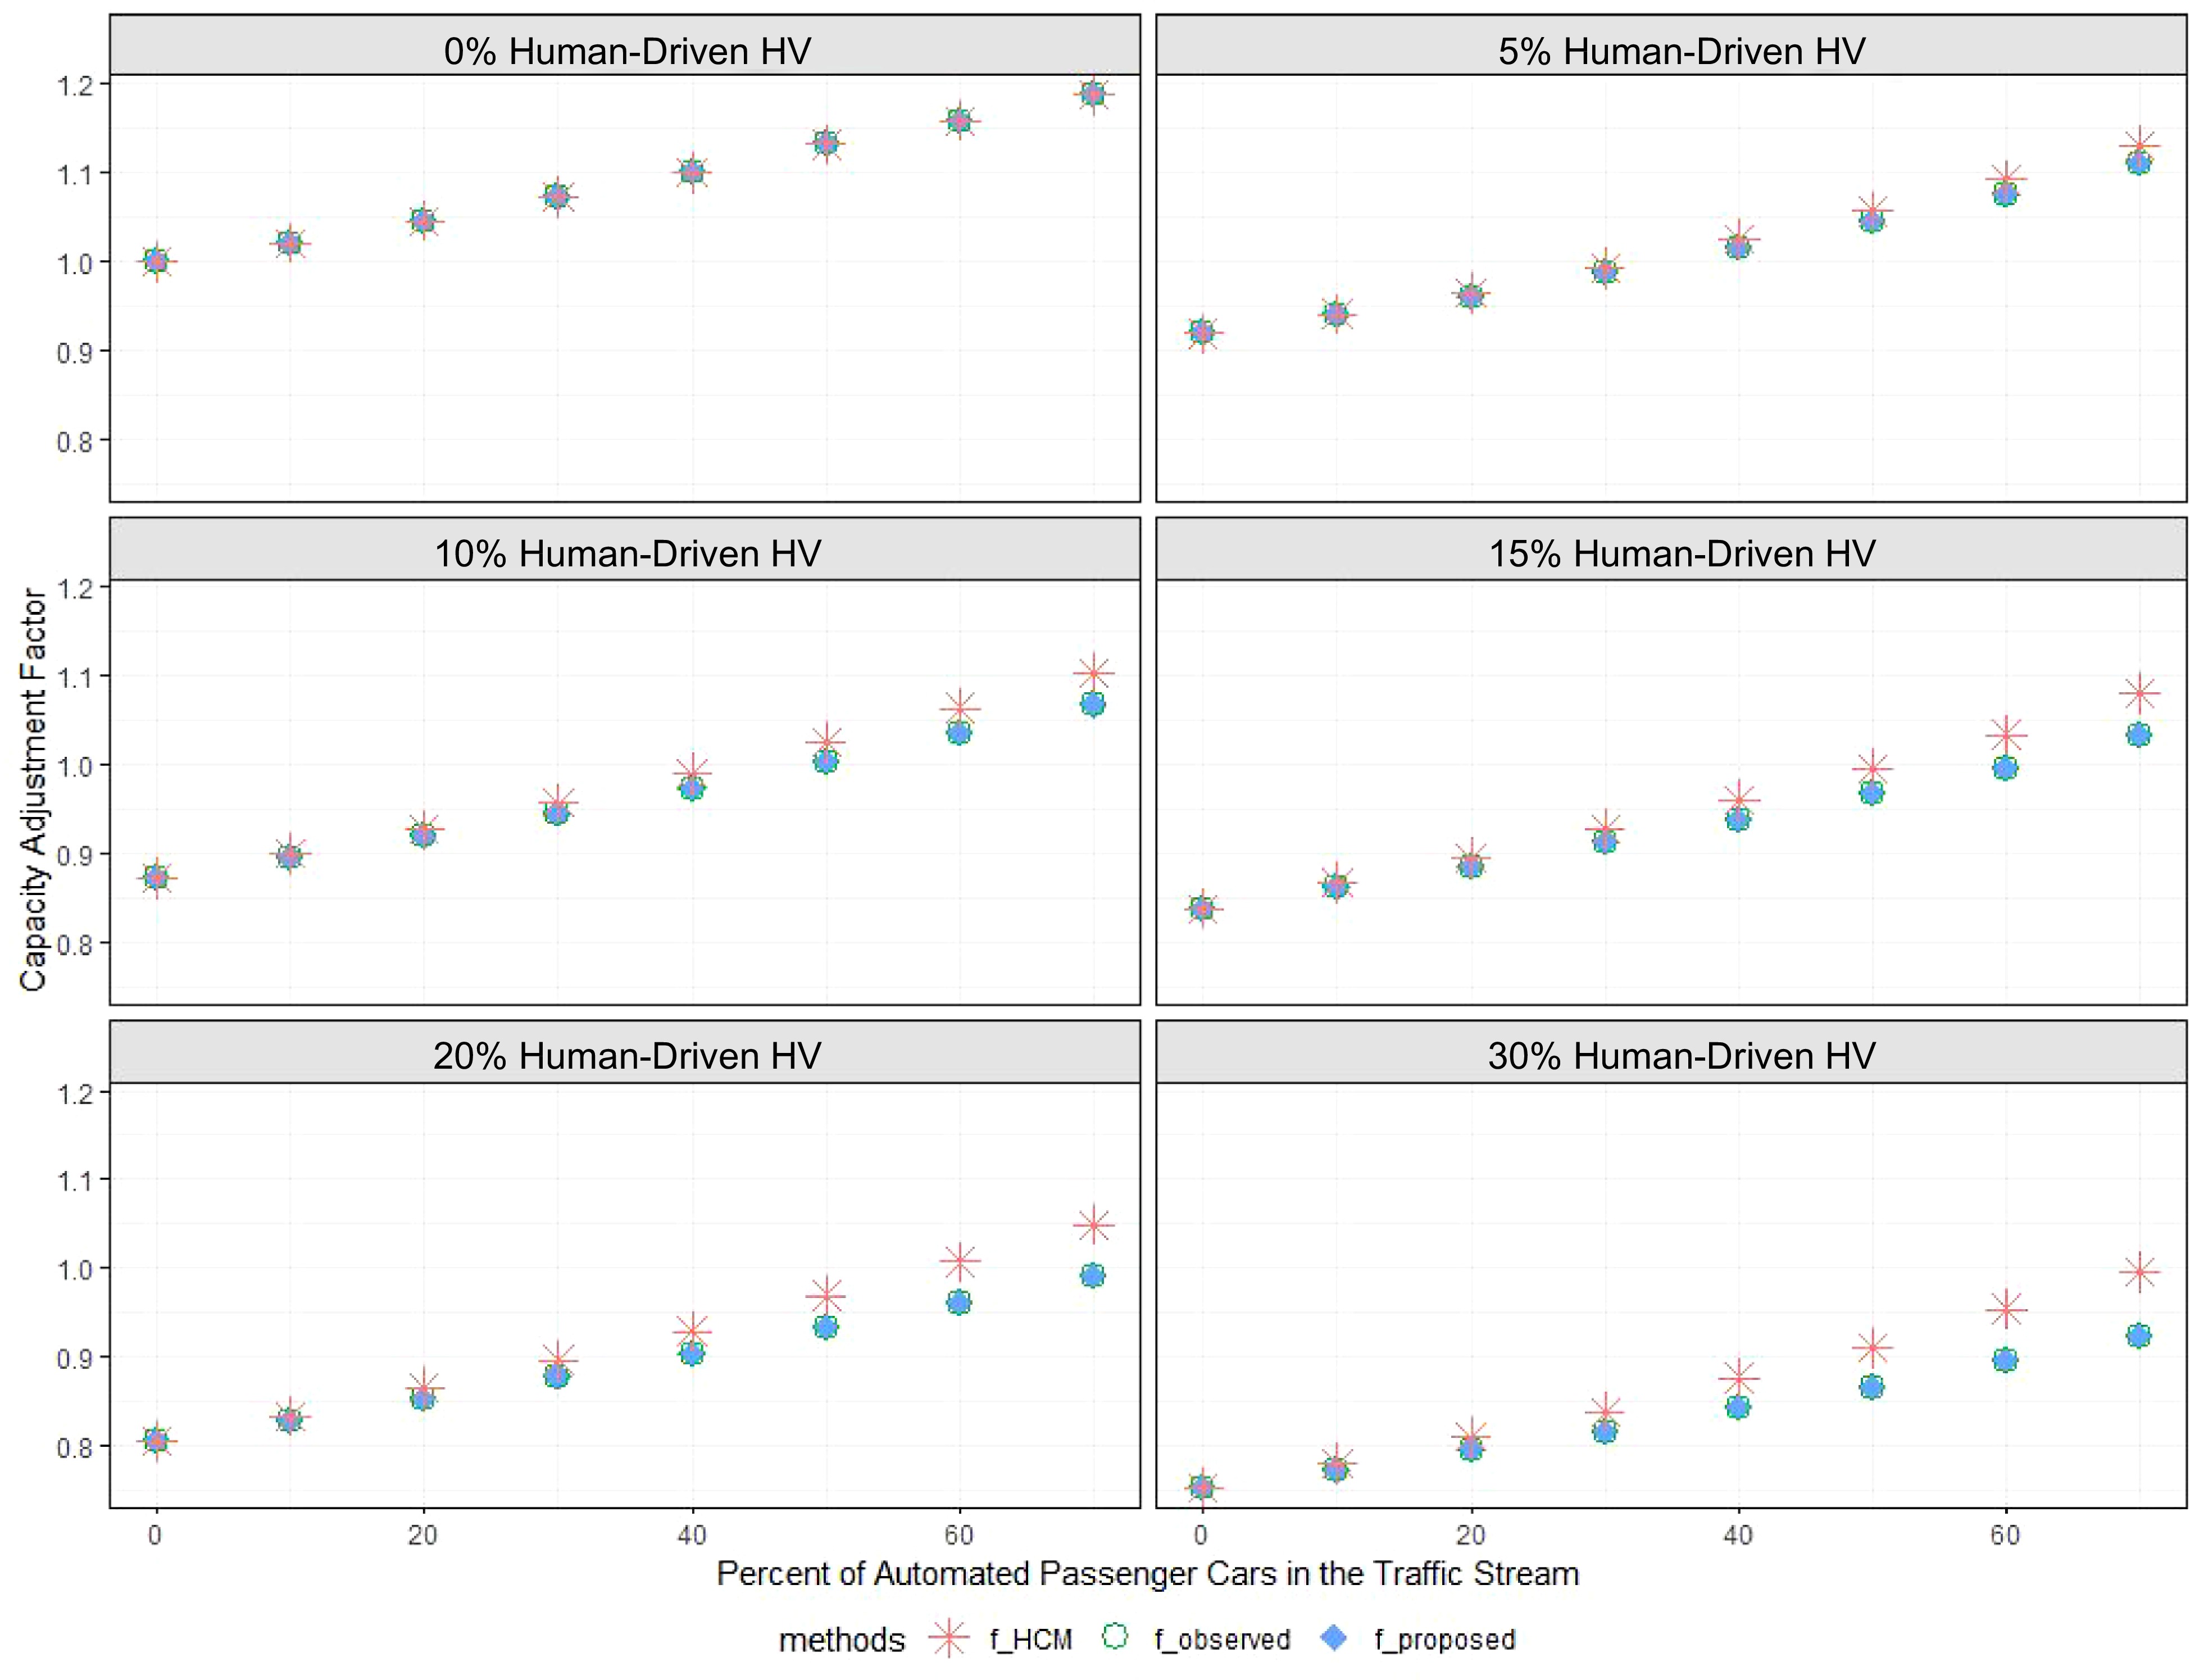
Figure 5.
Equivalent adjustment factors from the three approaches.
-
Scenario # Description 1 Passenger's cars only (100% HDPCs + 0% HDHVs) 2 5% mixed traffic (95% HDPCs + 5% HDHVs) 3 10% mixed traffic (90% HDPCs + 10% HDHVs) 4 15% mixed traffic (85% HDPCs + 15% HDHVs) 5 20% mixed traffic (80% HDPCs + 20% HDHVs) 6 30% mixed traffic (70% HDPCs + 30% HDHVs) Table 1.
Main simulation scenario for the human-driven traffic flow.
-
Parameters designation Description Default APCs CCO Standstill distance (ft) 4.92 3.98 CC1 Following variation (s) 0.9 0.6 CC2 Following variation (m) 13.12 0 CC3 Threshold for entering following (s) −8 −6 CC4 Negative following threshold (s) −0.35 −0.1 CC5 Positive following threshold (s) 0.35 0.1 CC6 Speed dependency of oscillation (rad/s) 11.4 0 CC7 Oscillation acceleration (ft/s2) 0.82 0.33 CC8 Standstill acceleration (ft/s2) 11.48 13.12 CC9 Acceleration at 50 mph (ft/s2) 4.92 6.56 Table 2.
Driving behavior parameters for APCs modeling.
-
Percent
of APCsDifference
in PCEt p > |t| 95% Conf. Interval 10 vs 0 −0.208 −22.230 <0.001* −0.237 −0.180 20 vs 0 −0.220 −23.420 <0.001* −0.248 −0.191 30 vs 0 −0.226 −24.090 <0.001* −0.255 −0.197 40 vs 0 −0.228 −24.320 <0.001* −0.257 −0.199 50 vs 0 −0.234 −24.920 <0.001* −0.263 −0.205 60 vs 0 −0.228 −24.360 <0.001* −0.257 −0.200 70 vs 0 −0.226 −24.120 <0.001* −0.255 −0.197 20 vs 10 −0.011 −1.180 0.935 −0.040 0.018 30 vs 10 −0.017 −1.860 0.580 −0.046 0.011 40 vs 10 −0.020 −2.080 0.430 −0.048 0.009 50 vs 10 −0.025 −2.690 0.133 −0.054 0.004 60 vs 10 −0.020 −2.130 0.402 −0.049 0.009 70 vs 10 −0.018 −1.890 0.557 −0.047 0.011 30 vs 20 −0.006 −0.680 0.998 −0.035 0.022 40 vs 20 −0.008 −0.900 0.986 −0.037 0.020 50 vs 20 −0.014 −1.510 0.802 −0.043 0.015 60 vs 20 −0.009 −0.940 0.981 −0.038 0.020 70 vs 20 −0.007 −0.710 0.997 −0.035 0.022 40 vs 30 −0.002 −0.220 1.000 −0.031 0.027 50 vs 30 −0.008 −0.830 0.991 −0.037 0.021 60 vs 30 −0.003 −0.270 1.000 −0.031 0.026 70 vs 30 0.000 −0.030 1.000 −0.029 0.029 50 vs 40 −0.006 −0.610 0.999 −0.035 0.023 60 vs 40 0.000 −0.040 1.000 −0.029 0.028 70 vs 40 0.002 0.190 1.000 −0.027 0.031 60 vs 50 0.005 0.570 0.999 −0.024 0.034 70 vs 50 0.007 0.800 0.993 −0.021 0.036 70 vs 60 0.002 0.230 1.000 −0.027 0.031 The standard error remained constant (Std. Err = 0.009) for each experiment. Table 3.
Comparison of EAV for APCs at different MPRs.
-
Percent of APCs Difference p > |t| [95% Conf. Interval] 10 vs 0 0.02 0.00 0.02 0.03 20 vs 0 0.05 0.00 0.04 0.06 30 vs 0 0.08 0.00 0.07 0.09 40 vs 0 0.12 0.00 0.11 0.12 50 vs 0 0.15 0.00 0.14 0.16 60 vs 0 0.19 0.00 0.18 0.19 70 vs 0 0.23 0.00 0.22 0.24 20 vs 10 0.03 0.00 0.02 0.03 30 vs 10 0.06 0.00 0.05 0.06 40 vs 10 0.09 0.00 0.09 0.10 50 vs 10 0.13 0.00 0.12 0.13 60 vs 10 0.16 0.00 0.16 0.17 70 vs 10 0.21 0.00 0.20 0.21 30 vs 20 0.03 0.00 0.02 0.04 40 vs 20 0.07 0.00 0.06 0.07 50 vs 20 0.10 0.00 0.09 0.11 60 vs 20 0.14 0.00 0.13 0.14 70 vs 20 0.18 0.00 0.17 0.19 40 vs 30 0.04 0.00 0.03 0.04 50 vs 30 0.07 0.00 0.06 0.08 60 vs 30 0.11 0.00 0.10 0.11 70 vs 30 0.15 0.00 0.14 0.16 50 vs 40 0.03 0.00 0.03 0.04 60 vs 40 0.07 0.00 0.07 0.08 70 vs 40 0.11 0.00 0.11 0.12 60 vs 50 0.04 0.00 0.03 0.04 70 vs 50 0.08 0.00 0.07 0.09 70 vs 60 0.04 0.00 0.04 0.05 Table 4.
Difference in adjustment factors for APCs at different MPRs.
-
Percent
of APCsTruck
percentagesDifference
in CAFStd.
Err.p > |t| [95% Conf. Interval] 0 5 vs 0 −0.08 0.00 0.00* −0.09 −0.07 10 vs 0 −0.13 0.00 0.00* −0.14 −0.12 15 vs 0 −0.16 0.00 0.00* −0.17 −0.15 20 vs 0 −0.19 0.00 0.00* −0.20 −0.19 30 vs 0 −0.25 0.00 0.00* −0.26 −0.24 10 vs 5 −0.05 0.00 0.00* −0.06 −0.04 15 vs 5 −0.08 0.00 0.00* −0.09 −0.07 20 vs 5 −0.11 0.00 0.00* −0.12 −0.10 30 vs 5 −0.17 0.00 0.00* −0.17 −0.16 15 vs 10 −0.03 0.00 0.00* −0.04 −0.03 20 vs 10 −0.07 0.00 0.00* −0.07 −0.06 30 vs 10 −0.12 0.00 0.00* −0.13 −0.11 20 vs 15 −0.03 0.00 0.00* −0.04 −0.02 30 vs 15 −0.09 0.00 0.00* −0.09 −0.08 30 vs 20 −0.05 0.00 0.00* −0.06 −0.05 70 5 vs 0 −0.08 0.01 0.00* −0.09 −0.06 10 vs 0 −0.12 0.01 0.00* −0.14 −0.11 15 vs 0 −0.16 0.01 0.00* −0.17 −0.14 20 vs 0 −0.20 0.01 0.00* −0.21 −0.18 30 vs 0 −0.27 0.01 0.00* −0.28 −0.25 10 vs 5 −0.05 0.01 0.00* −0.06 −0.03 15 vs 5 −0.08 0.01 0.00* −0.09 −0.06 20 vs 5 −0.12 0.01 0.00* −0.14 −0.10 30 vs 5 −0.19 0.01 0.00* −0.20 −0.17 15 vs 10 −0.03 0.01 0.00* −0.05 −0.02 20 vs 10 −0.08 0.01 0.00* −0.09 −0.06 30 vs 10 −0.14 0.01 0.00* −0.16 −0.13 20 vs 15 −0.04 0.01 0.00* −0.06 −0.03 30 vs 15 −0.11 0.01 0.00* −0.13 −0.10 30 vs 20 −0.07 0.01 0.00* −0.08 −0.05 Table 5.
Significant differences in fobserved at different percentages of APCs and HDHVs.
-
HDHV percentage Percent
of APCsObserved
adjustment
factor
(fobserved)Calculated
adjustment
factor
(fHCM)Std.
Err.p > |t| [95% Conf. Interval] 5 0 0.919 0.919 0.00 1.00 −0.005 0.005 10 0.940 0.941 0.49 0.63 −0.003 0.005 20 0.962 0.965 1.40 0.17* −0.001 0.007 30 0.987 0.993 2.73 0.01* 0.002 0.010 40 1.015 1.026 4.02 0.00* 0.005 0.016 50 1.045 1.058 4.13 0.00* 0.006 0.019 60 1.076 1.093 6.55 0.00* 0.012 0.023 70 1.111 1.131 4.88 0.00* 0.011 0.028 10 0 0.871 0.871 0.00 1.00 −0.005 0.005 10 0.898 0.901 0.95 0.35 −0.003 0.008 20 0.920 0.926 2.26 0.03* 0.001 0.011 30 0.944 0.956 5.58 0.00* 0.008 0.016 40 0.974 0.990 5.74 0.00* 0.010 0.022 50 1.004 1.026 6.09 0.00* 0.015 0.029 60 1.035 1.064 7.57 0.00* 0.021 0.037 70 1.066 1.104 8.31 0.00* 0.028 0.047 15 0 0.838 0.838 0.00 1.00 −0.006 0.006 10 0.862 0.868 2.60 0.01* 0.001 0.011 20 0.885 0.894 3.41 0.00* 0.003 0.014 30 0.912 0.928 6.08 0.00* 0.011 0.021 40 0.938 0.960 7.63 0.00* 0.016 0.027 50 0.967 0.998 10.32 0.00* 0.025 0.037 60 0.996 1.036 11.14 0.00* 0.032 0.047 70 1.033 1.081 9.77 0.00* 0.038 0.059 20 0 0.806 0.806 0.00 1.00 −0.007 0.007 10 0.828 0.833 2.03 0.05* 0.000 0.011 20 0.853 0.865 5.95 0.00* 0.008 0.017 30 0.876 0.896 6.04 0.00* 0.013 0.027 40 0.902 0.929 7.27 0.00* 0.020 0.035 50 0.932 0.969 9.36 0.00* 0.029 0.044 60 0.960 1.009 10.53 0.00* 0.039 0.058 70 0.991 1.050 8.09 0.00* 0.044 0.073 30 0 0.752 0.752 0.00 1.00 −0.007 0.007 10 0.773 0.781 2.51 0.02* 0.002 0.014 20 0.795 0.809 4.17 0.00* 0.007 0.021 30 0.816 0.839 5.72 0.00* 0.015 0.031 40 0.843 0.875 8.27 0.00* 0.025 0.040 50 0.866 0.910 9.48 0.00* 0.035 0.053 60 0.894 0.955 8.30 0.00* 0.046 0.075 70 0.922 0.996 9.16 0.00* 0.058 0.090 Table 6.
Differences in adjustment factors between the observed (fobserved) and calculated (fHCM).
-
Truck
percentagePercent
of APCsObserved
adjustment
factor
(fobserved)Calculated
adjustment
factor
(fproposed)Std.
Err.p > |t| [95% Conf. Interval] 5 0 0.919 0.919 0.00 1.00 −0.005 0.005 10 0.940 0.940 0.00 1.00 −0.004 0.004 20 0.962 0.962 0.00 1.00 −0.004 0.004 30 0.987 0.987 0.00 1.00 −0.005 0.005 40 1.015 1.015 0.00 1.00 −0.005 0.005 50 1.045 1.045 0.00 1.00 −0.006 0.006 60 1.076 1.076 0.00 1.00 −0.006 0.006 70 1.111 1.111 0.00 1.00 −0.008 0.008 10 0 0.871 0.871 0.00 1.00 −0.005 0.005 10 0.898 0.898 0.00 1.00 −0.006 0.006 20 0.920 0.920 0.00 1.00 −0.005 0.005 30 0.944 0.944 0.00 1.00 −0.004 0.004 40 0.974 0.974 0.00 1.00 −0.006 0.006 50 1.004 1.004 0.00 1.00 −0.007 0.007 60 1.035 1.035 0.00 1.00 −0.008 0.008 70 1.066 1.066 0.00 1.00 −0.009 0.009 15 0 0.838 0.838 0.00 1.00 −0.006 0.006 10 0.862 0.862 0.00 1.00 −0.005 0.005 20 0.885 0.885 0.00 1.00 −0.005 0.005 30 0.912 0.912 0.00 1.00 −0.005 0.005 40 0.938 0.938 0.00 1.00 −0.006 0.006 50 0.967 0.967 0.00 1.00 −0.006 0.006 60 0.996 0.996 0.00 1.00 −0.008 0.008 70 1.033 1.033 0.00 1.00 −0.010 0.010 20 0 0.806 0.806 0.00 1.00 −0.007 0.007 10 0.828 0.828 0.00 1.00 −0.006 0.006 20 0.853 0.853 0.00 1.00 −0.005 0.005 30 0.876 0.876 0.00 1.00 −0.006 0.006 40 0.902 0.902 0.00 1.00 −0.007 0.007 50 0.932 0.932 0.00 1.00 −0.008 0.008 60 0.960 0.960 0.00 1.00 −0.010 0.010 70 0.991 0.991 0.01 1.00 −0.014 0.014 30 0 0.752 0.752 0.00 1.00 −0.007 0.007 10 0.773 0.773 0.00 1.00 −0.006 0.006 20 0.795 0.795 0.00 1.00 −0.007 0.007 30 0.816 0.816 0.00 1.00 −0.008 0.008 40 0.843 0.843 0.00 1.00 −0.008 0.008 50 0.866 0.866 0.00 1.00 −0.009 0.009 60 0.894 0.894 0.01 1.00 −0.013 0.013 70 0.922 0.922 0.01 1.00 −0.015 0.015 Table 7.
Differences in adjustment factors between the observed (fobserved) and calculated (fproposed).
Figures
(5)
Tables
(7)