-
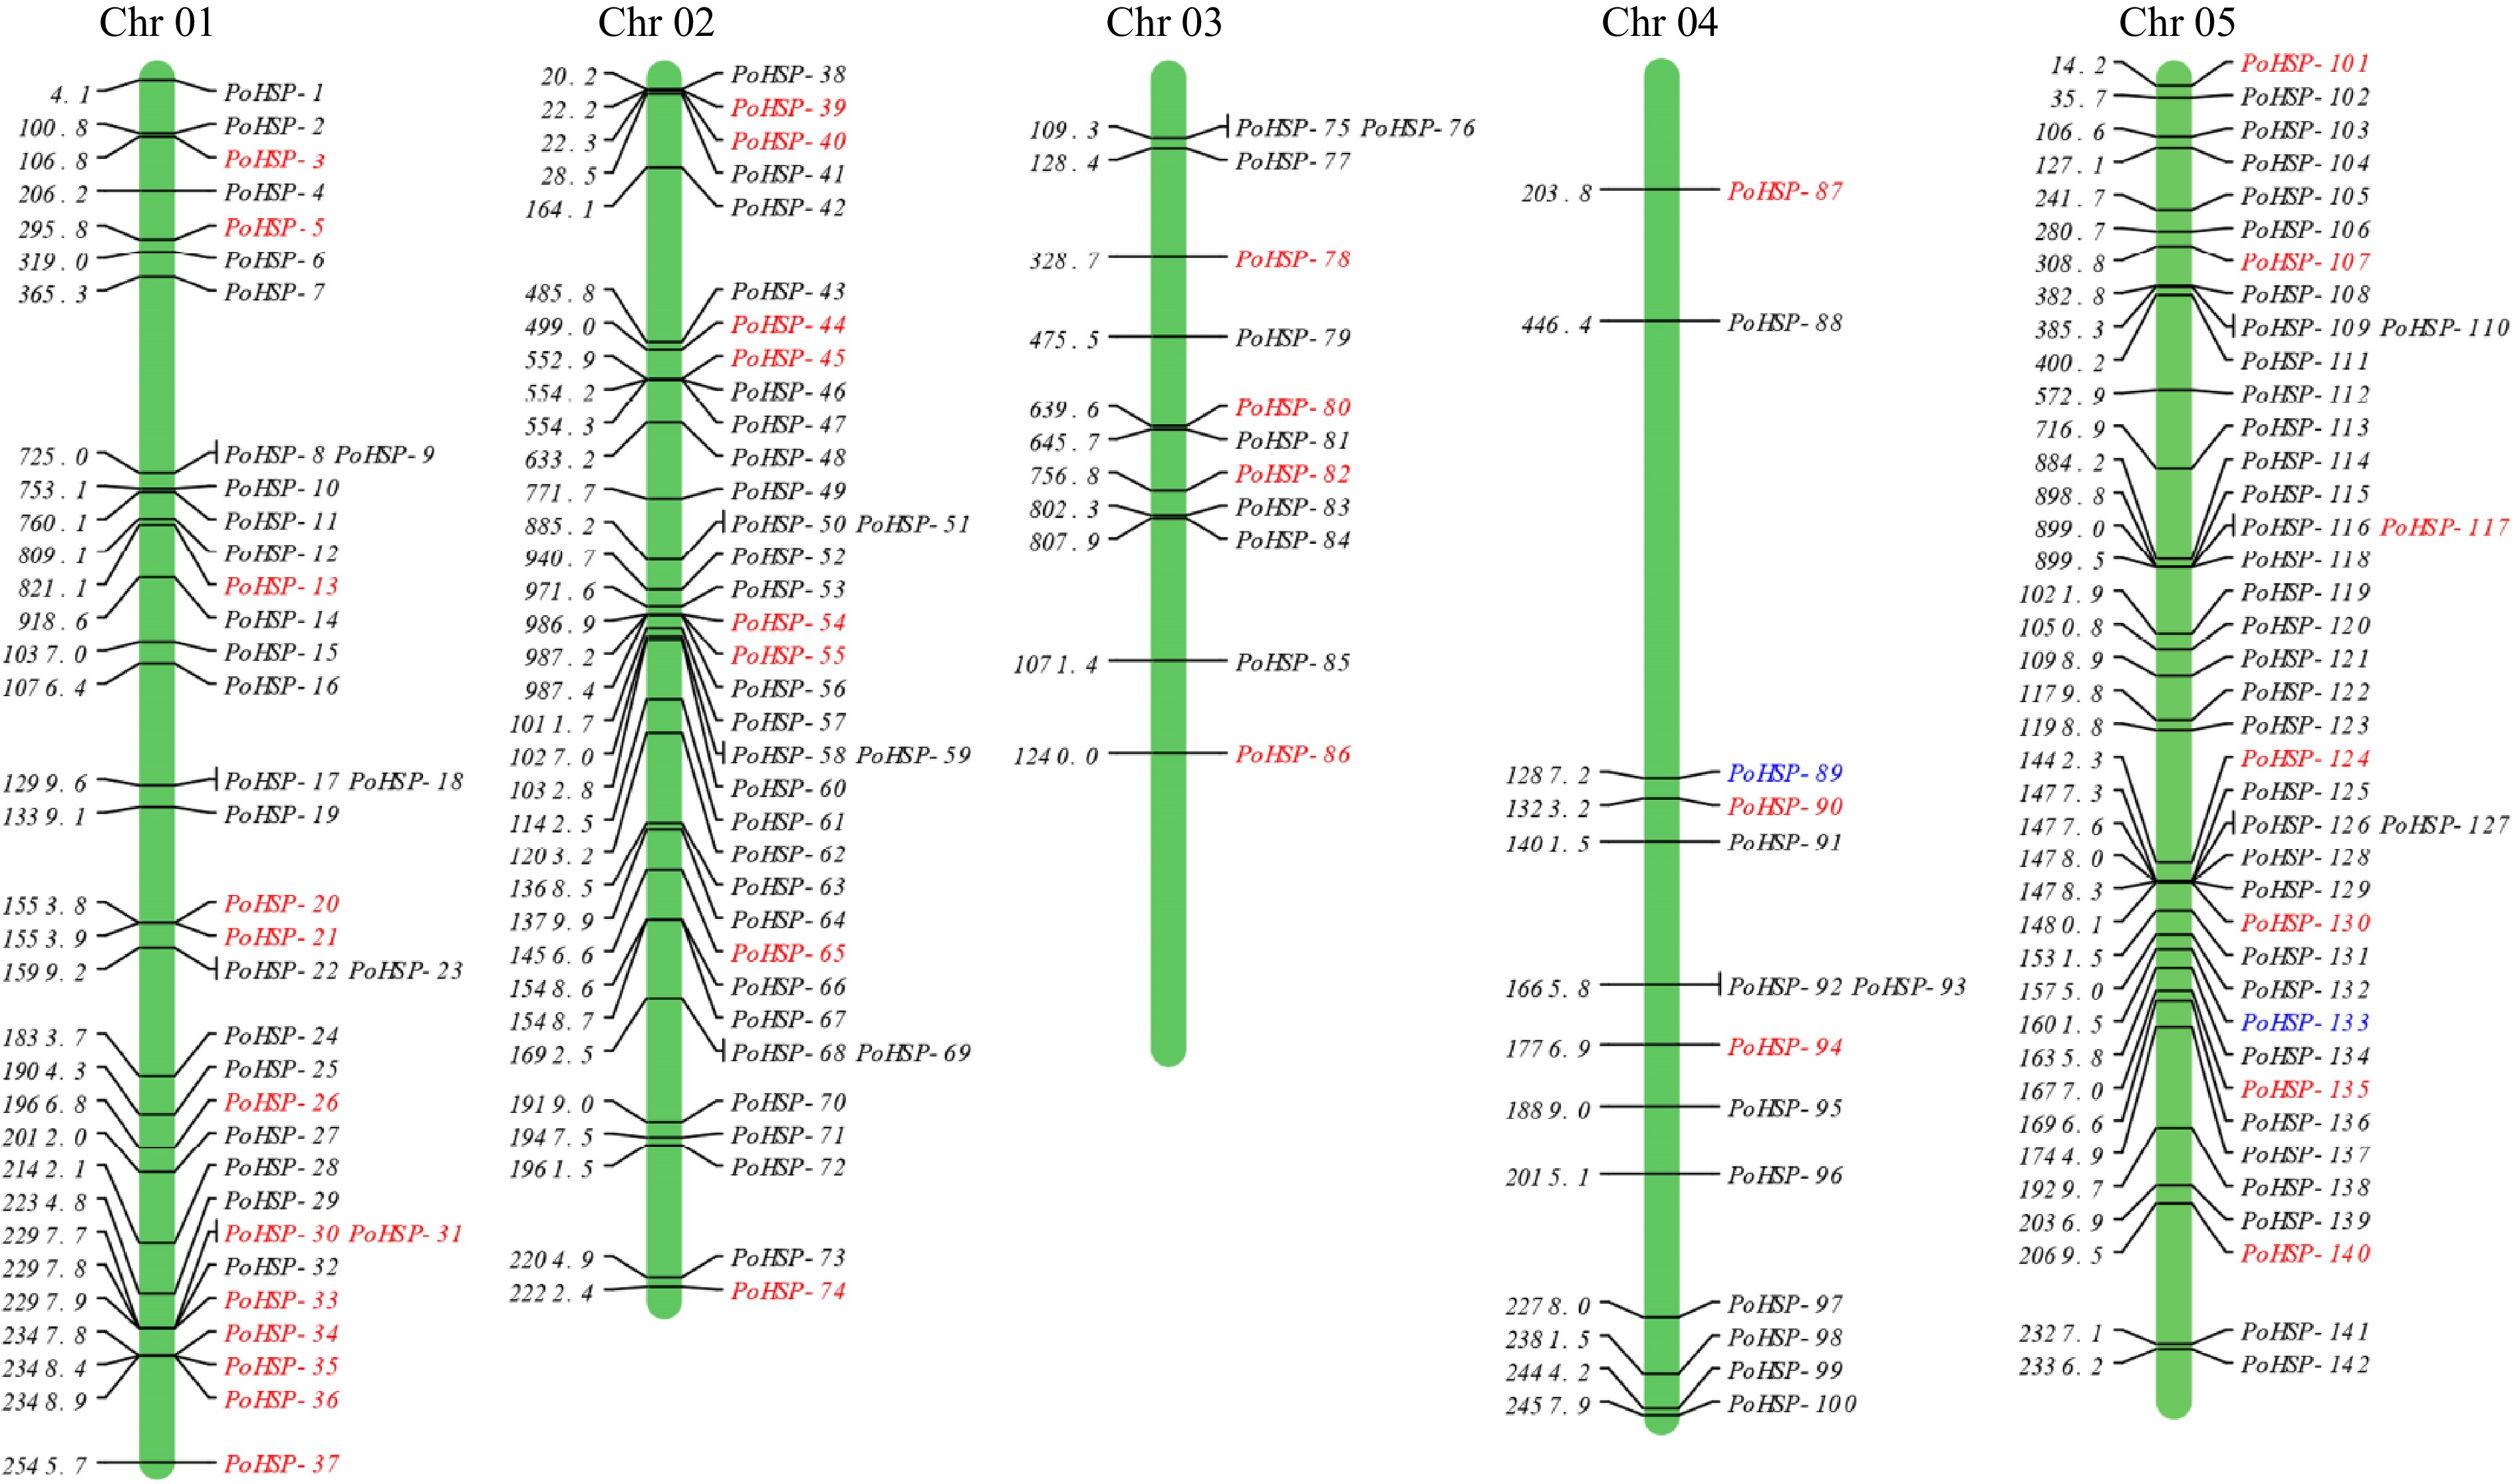
Figure 1.
Chromosomal locations of PoHSP20s on P. ostii chromosomes. The genes in red were also identified in the transcriptome of flower bud of P. ostii, the genes marked in blue were used for association analysis.
-
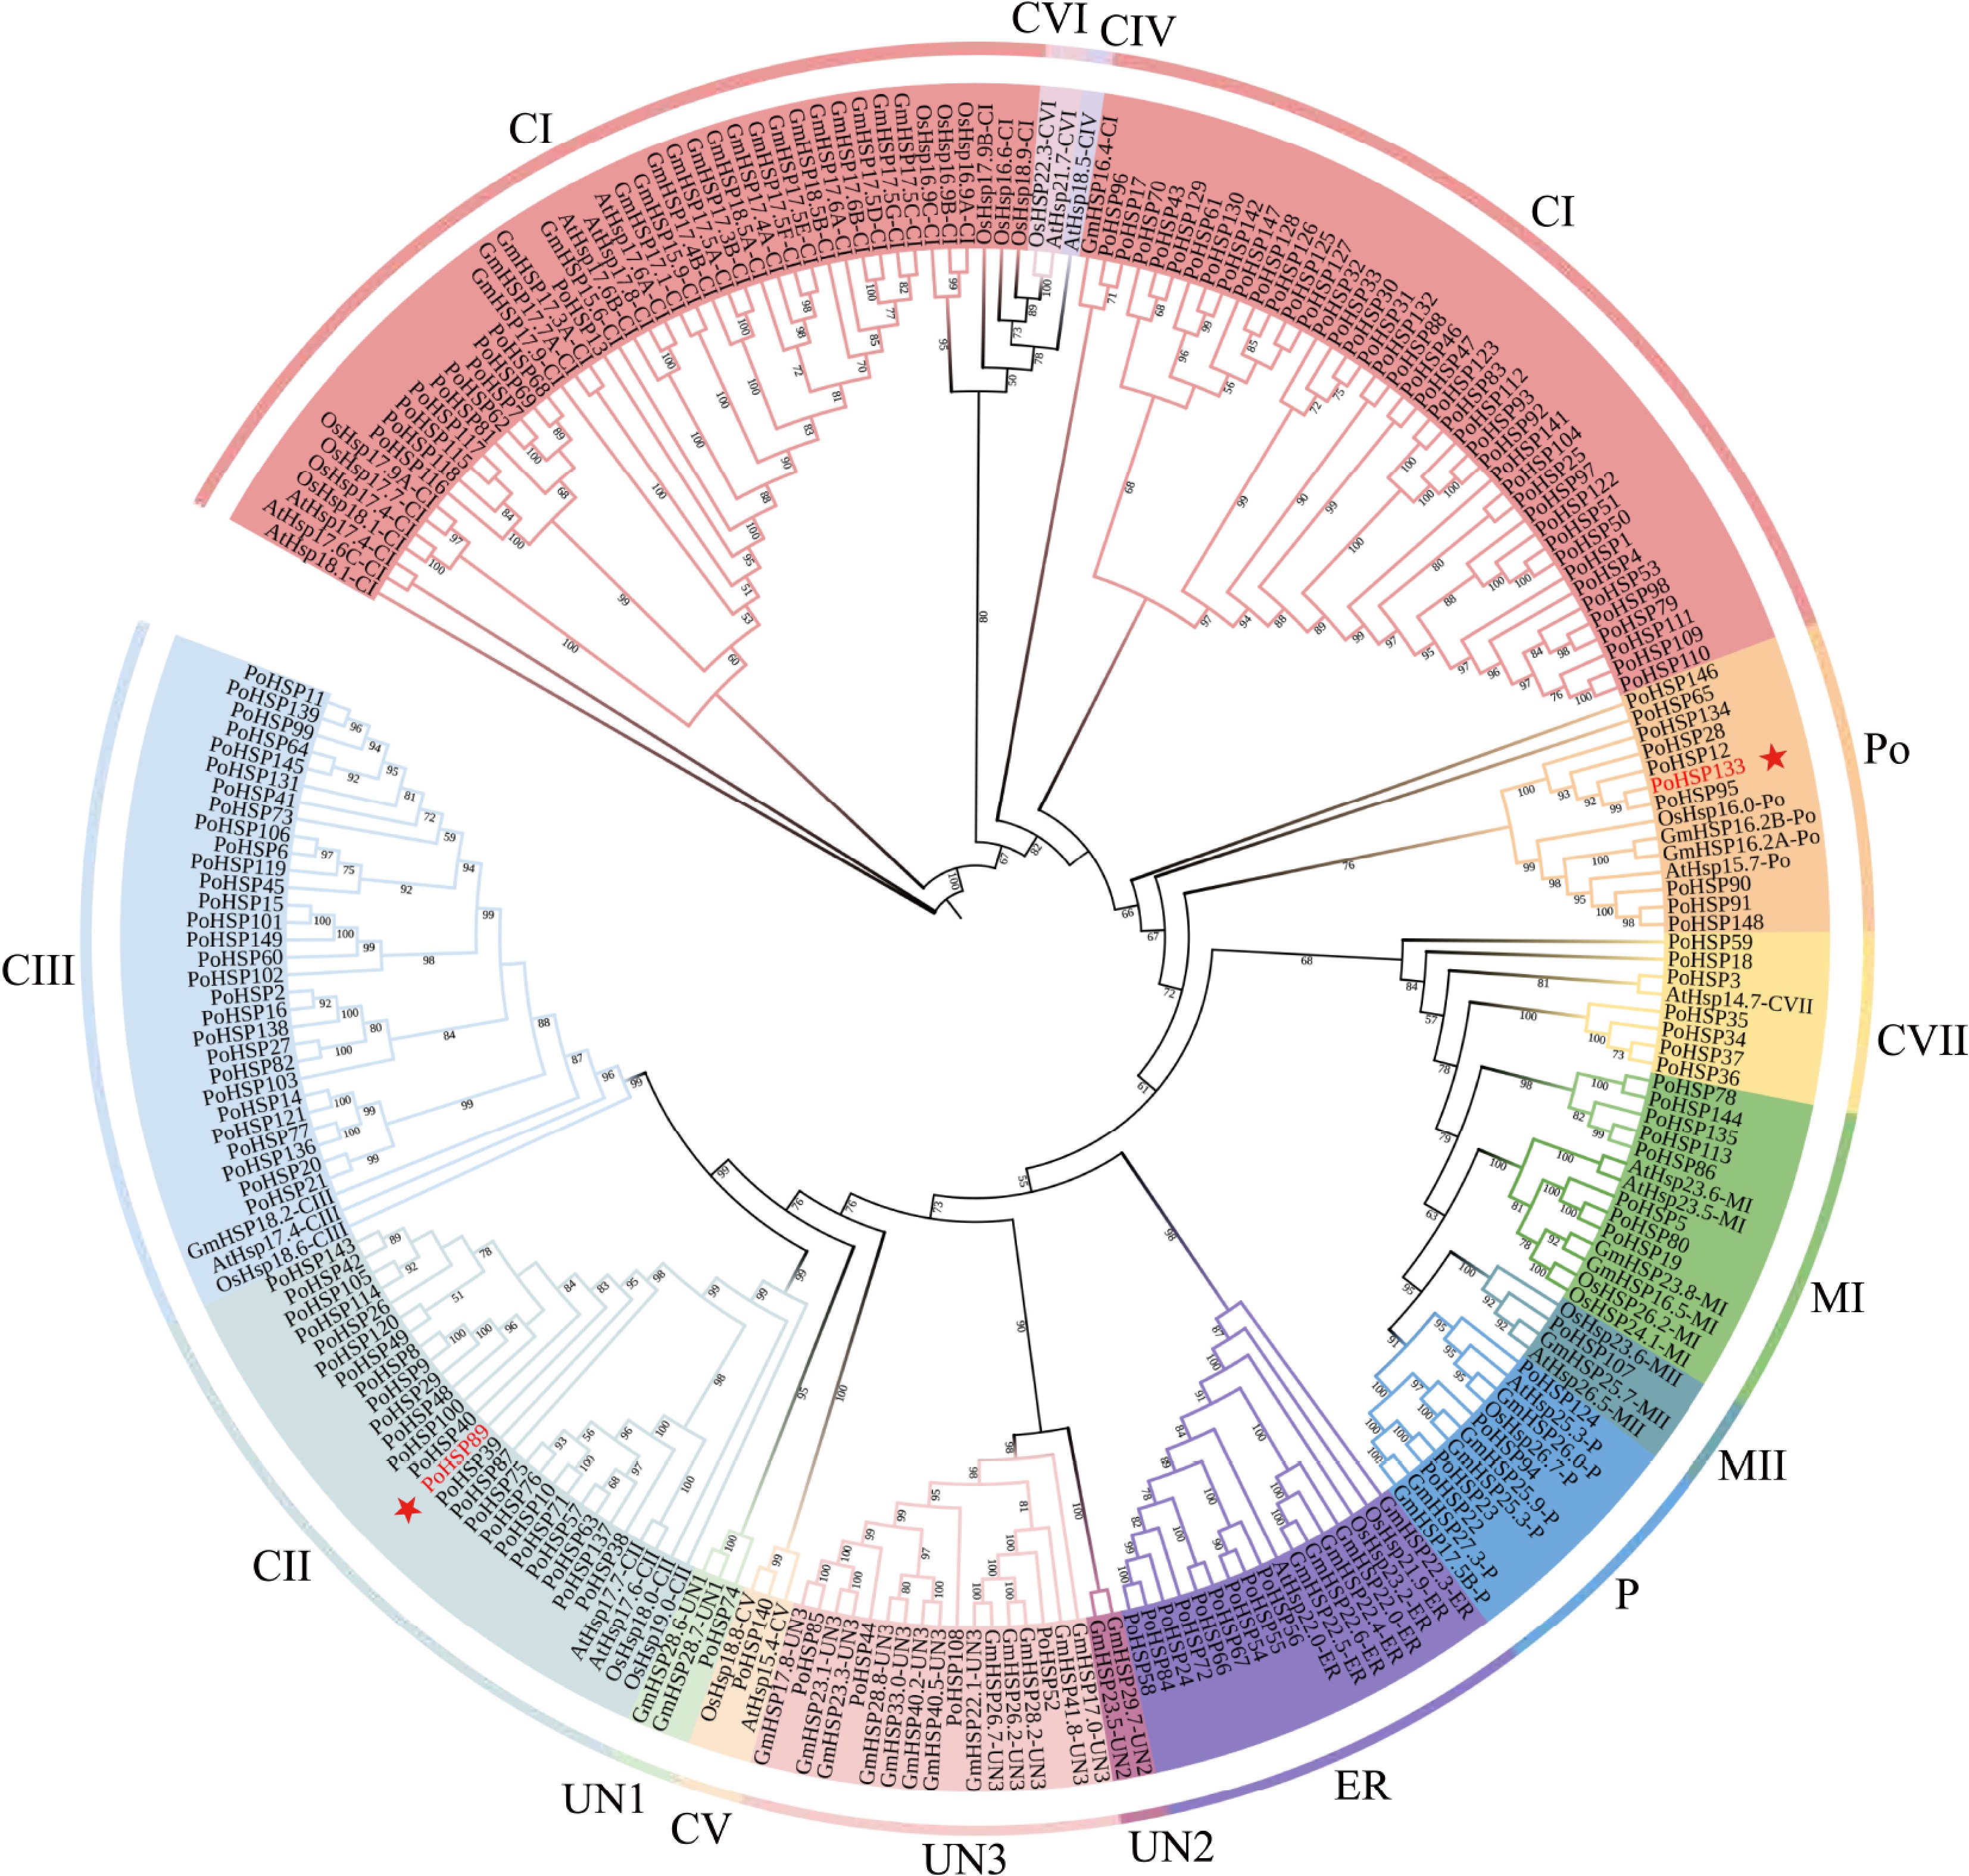
Figure 2.
The phylogenetic tree of HSP20s from A. thaliana, O. sativa, G. max and P. ostii. It was constructed using the ML method with 1,000 bootstrap replications. The colors indicate the different subfamilies, the stars indicate the genes for association analysis.
-
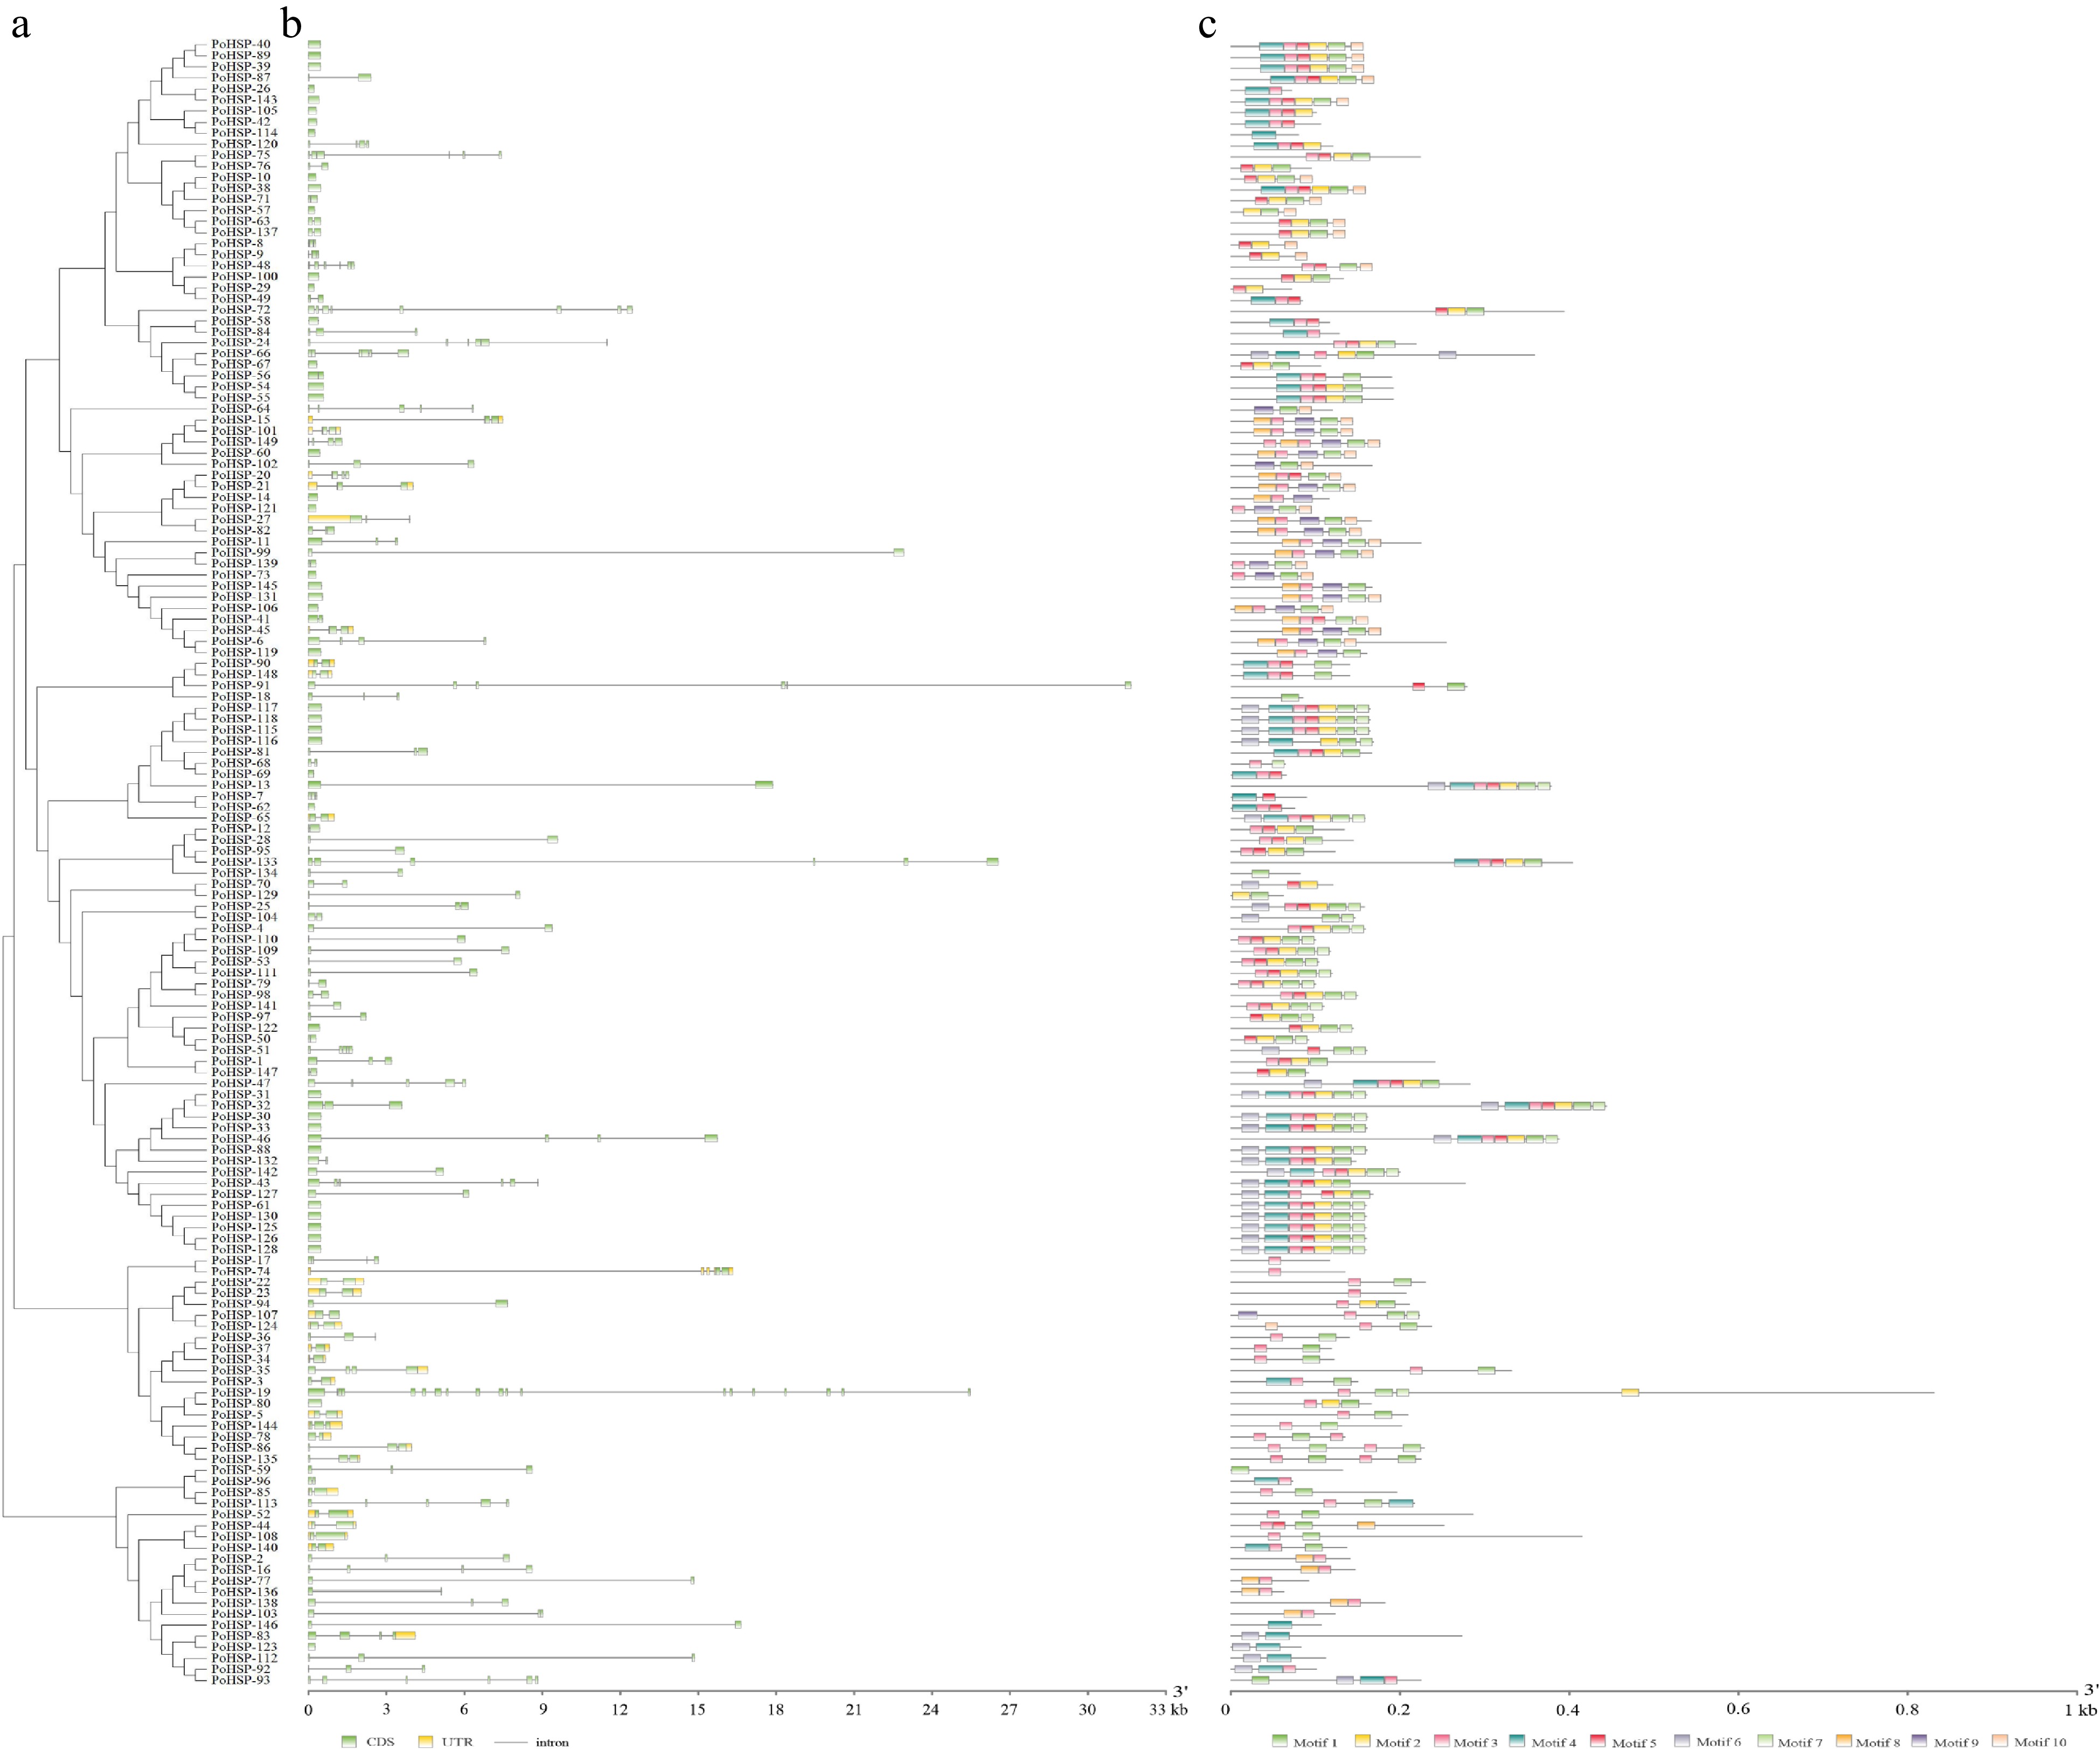
Figure 3.
Phylogenetic relationship, gene structure and conserved motif analysis of PoHSP20s. (a) The phylogenetic tree of 149 PoHSP20s. The unrooted neighbor-joining phylogenetic tree was constructed with MEGA11 using full-length amino acid sequences with 1,000 bootstrap replicates. (b) Exon/intron organization of PoHSP20s. Green and yellow box represents CDS and untranslated regions (UTR), and the black lines indicate introns, respectively. The length of sequence can be inferred by the scale at the bottom. (c) The distribution of conserved motifs in PoHSP20s. Ten putative motifs are indicated in different colored boxes, refer to Supplemental Table S2 for details.
-
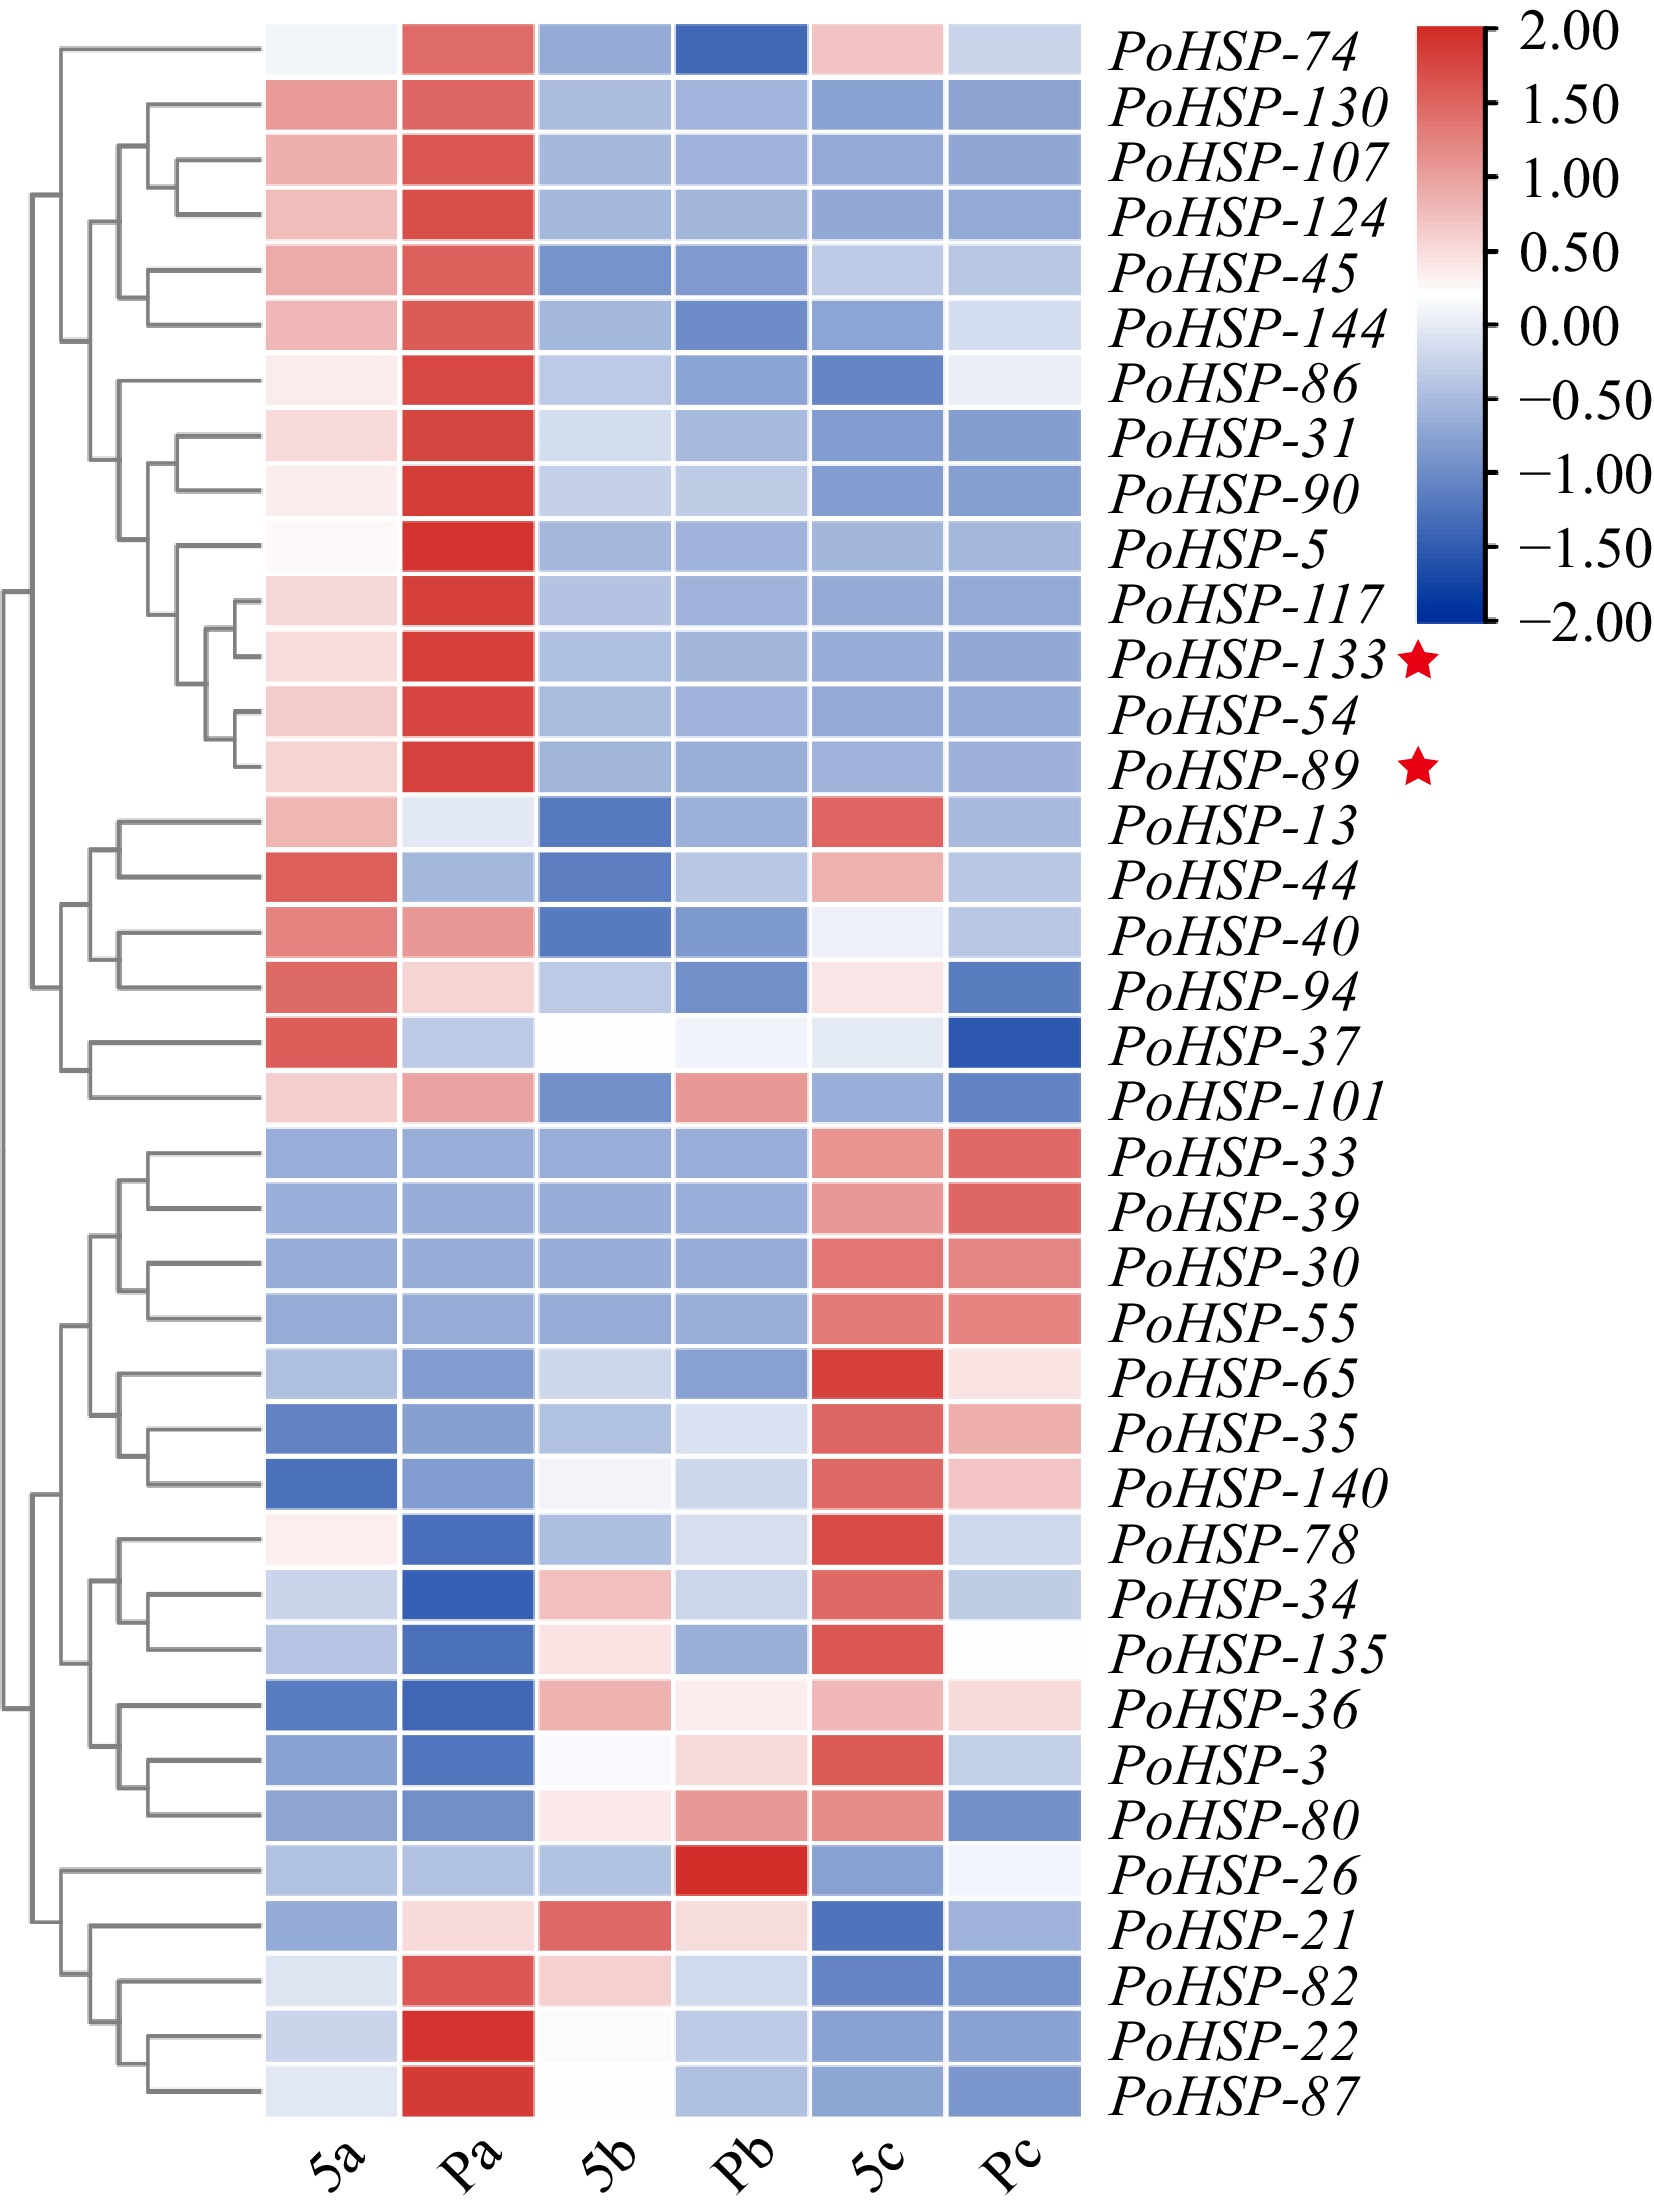
Figure 4.
Expression profiles of PoHSP20s in flower buds at different developmental stages of P. ostii with various carpels. Stage a, sepals and a few petal primordia appeared; stage b, stamen primordia initiated; stage c, carpel primordia initiated. 5, plants with five carpels; P, plants with more than 5 carpels (6−8 carpels). The stars indicate the genes for association analysis.
-

Figure 5.
Linkage disequilibrium and population structure of associated populations. (a), (b) Linkage disequilibrium analysis of PoHSP89 and PoHSP133, respectively. Different colors indicate standard (D'/LOD) values, from white to red, the value increased; the value in the box indicates R2 and was magnified 100 times. (c) Variation tendency of ΔK. (d) Population structure of associated group when K = 3.
-
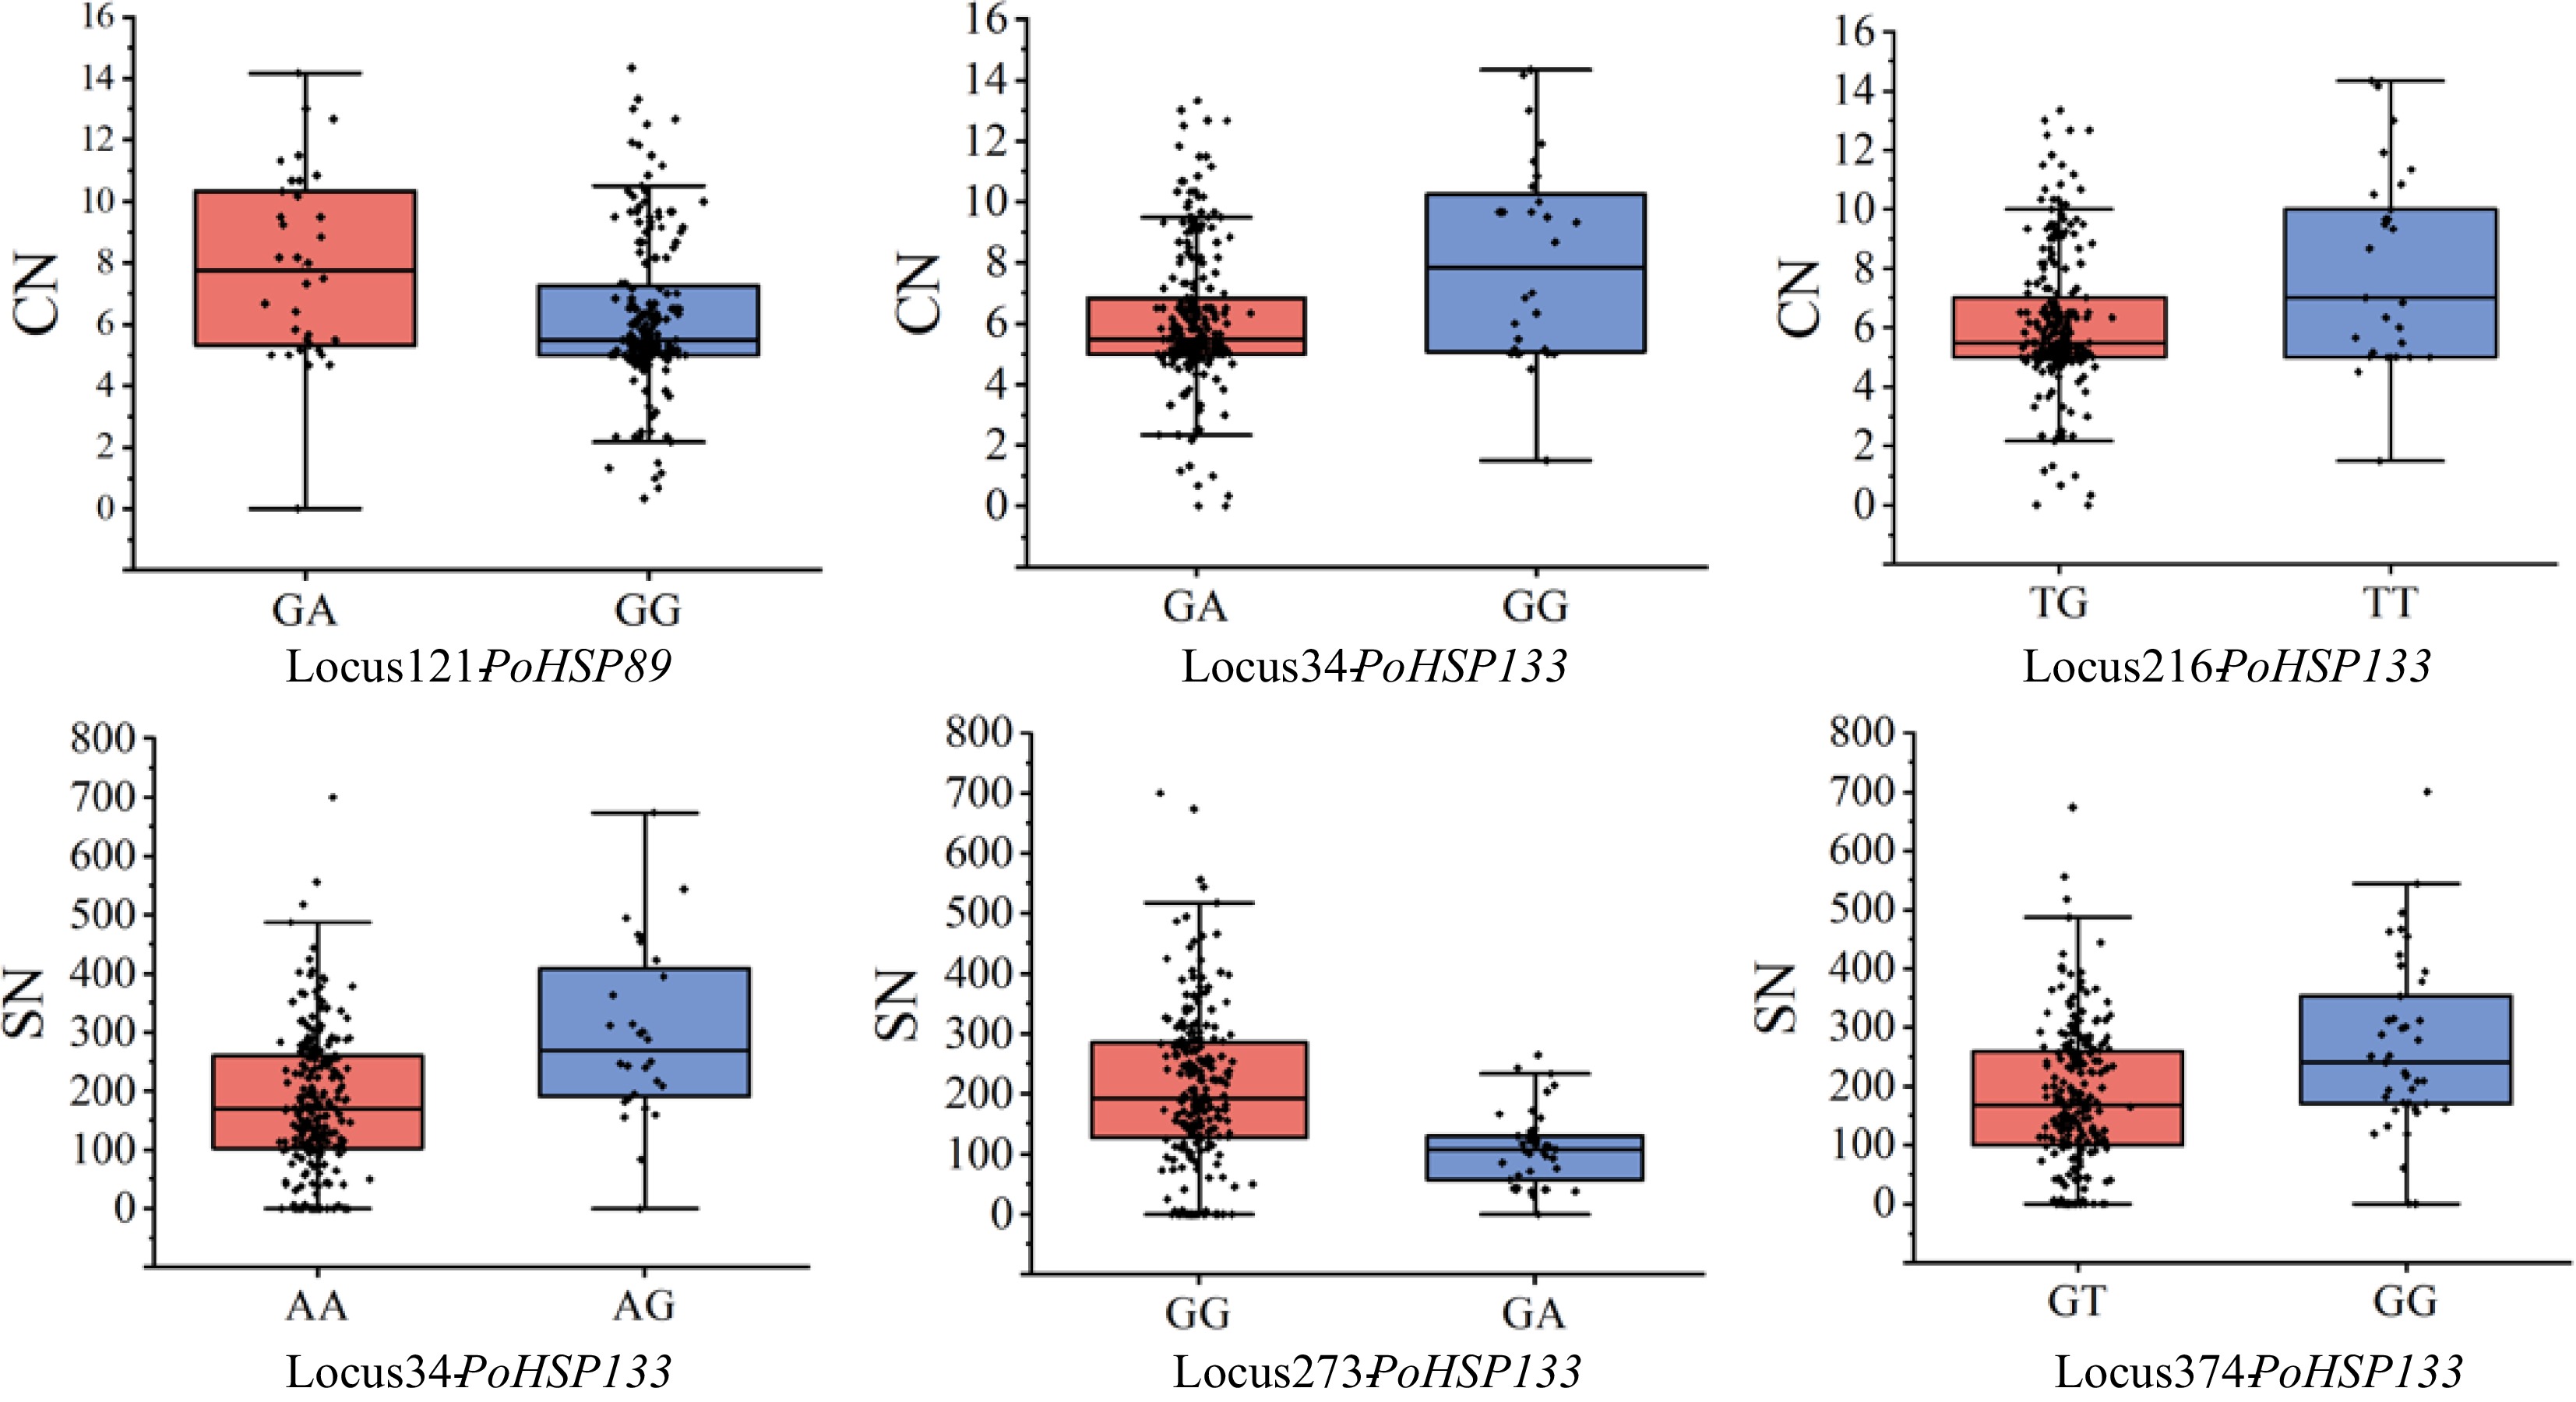
Figure 6.
Phenotypic variation of partly significantly associated loci of PoHSP89 and PoHSP133. CN, carpel number; SN, stamen number.
-
No. Trait Gene Locus SNP/Indel p value R2/% 1 CN PoHSP89 121 A/G 0.0028 4.06 2 CN PoHSP89 225 T/C 0.0199 2.48 3 CN PoHSP89 393 C/T 0.0484 1.79 4 PeN PoHSP89 436 A/G 0.0236 2.31 5 SN PoHSP89 342 A/C 0.0411 1.88 6 SN PoHSP89 402 A/G 0.0191 2.46 7 SN PoHSP89 403 T/C 0.0361 1.97 8 CN PoHSP133 5 C/A 0.0084 3.54 9 CN PoHSP133 34 G/A 0.0000 7.03 10 CN PoHSP133 150 C/T 0.0028 3.31 11 CN PoHSP133 216 T/G 0.0000 6.51 12 CN PoHSP133 237 A/G 0.0016 3.69 13 CN PoHSP133 374 G/T 0.0007 4.22 14 PeN PoHSP133 237 A/G 0.0008 3.87 15 PeN PoHSP133 373 C/T 0.0166 2.02 16 SN PoHSP133 5 C/A 0.0264 2.74 17 SN PoHSP133 34 G/A 0.0000 9.16 18 SN PoHSP133 150 C/T 0.0001 5.75 19 SN PoHSP133 210 G/A 0.0242 1.92 20 SN PoHSP133 216 T/G 0.0002 5.26 21 SN PoHSP133 218 G/A 0.0026 3.41 22 SN PoHSP133 219 C/T 0.0012 3.92 23 SN PoHSP133 237 A/G 0.0000 12.37 24 SN PoHSP133 373 C/T 0.0002 5.34 25 SN PoHSP133 374 G/T 0.0000 6.78 26 SN PoHSP133 393 C/A 0.0084 2.62 Table 1.
Associated combinations of PoHSP89 and PoSHP133 with flower organ number.
Figures
(6)
Tables
(1)