-
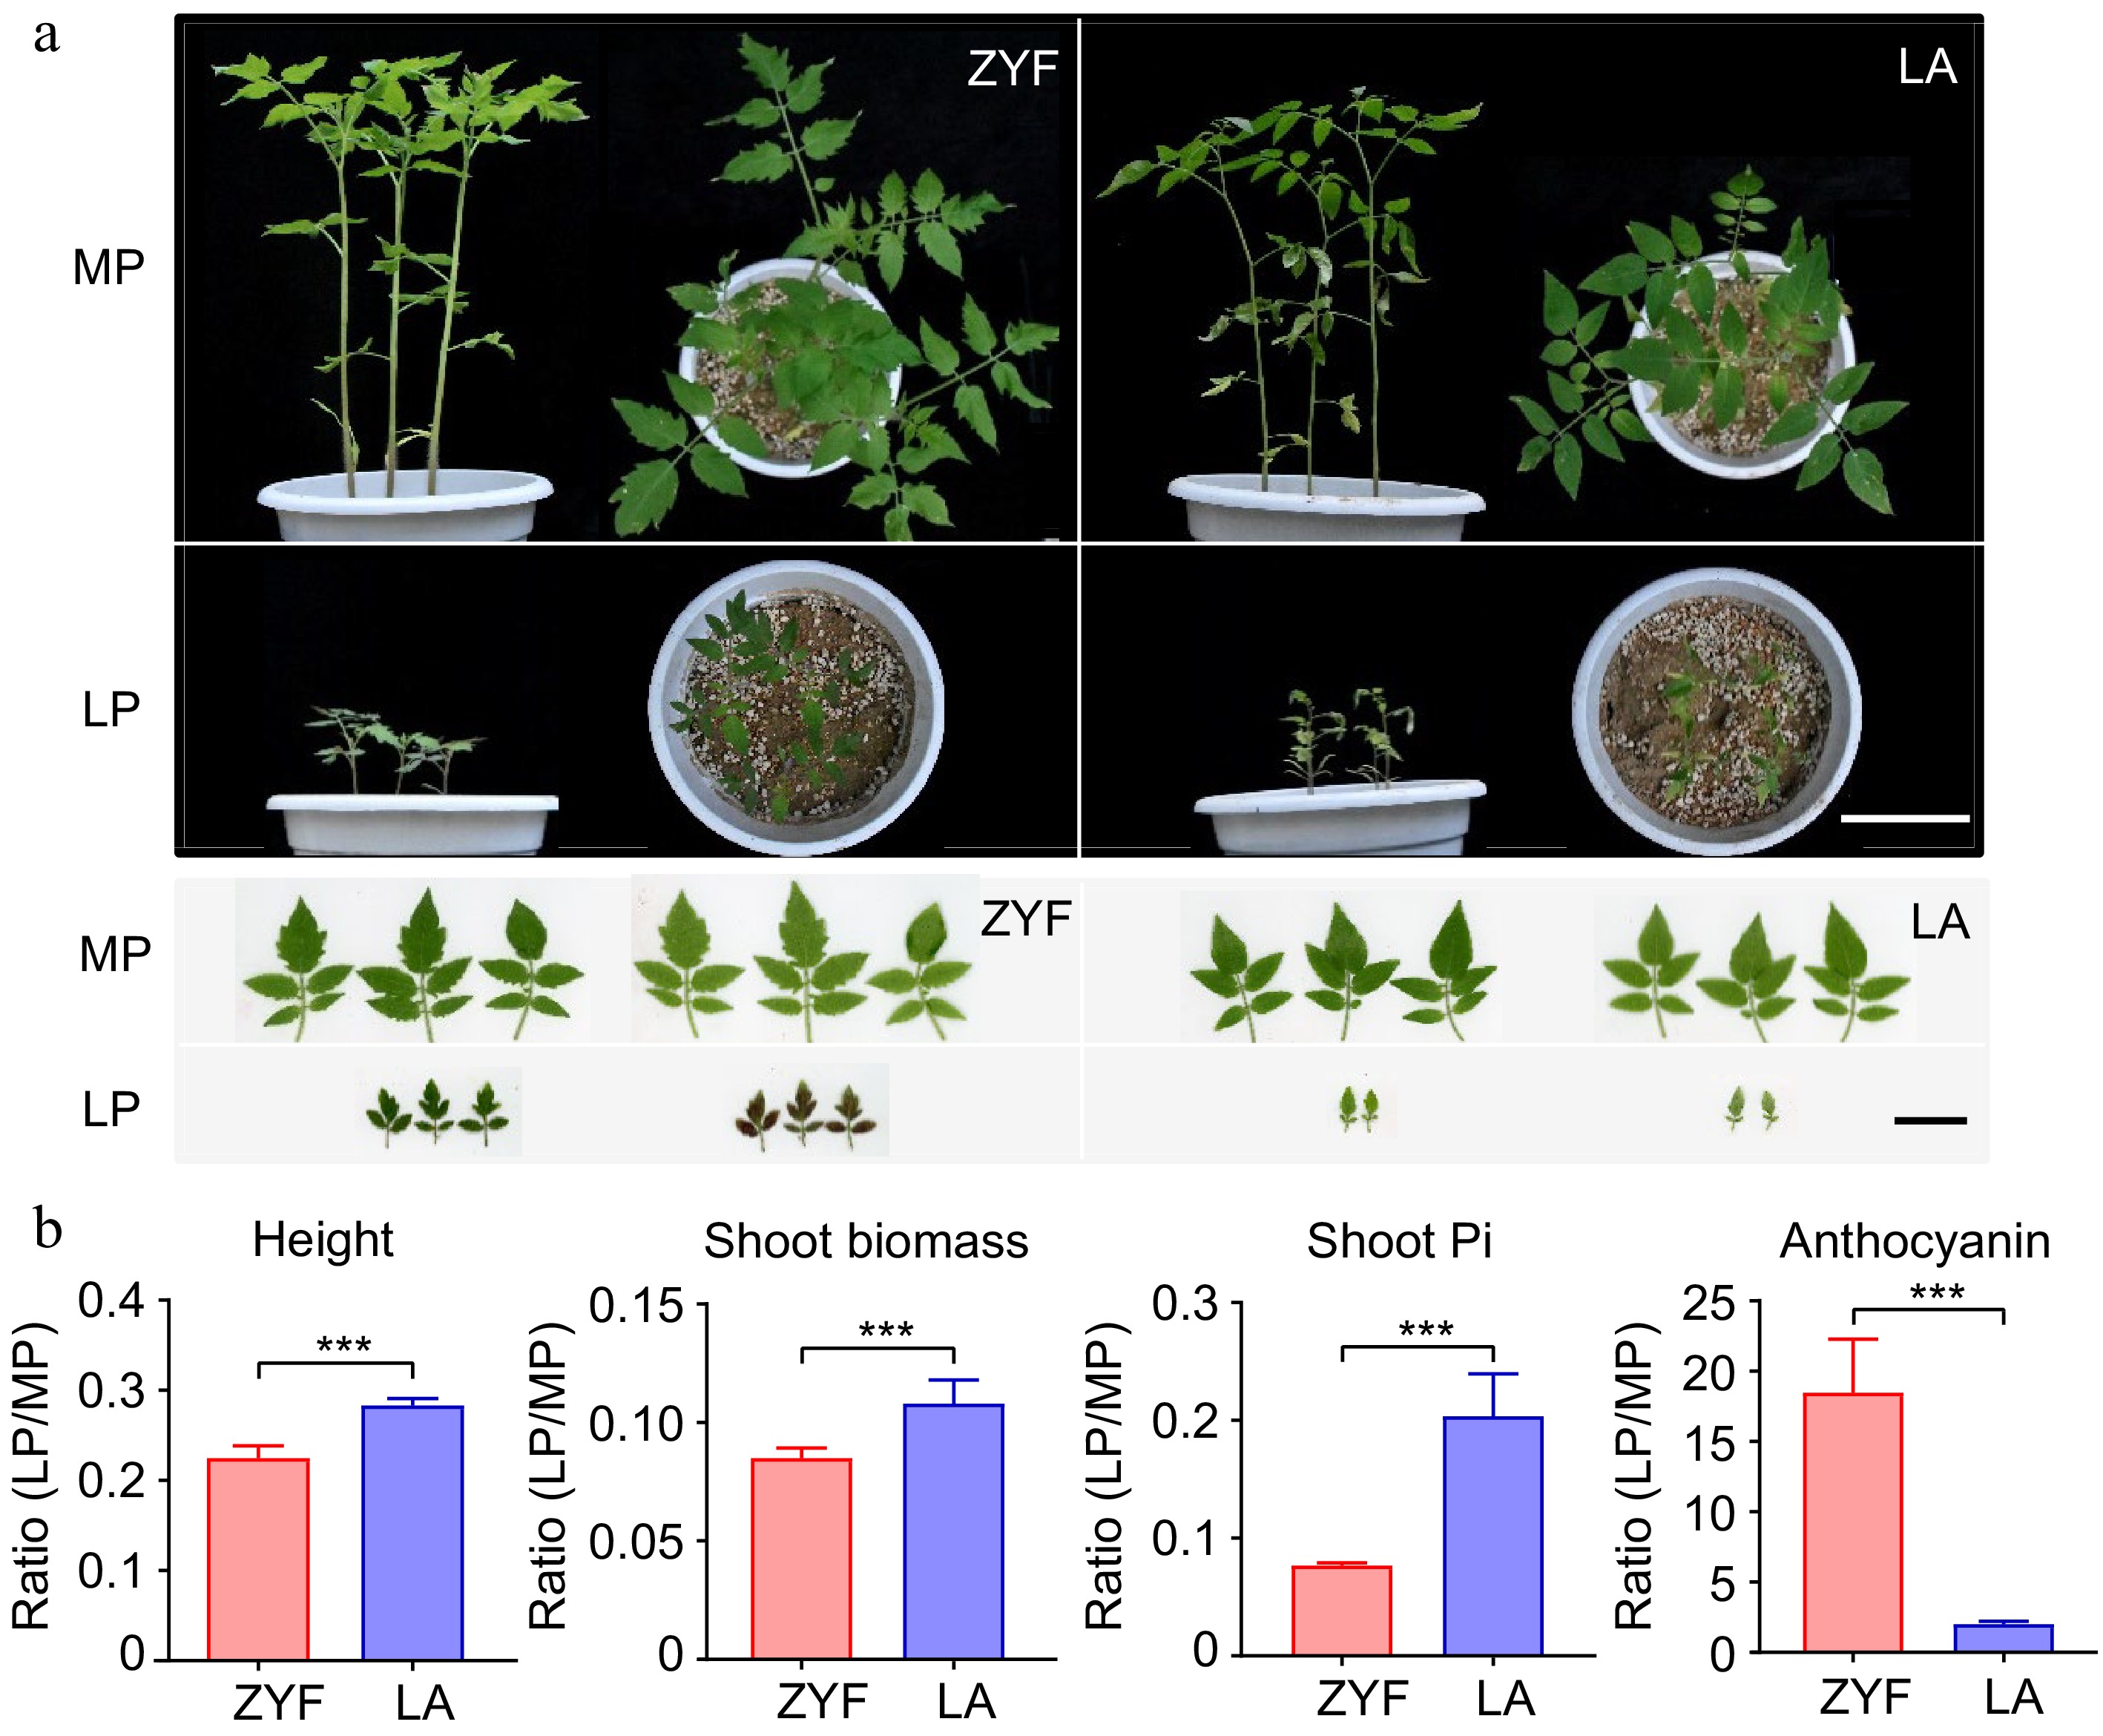
Figure 1.
Plant growth, Pi concentration and anthocyanin content of domesticated tomato ZYF and its wild relatives LA under MP and LP treatments. (a) Plant growth and leaf morphology of the two accessions. Left and right panels on a black background for each accession are the front and top view of the pots, respectively. Scale bar = 10 cm. Left and right panels on a white background for each accession are the obverse and reverse of leaves, respectively. Scale bar = 3 cm. (b) LP: MP ratio values of the physiological responses (represented by height, shoot biomass, shoot Pi and anthocyanin) between the two tomato accessions. Data and error bars were means ± SD and significance testing was analyzed between the two accessions using t-test (* p < 0.05, ** p < 0.01, *** p < 0.001). MP, Moderate P; LP, Low P.
-
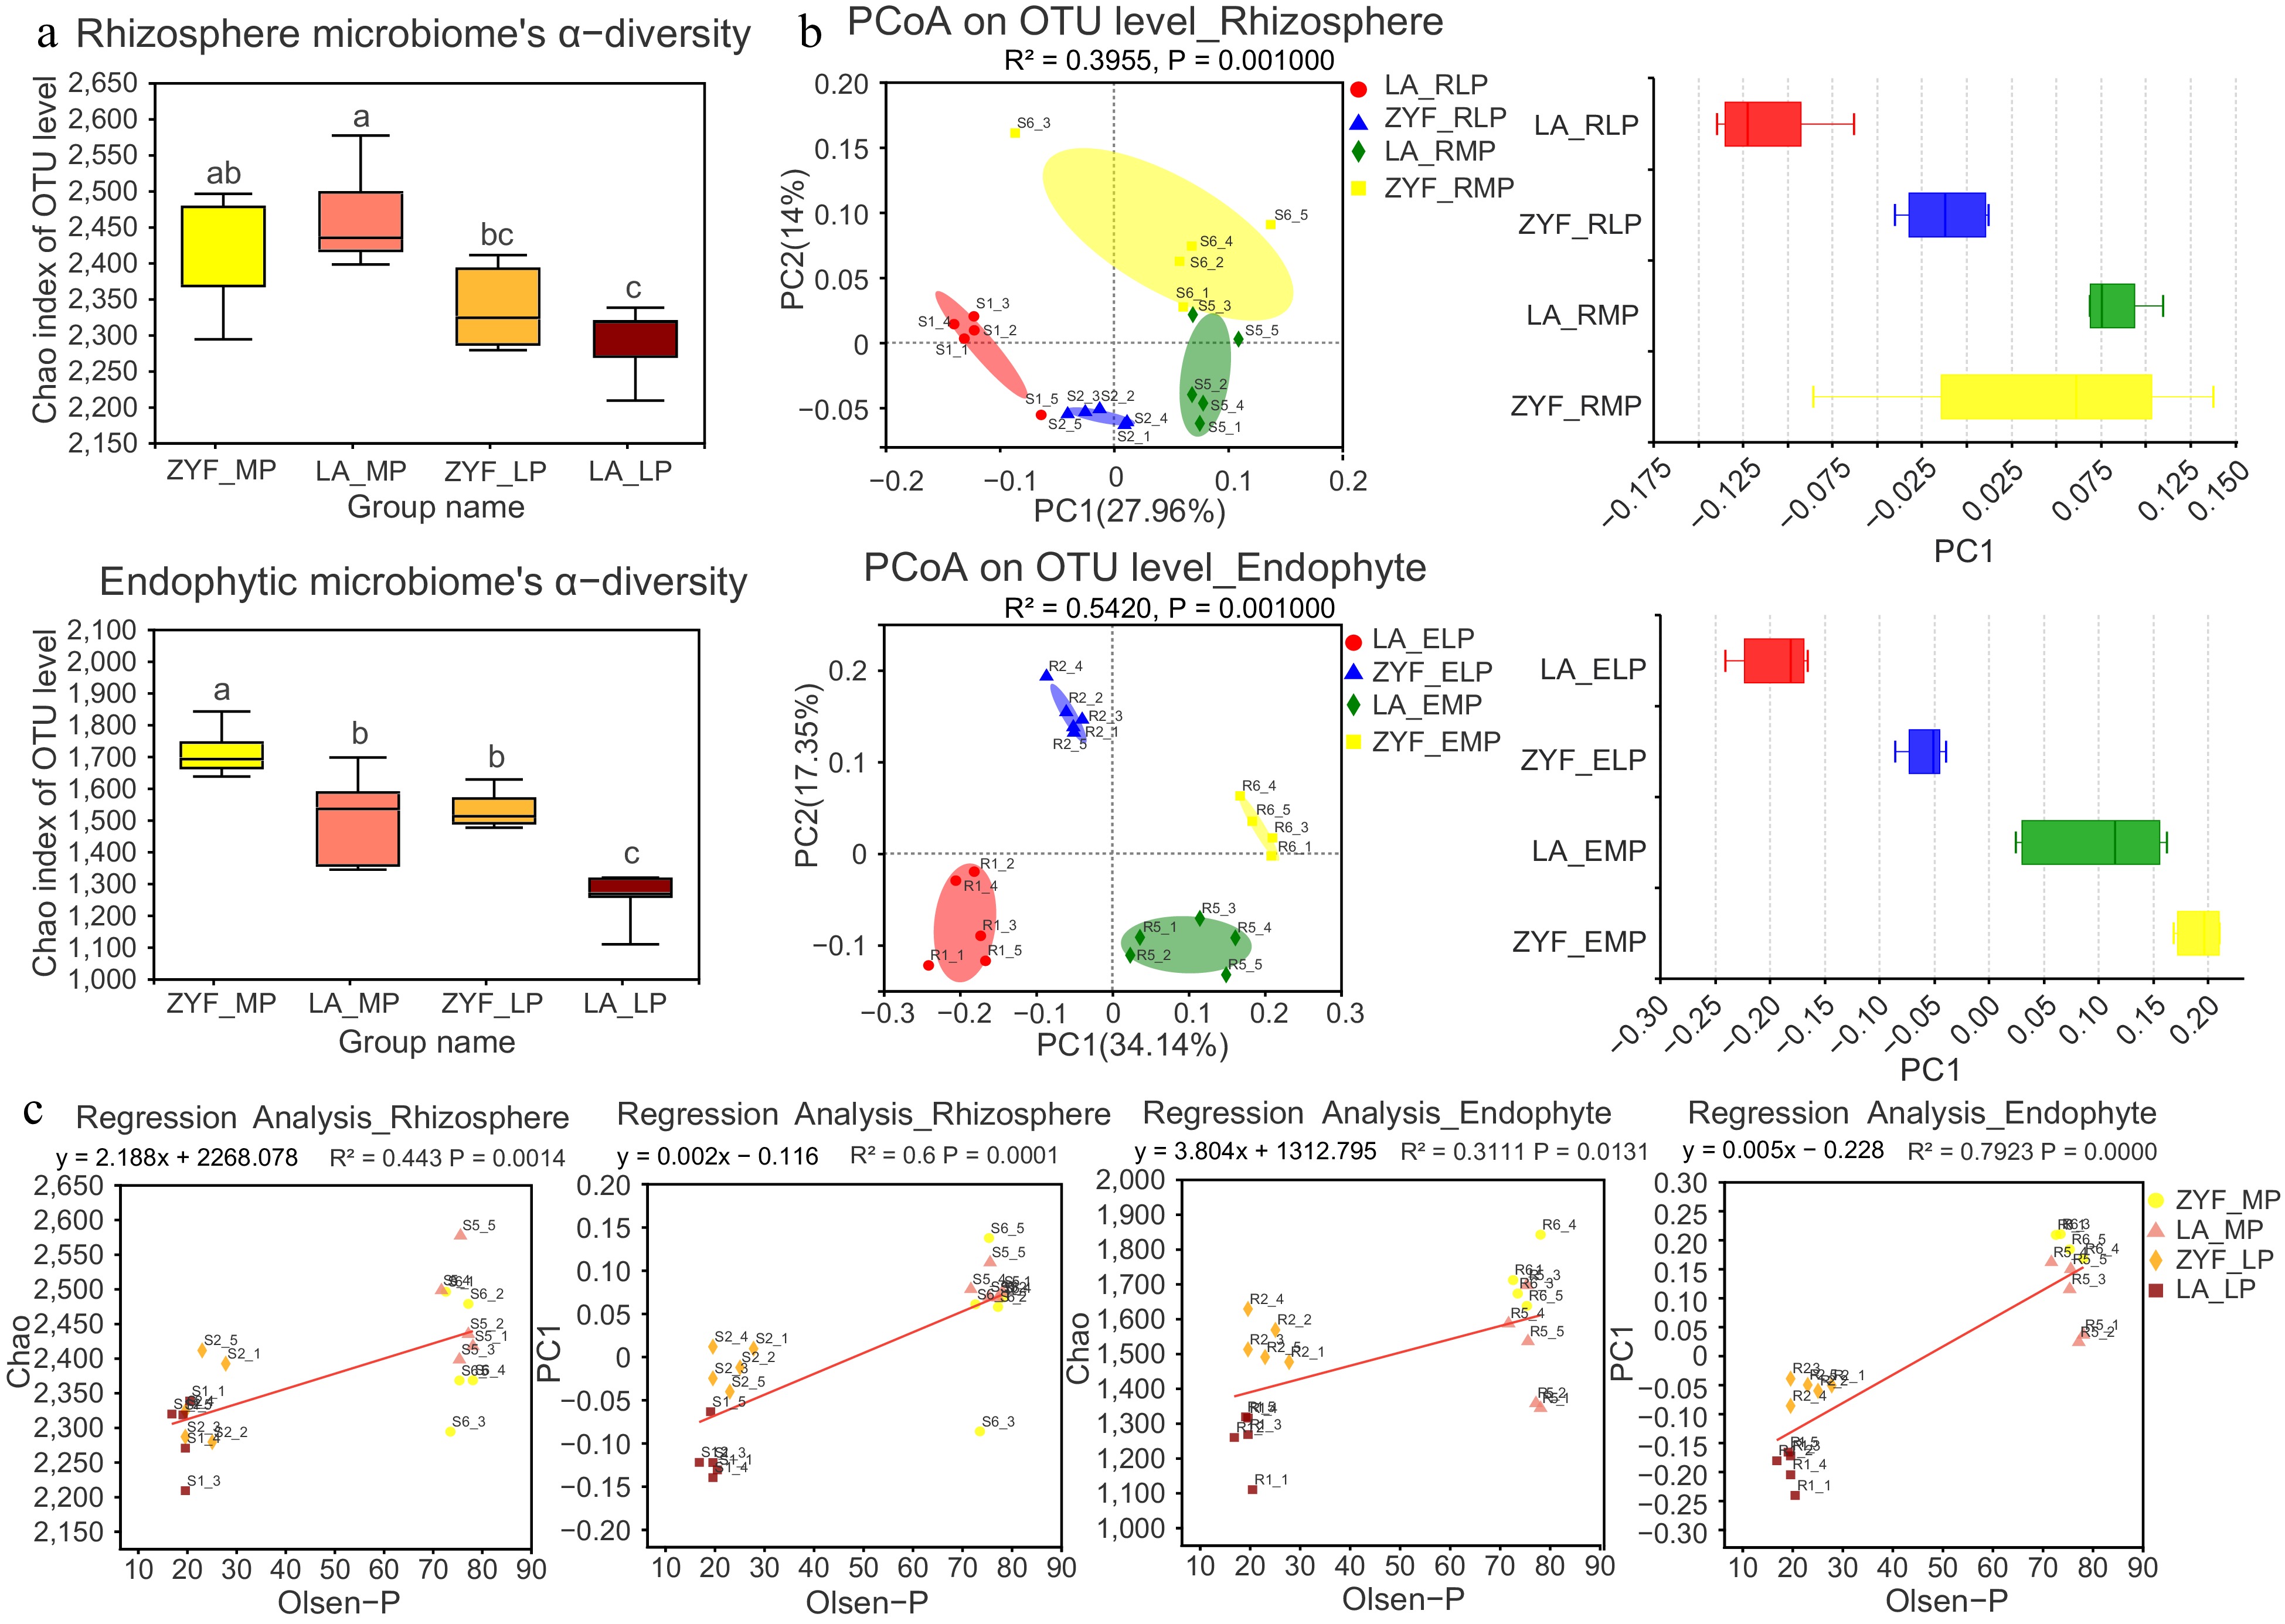
Figure 2.
The α-diversity and β-diversity of bacterial community and their correlation with soil P contents. (a) The α-diversity calculated by using Chao index of 16S rRNA sequences in rhizosphere and endophytic bacterial community of ZYF and LA samples under MP and LP treatments. Statistically significant differences were determined by one-way ANOVA followed by post hoc test (p < 0.05). (b) The β-diversity represented by Principal Coordinate Analysis (PcoA) analysis based on bray_curtis dissimilarities (left panel) depicts the similarity and differences of the rhizosphere and endophytic bacterial community in ZYF and LA samples. The boxplots (right panel) showed discrete distribution of different groups of samples along the PC1 axis. (c) Linear regression reveals the correlation between rhizosphere/endophytic microbial diversity (Chao and PC1) and Olsen-P. R2 represented the percentage of variability explained by the regression line.
-
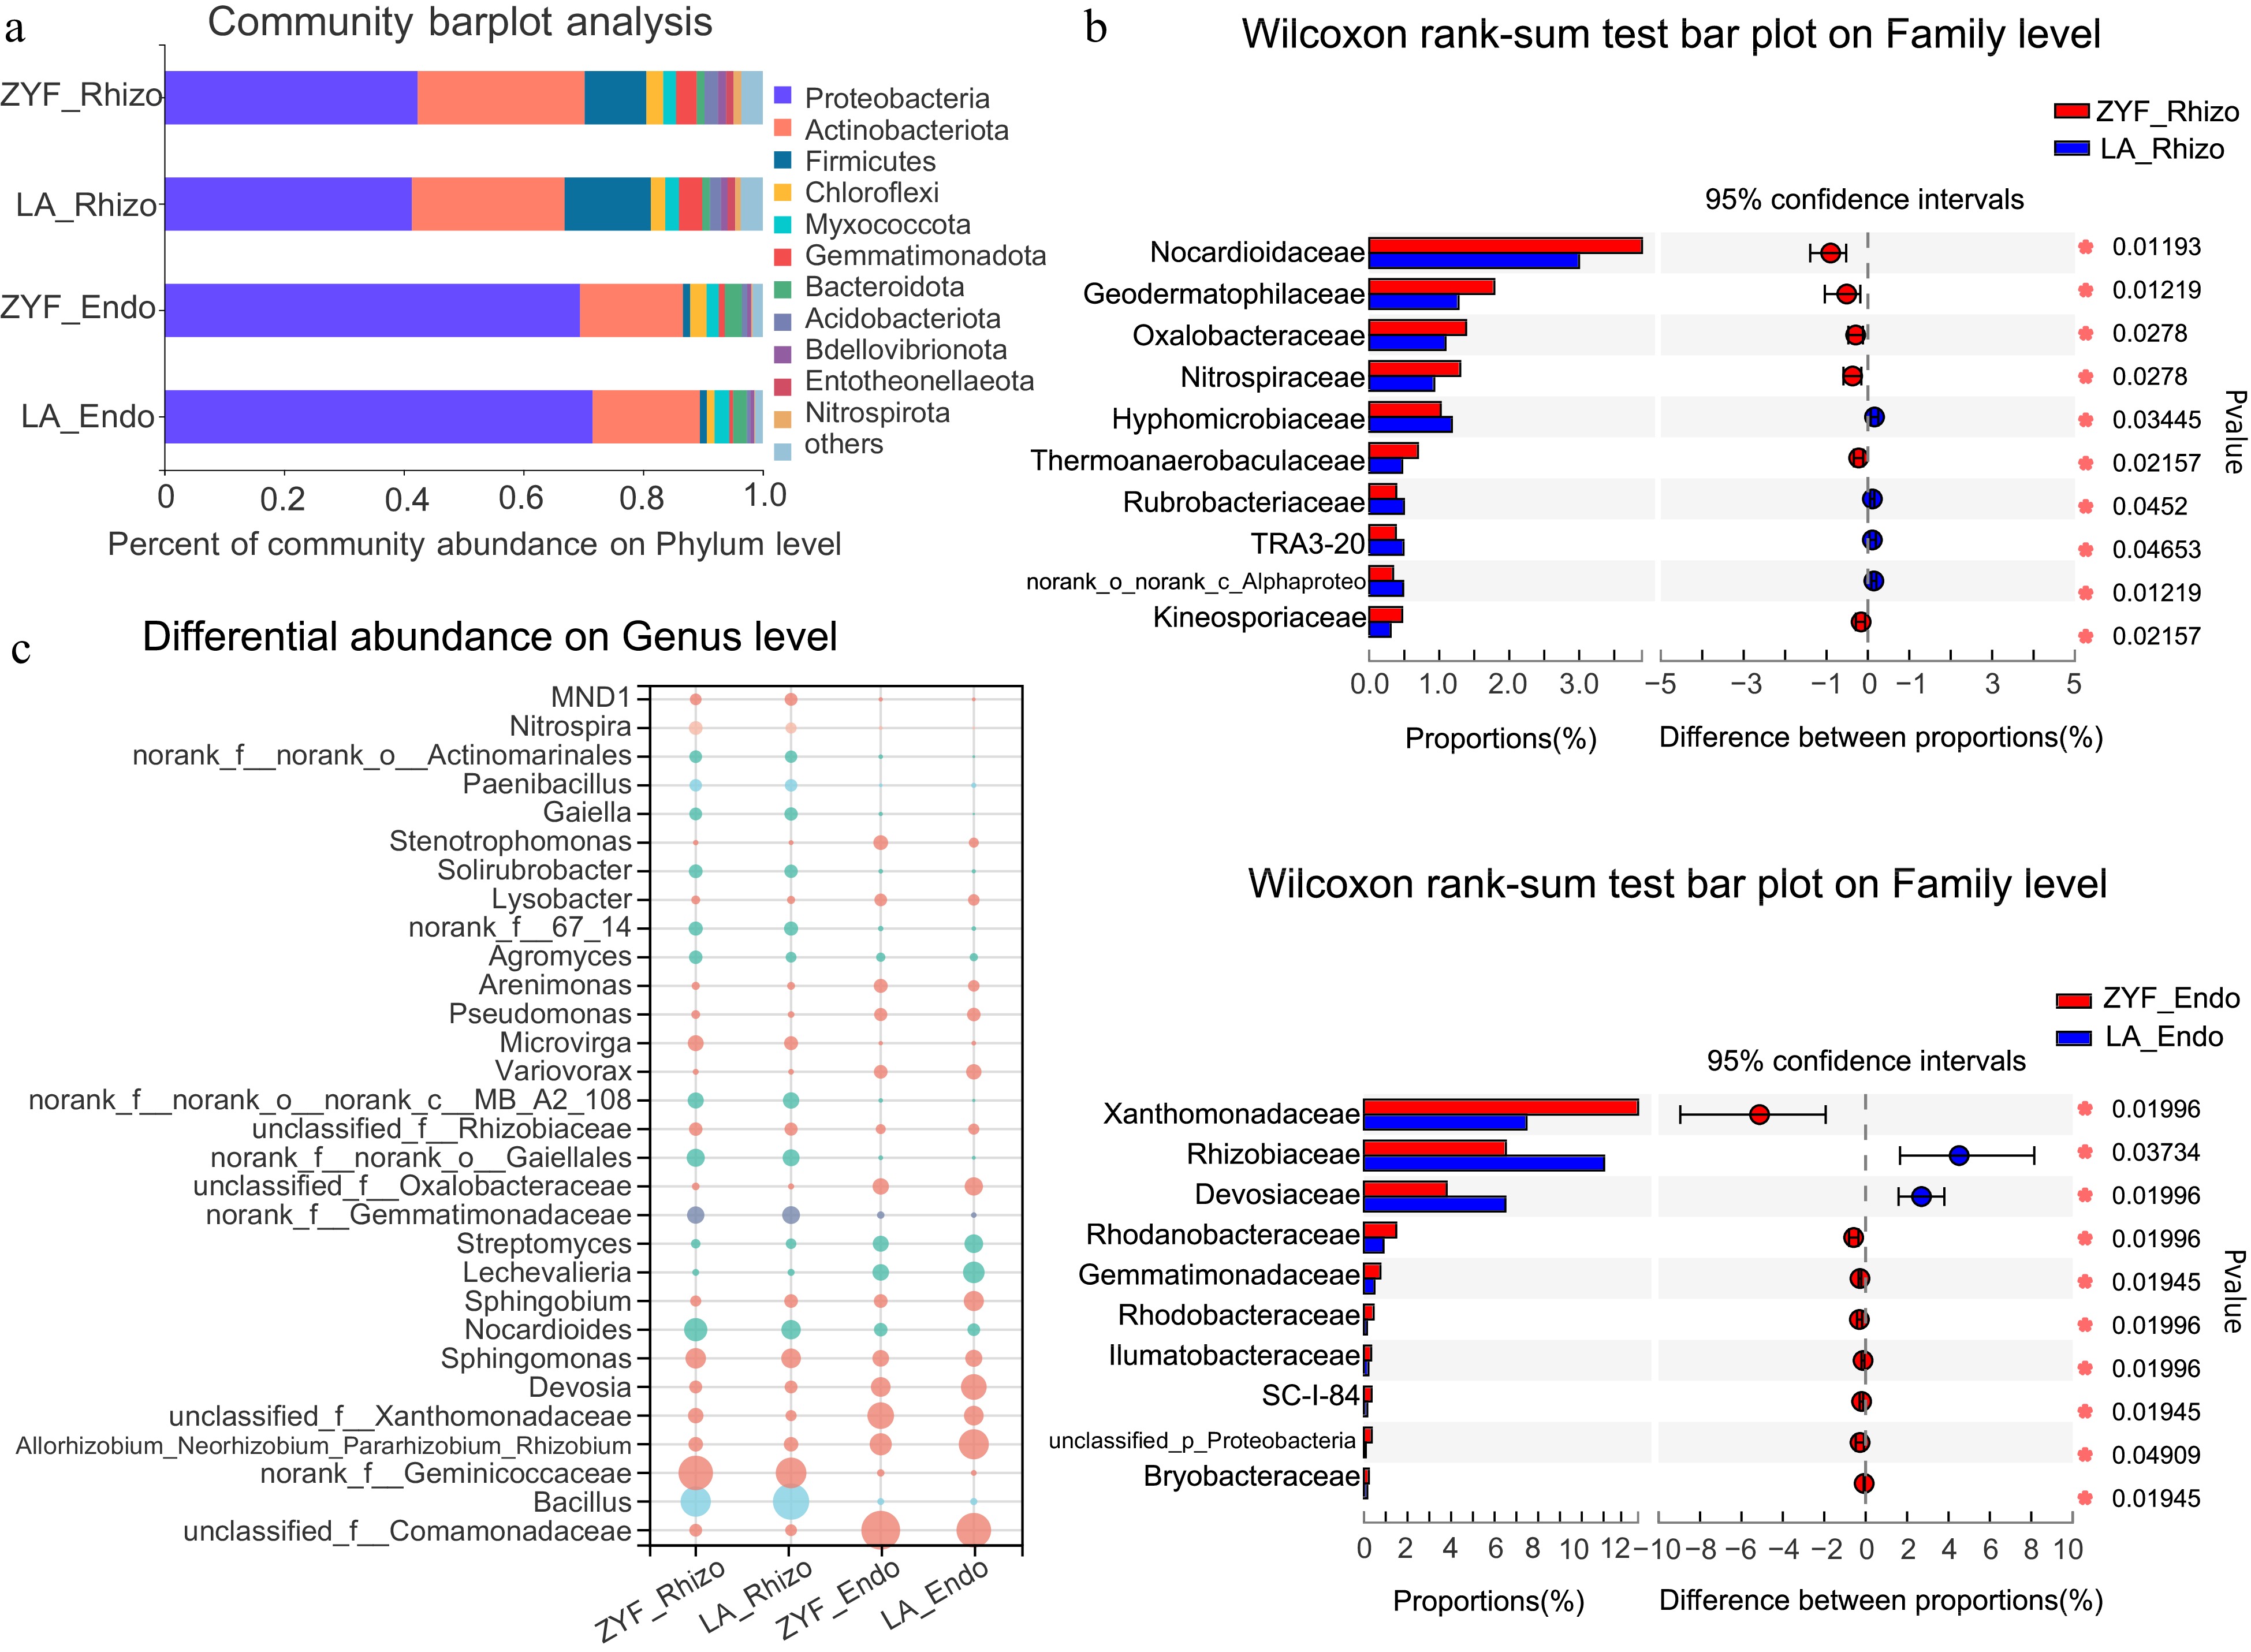
Figure 3.
Differential abundance of rhizosphere/endophytic bacterial community between ZYF and LA under MP treatment at (a) phylum, (b) family, and (c) genus levels. (a) Bacterial community barplot analysis depicting the relative abundance of the rhizosphere/endophytic microbial communities of ZYF and LA at the phylum level. (b) Wilcoxon rank-sum tests followed by fdr corrections were performed between rhizosphere (top) and endophytic (bottom) bacterial communities of ZYF and LA under MP conditions at the family level. (c) Bubble plot showing the abundance (depicted by size) and the higher taxon (depicted by color) at the phylum level of the top 30 abundant microbial genera present in the rhizosphere/endophytic microbial communities of ZYF and LA.
-
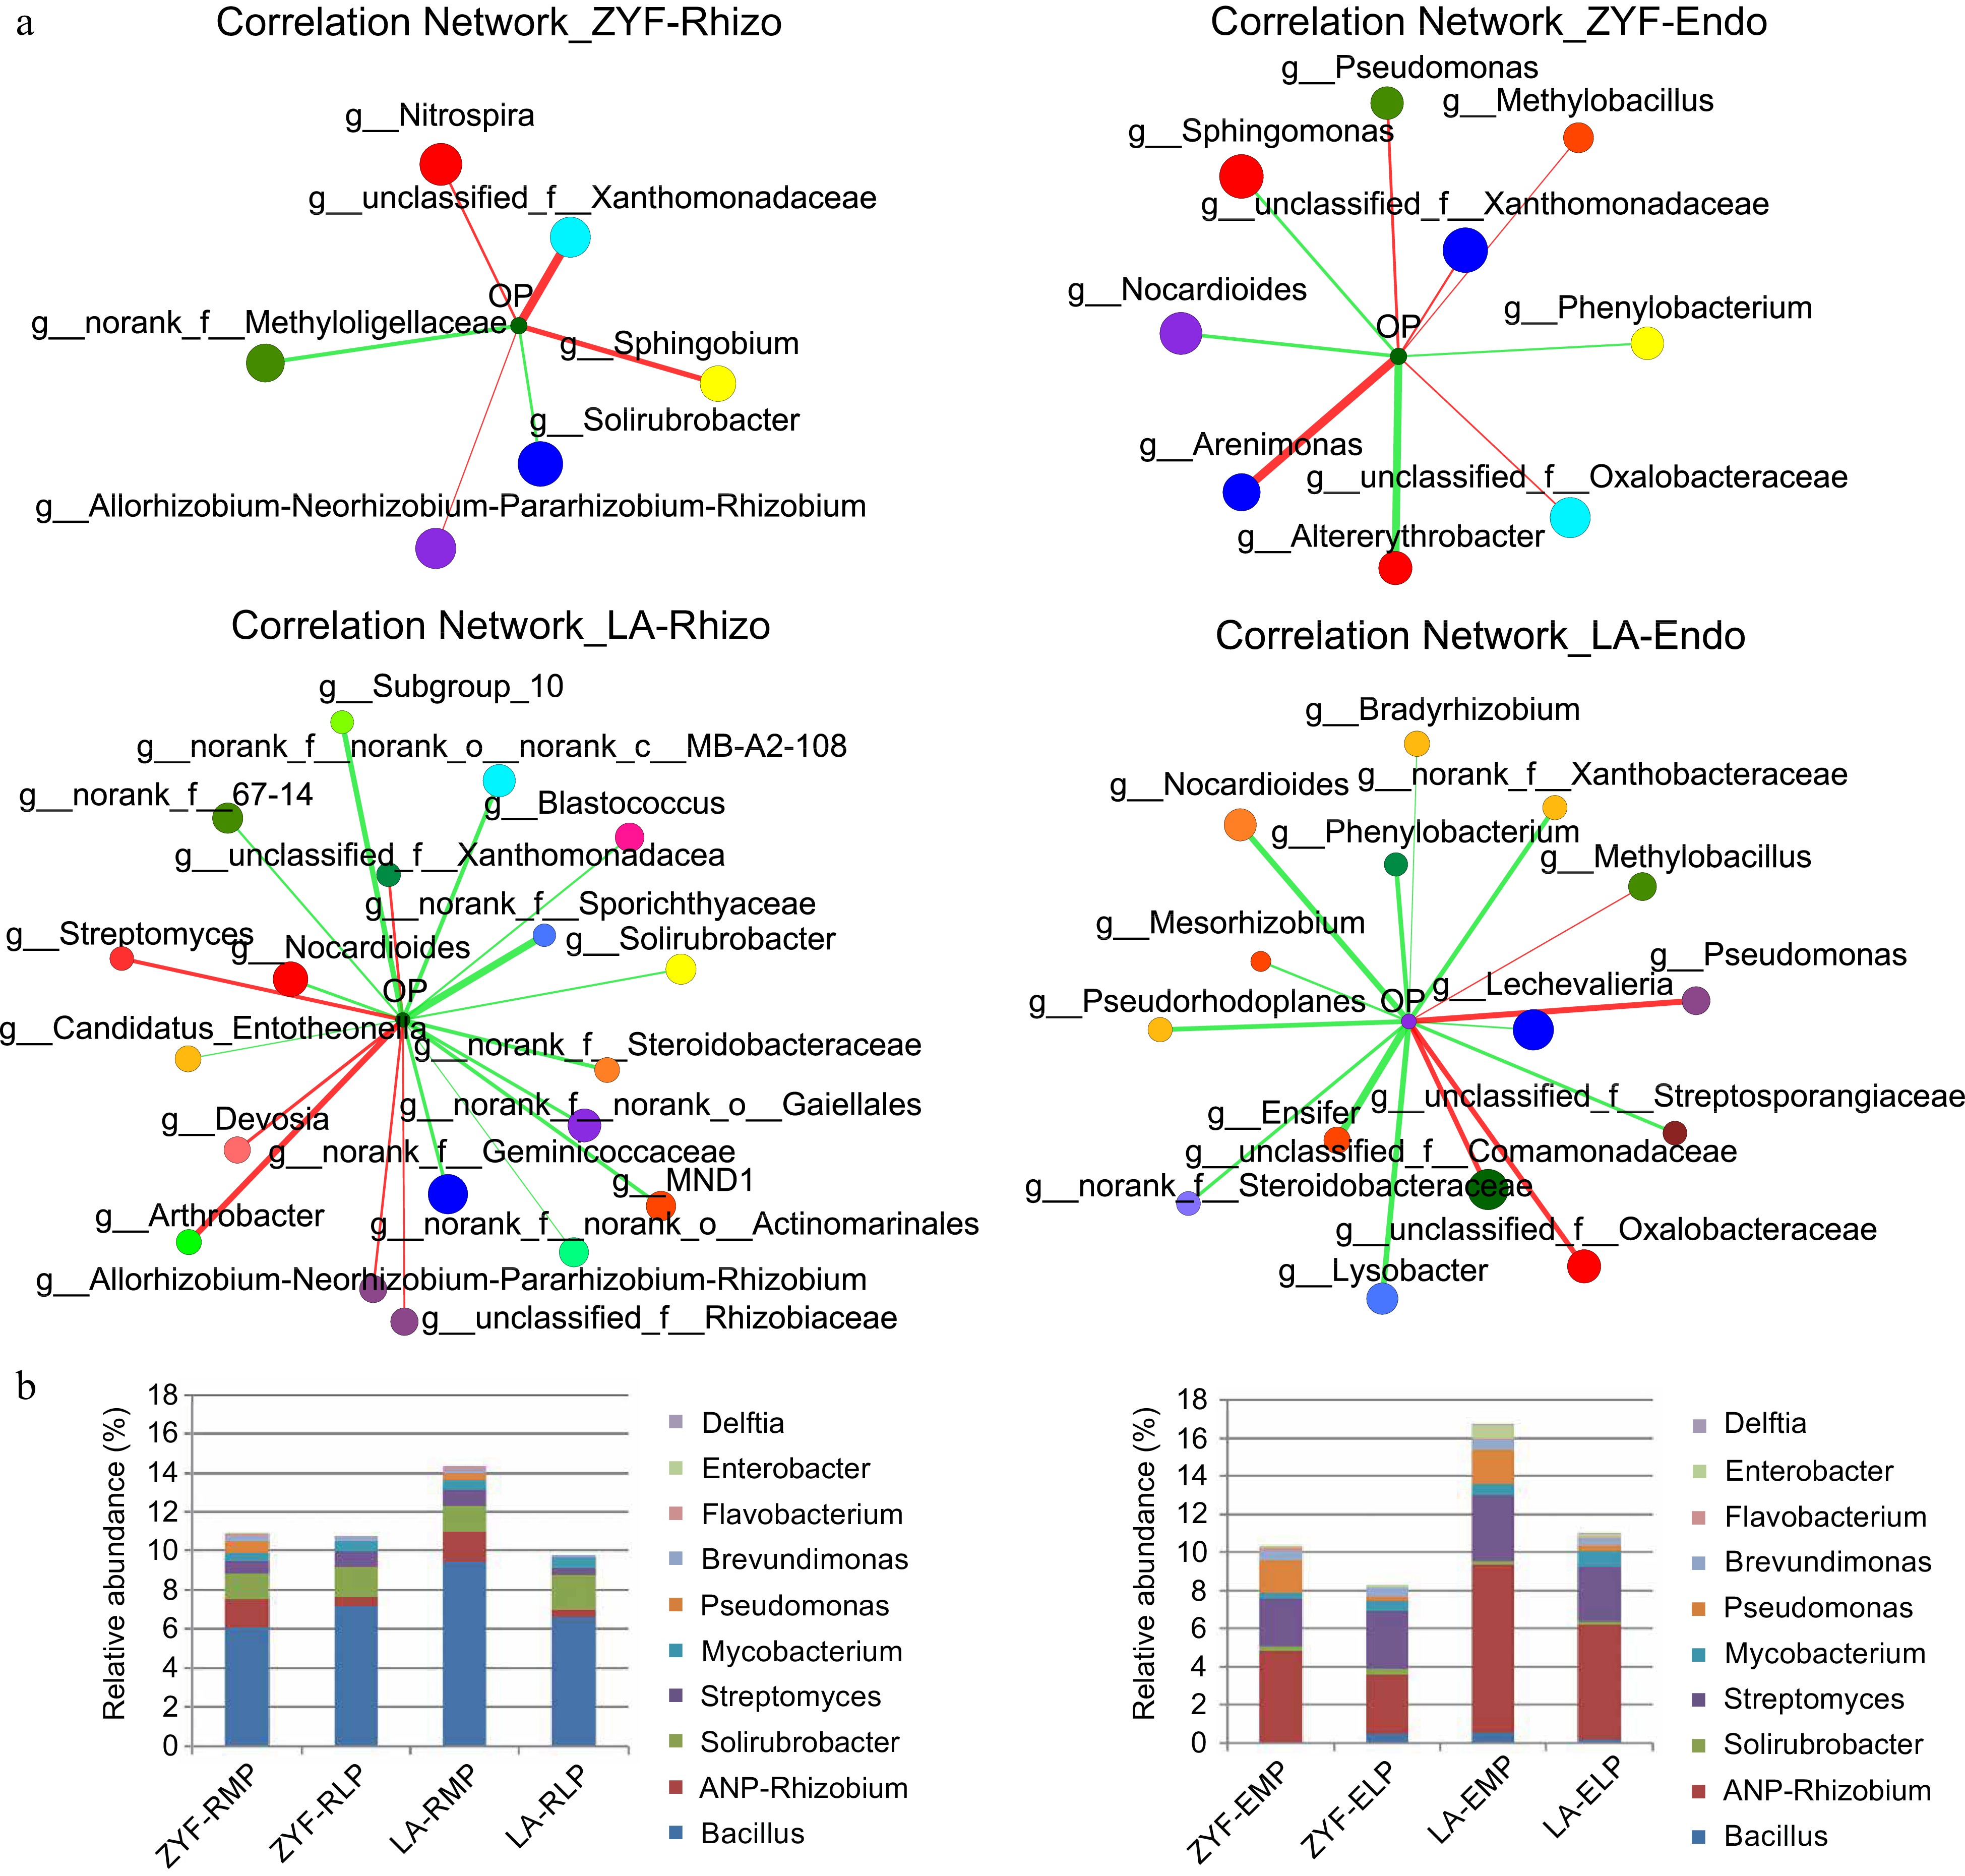
Figure 4.
Enriched microbial genera and PSB proportions in ZYF and LA. (a) Two-way correlation networks based on Spearman correlation coefficients showed interaction between environmental factor (soil Olsen-P) and top 50 bacterial composition of total abundance on genus level (absolute value of correlation coefficient ≥ 0.5, p-value < 0.05). The size and color of the node represented bacterial species abundance and the corresponding family it belongs to, respectively. The color and the width of the connecting lines were the nature and the strength of correlation. Red and green lines correspond to positive and negative correlation. (b) The relative abundance of several phosphate solubilizing bacteria (PSB) genera in the rhizosphere/endophytic microbial communities of ZYF and LA. ANP-Rhizobium, Allorhizobium- Neorhizobium-Pararhizobium-Rhizobium.
-
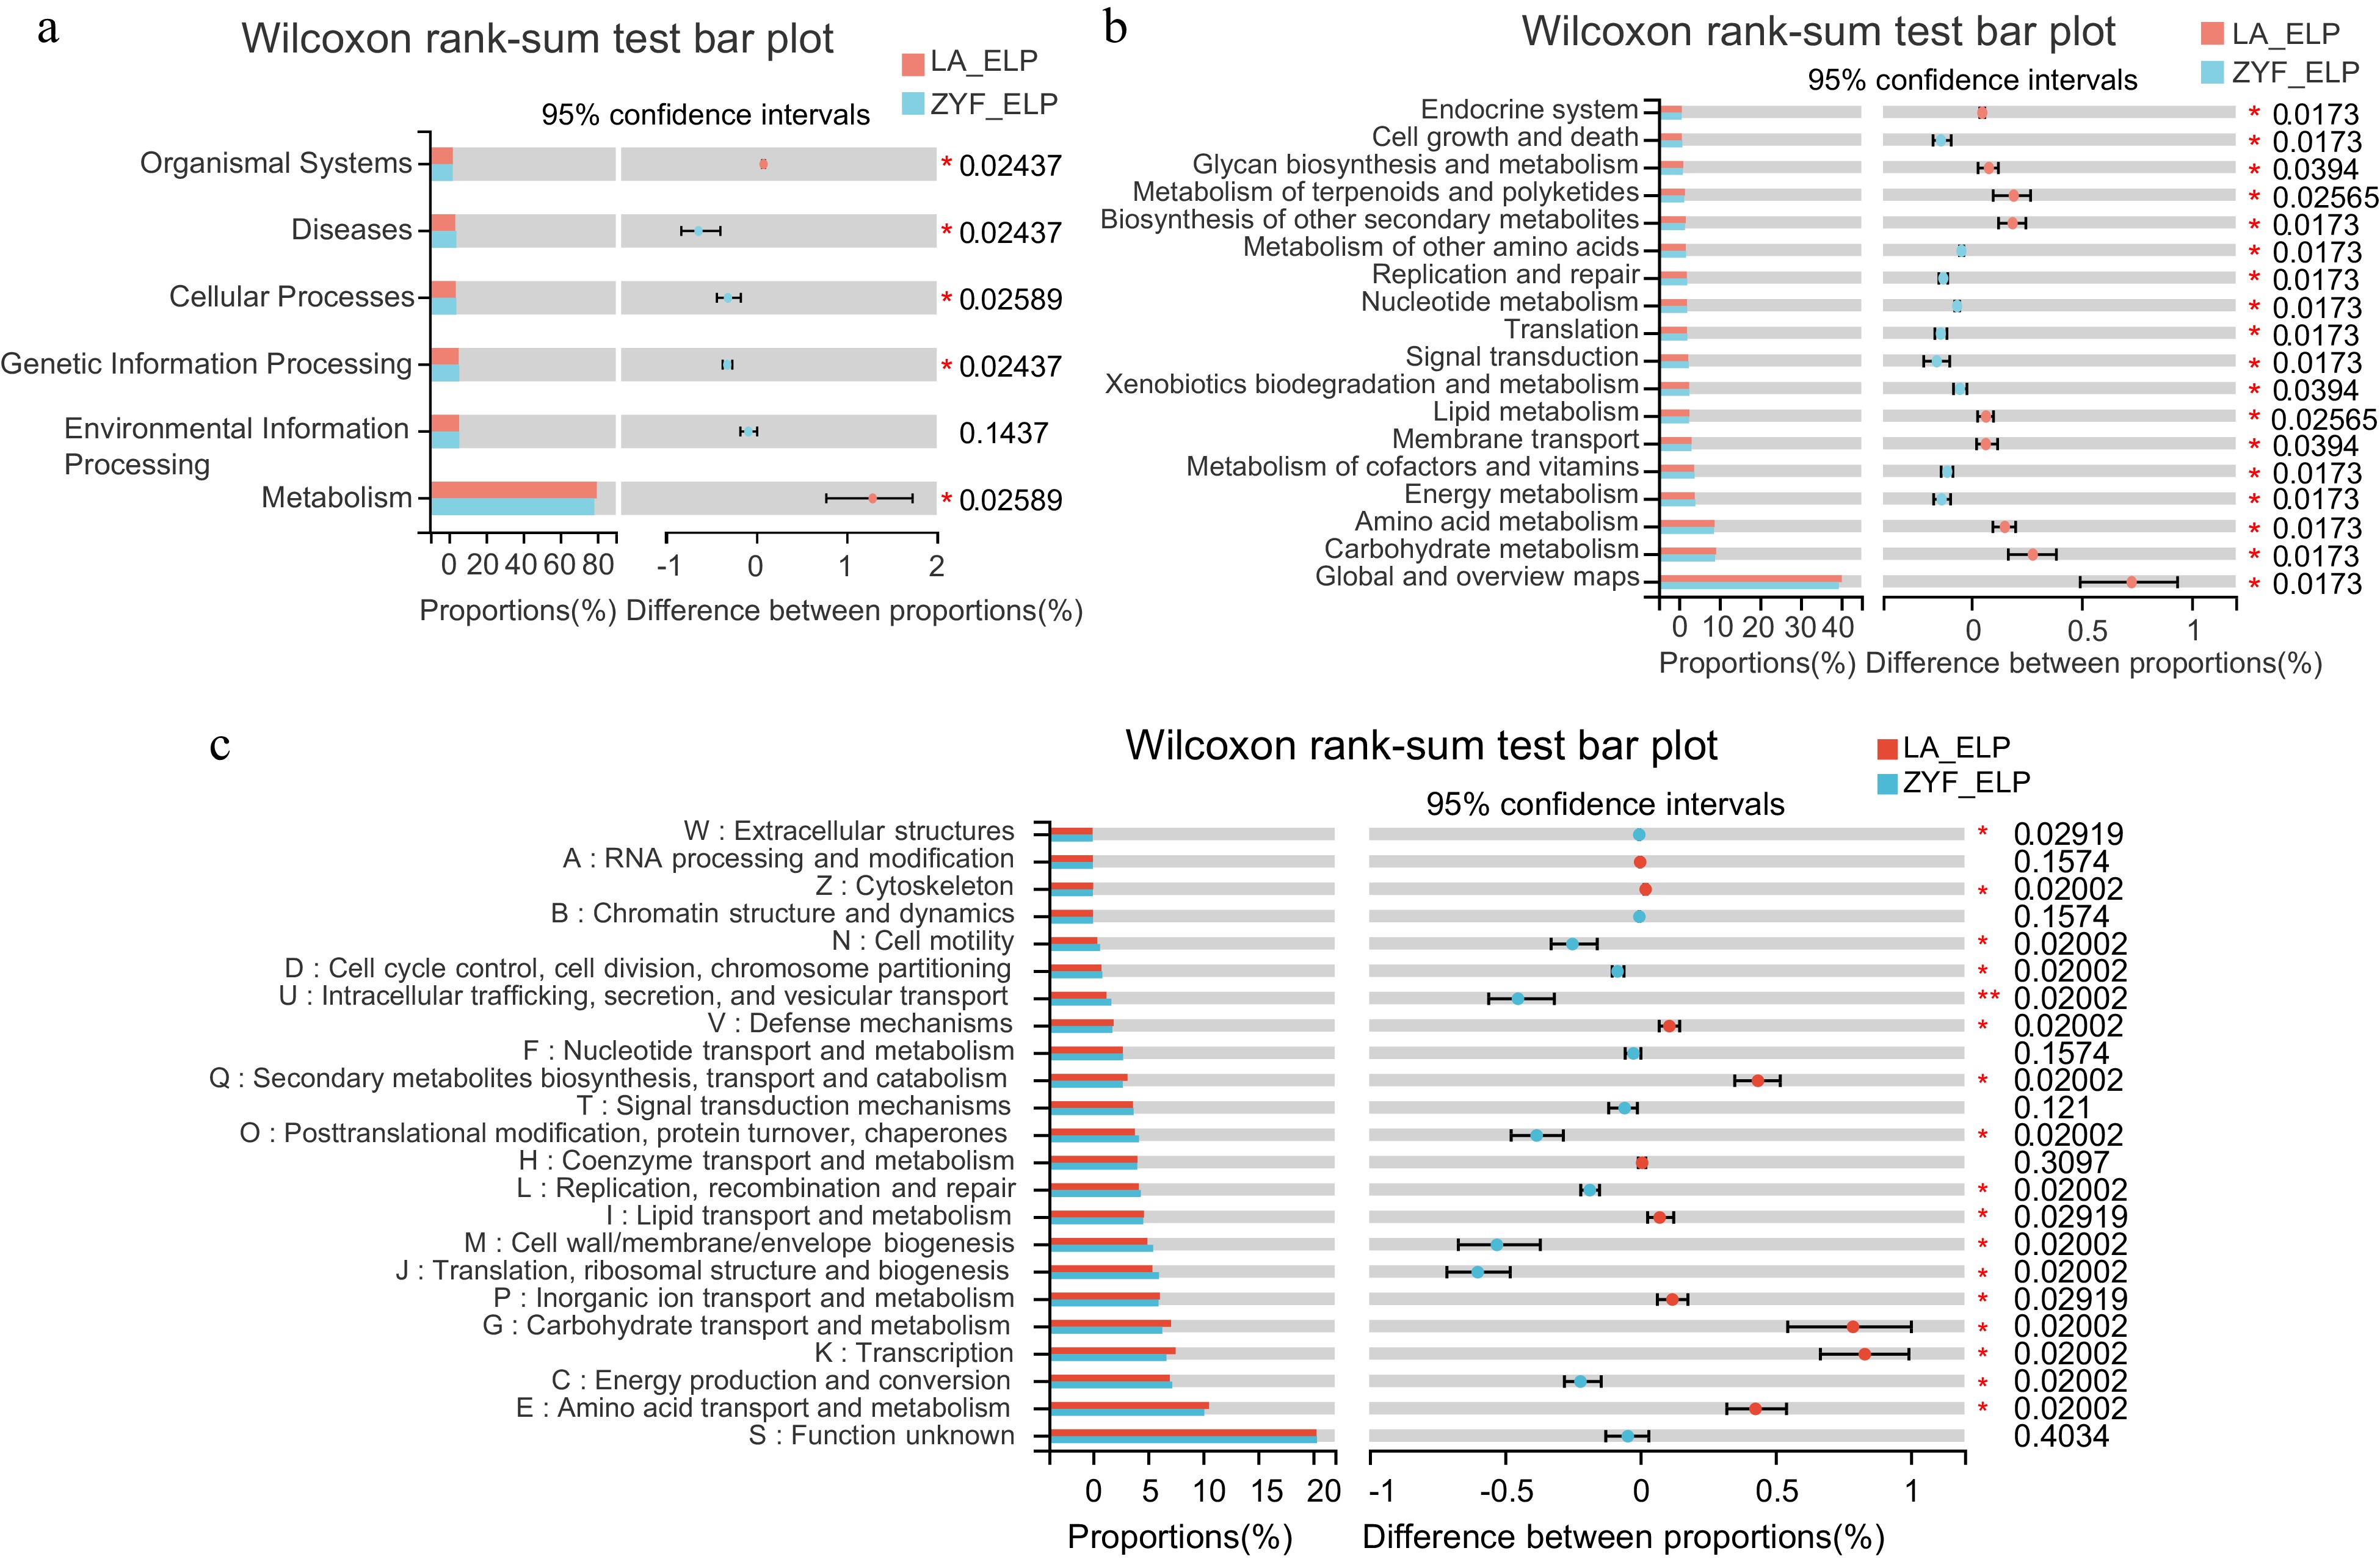
Figure 5.
Function differentiation of LP-enriched endophytic microbes between ZYF and LA. (a), (b) KEGG pathway and (c) COG function annotation analysis of the endophytic LP-enriched genera in the correlation network (Fig. 4b) of ZYF and LA. Wilcoxon rank-sum tests followed by fdr corrections were performed between ZYF and LA. ELP, endophytic samples under LP condition.
-
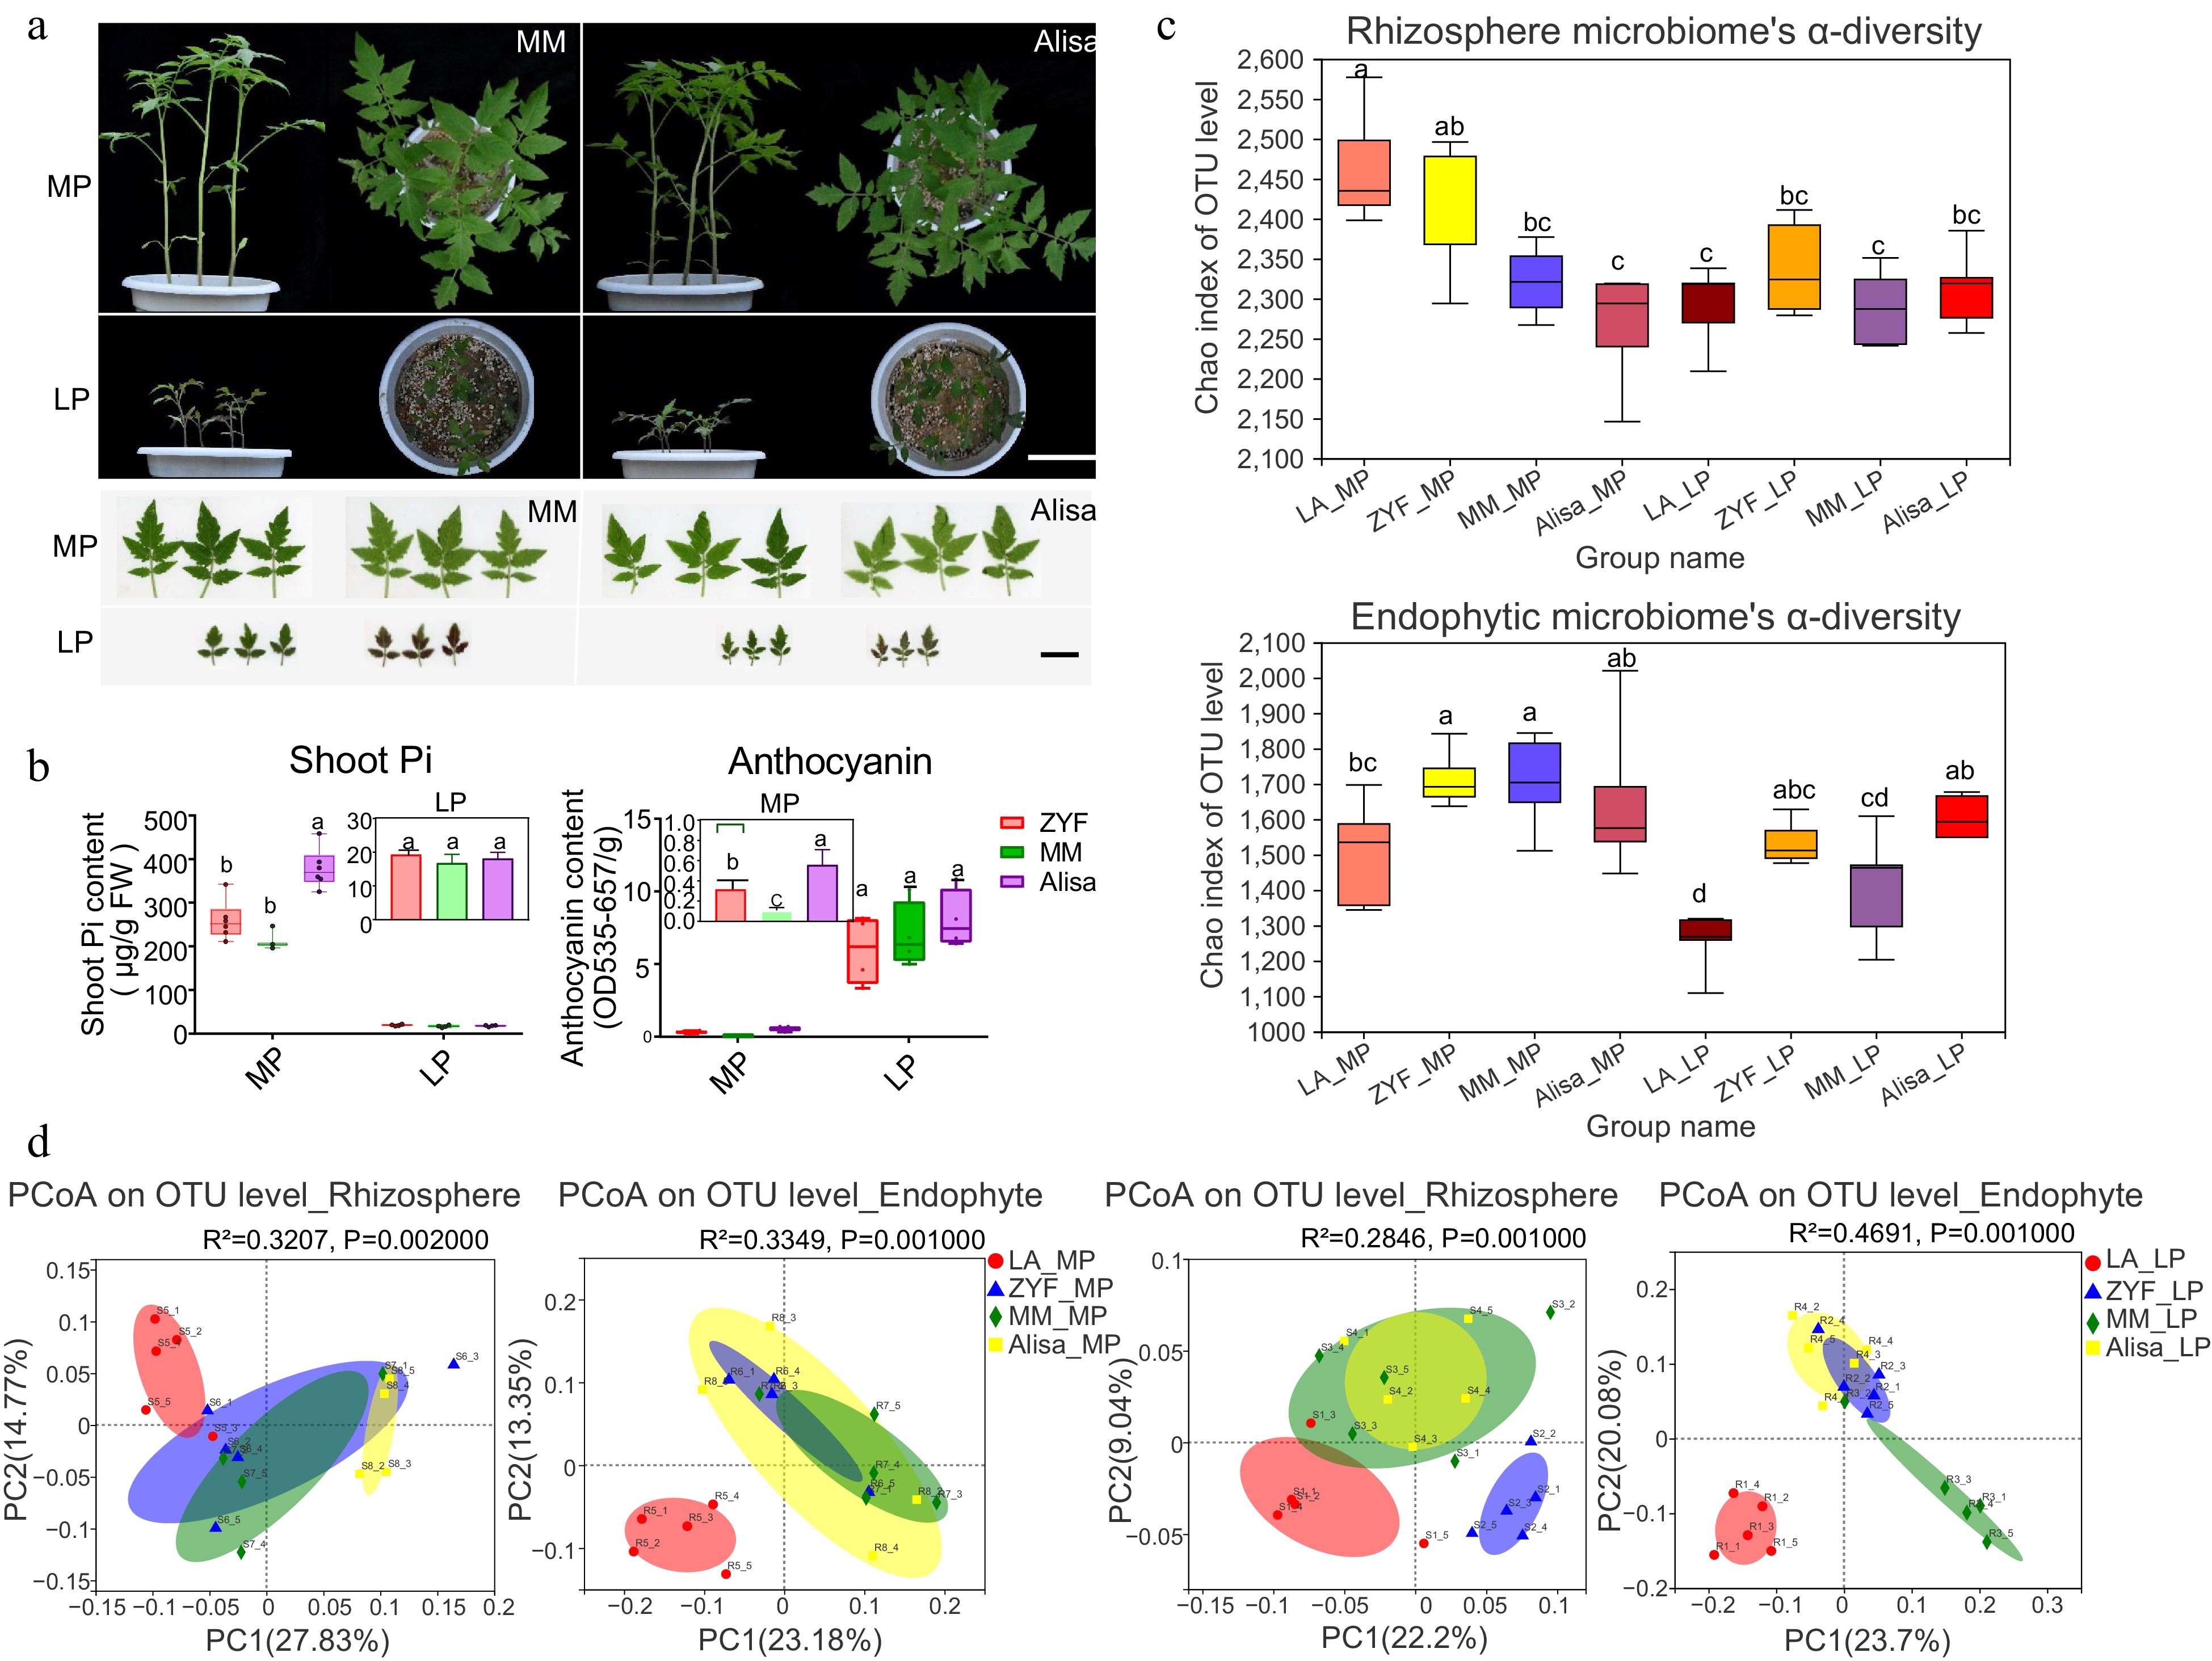
Figure 6.
Comparative analysis of (a) plant and leaf morphology, (b) physiology traits, and (c), (d) rhizosphere/endophytic microbiome diversity among the three cultivated varieties (ZYF, MM and Alisa) and the wild tomato LA under MP and LP treatments. (a) Plant growth of MM and Alisa. Scale bar = 10 cm. Leaf morphology of MM and Alisa. Scale bar = 3 cm. (b) Shoot Pi concentration and anthocyanin content of three cultivars under MP and LP treatments. Data and error bars were means ± SD and significance testing was analyzed between varieties using one-way ANOVA followed by post hoc test, varieties with the same letter are not significantly different. (c) The α-diversity calculated by using Chao index in the rhizosphere and endophytic bacterial community of four tomato accessions under MP and LP treatments. (d) Principal Coordinate Analysis (PCoA) analysis based on bray_curtis dissimilarities of 16S rRNA sequences of microbiome across all the treated samples under MP and LP conditions. Significance was determined using the nonparametric Adonis test with 999 permutations.
-
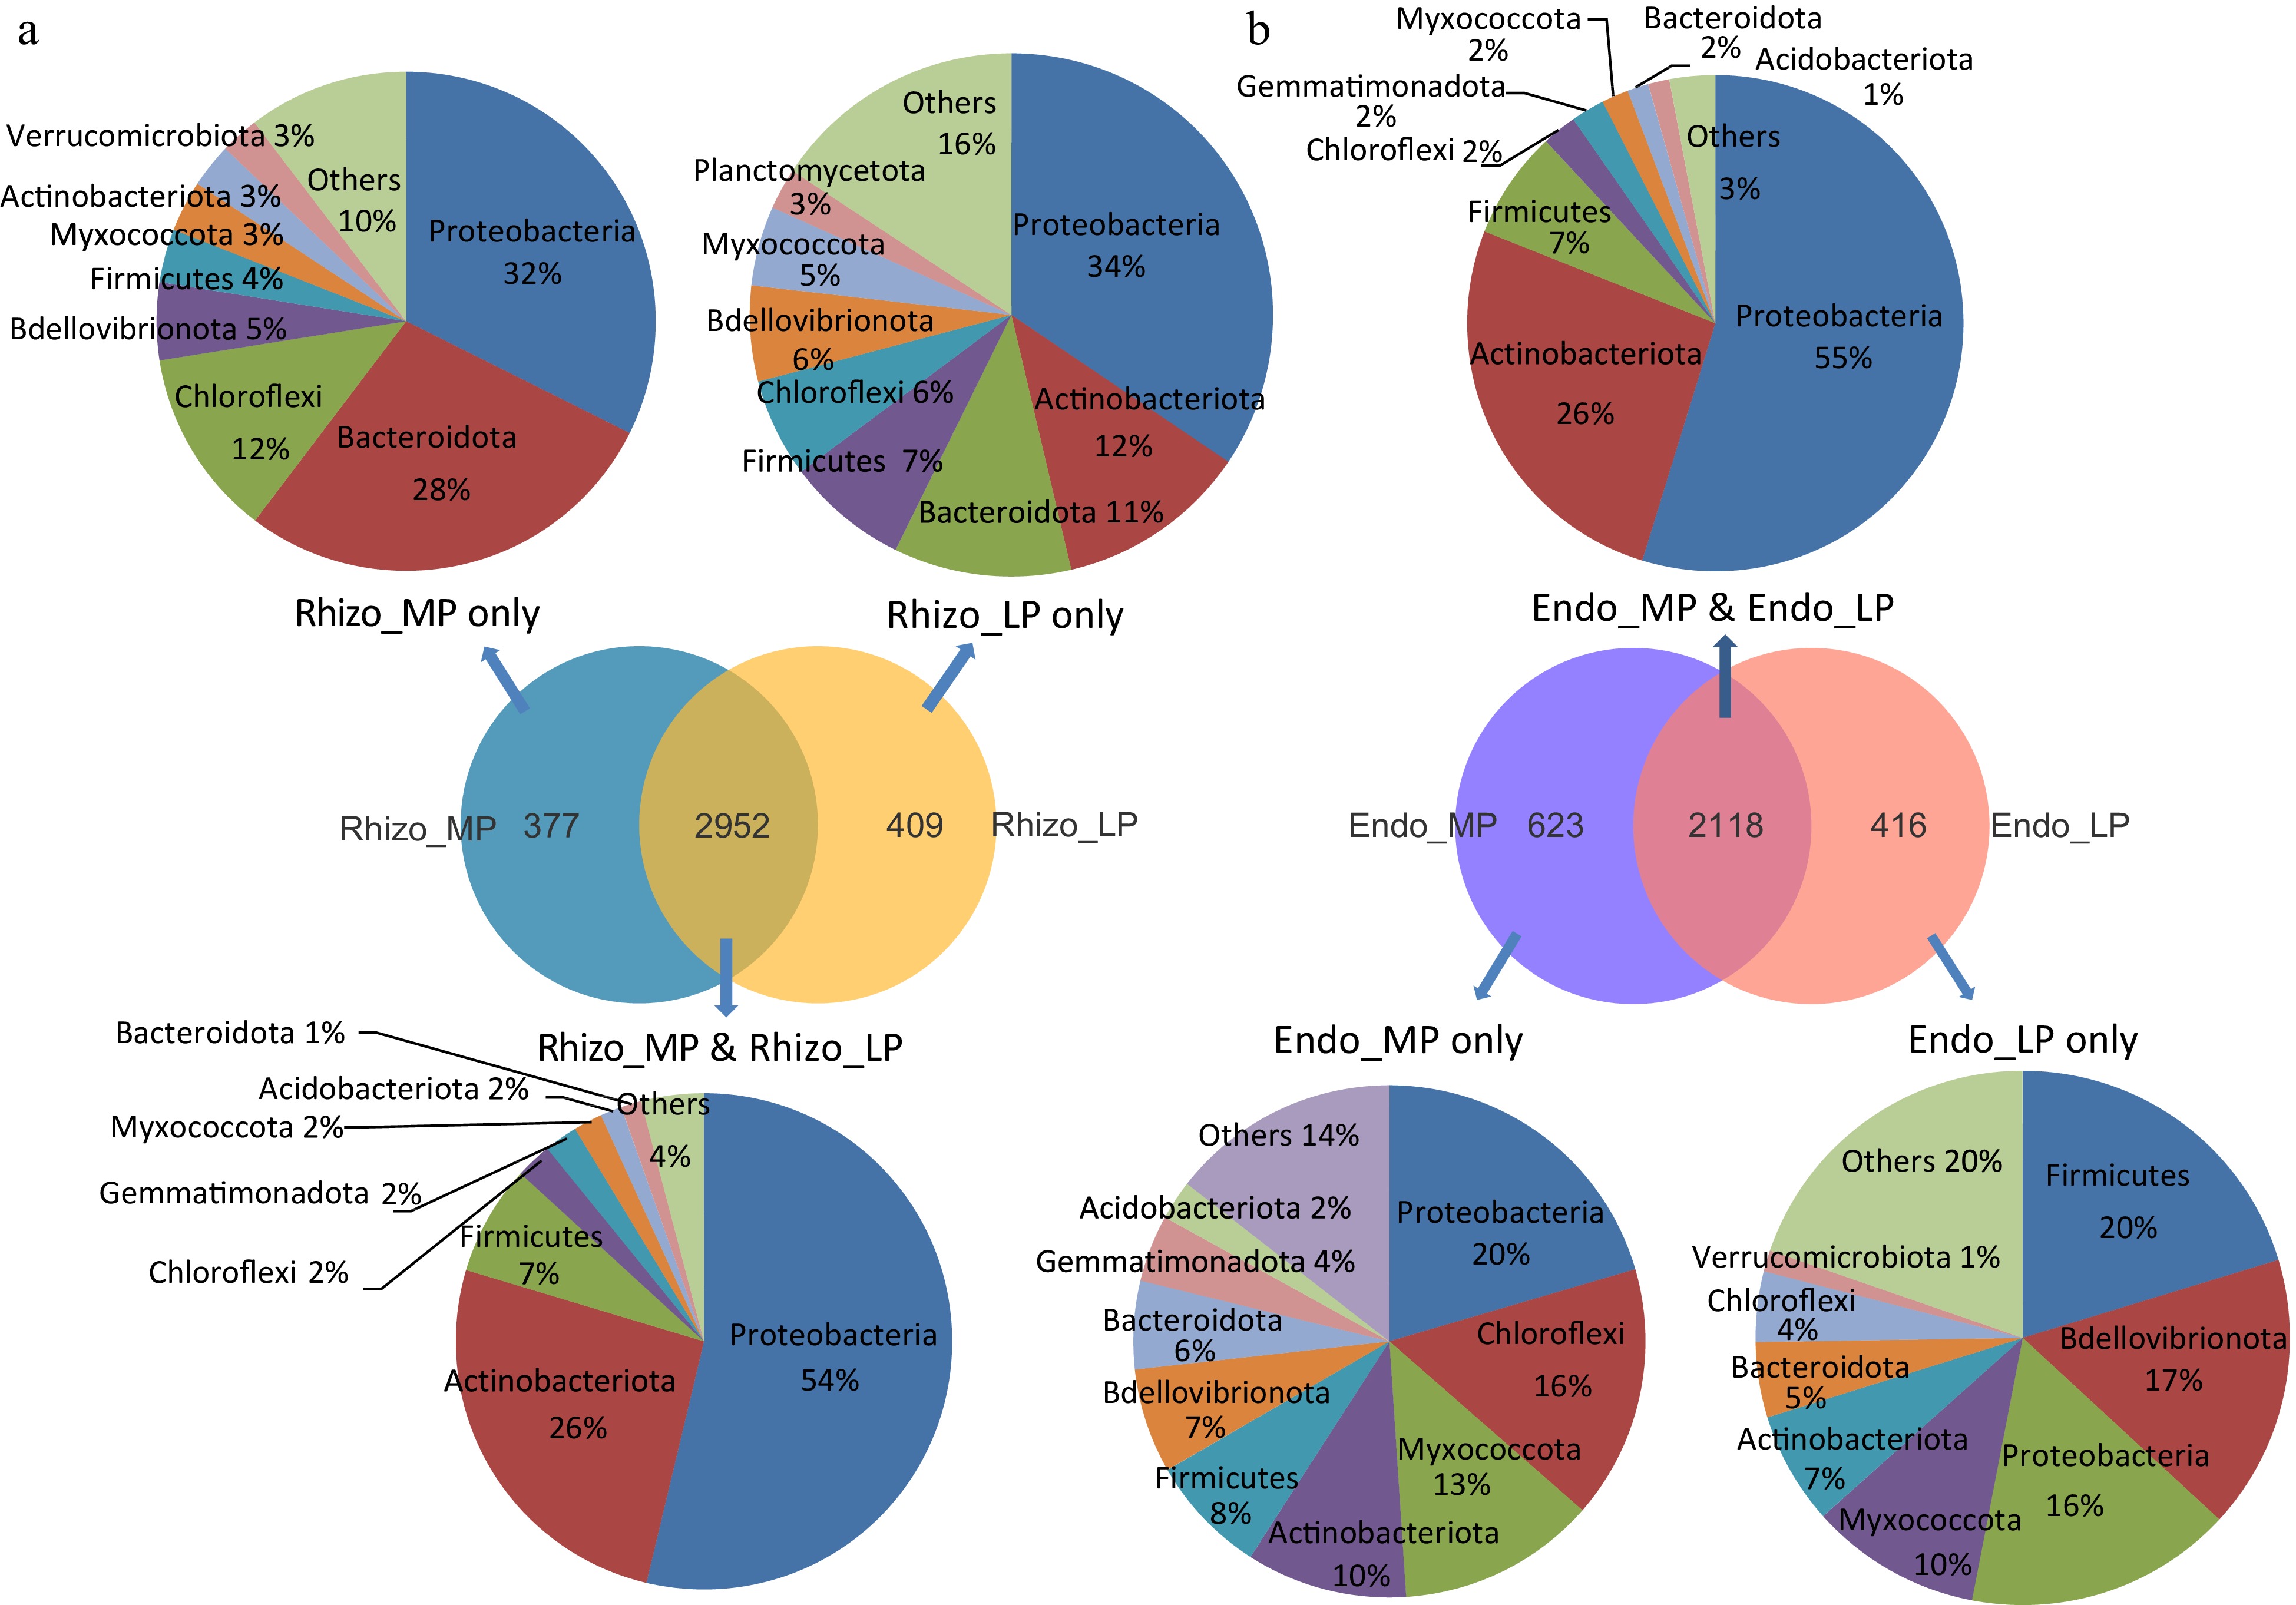
Figure 7.
Specific differences in microbial composition among three tomato cultivars. Venn diagrams in the middle counted the number of OTUs of (a) rhizosphere and (b) endophytic microbiome under MP, LP&MP and LP conditions. The top and bottom pie diagrams showed shared and specific microbial composition abundance under MP, LP&MP and LP conditions at the phylum level.
Figures
(7)
Tables
(0)