-
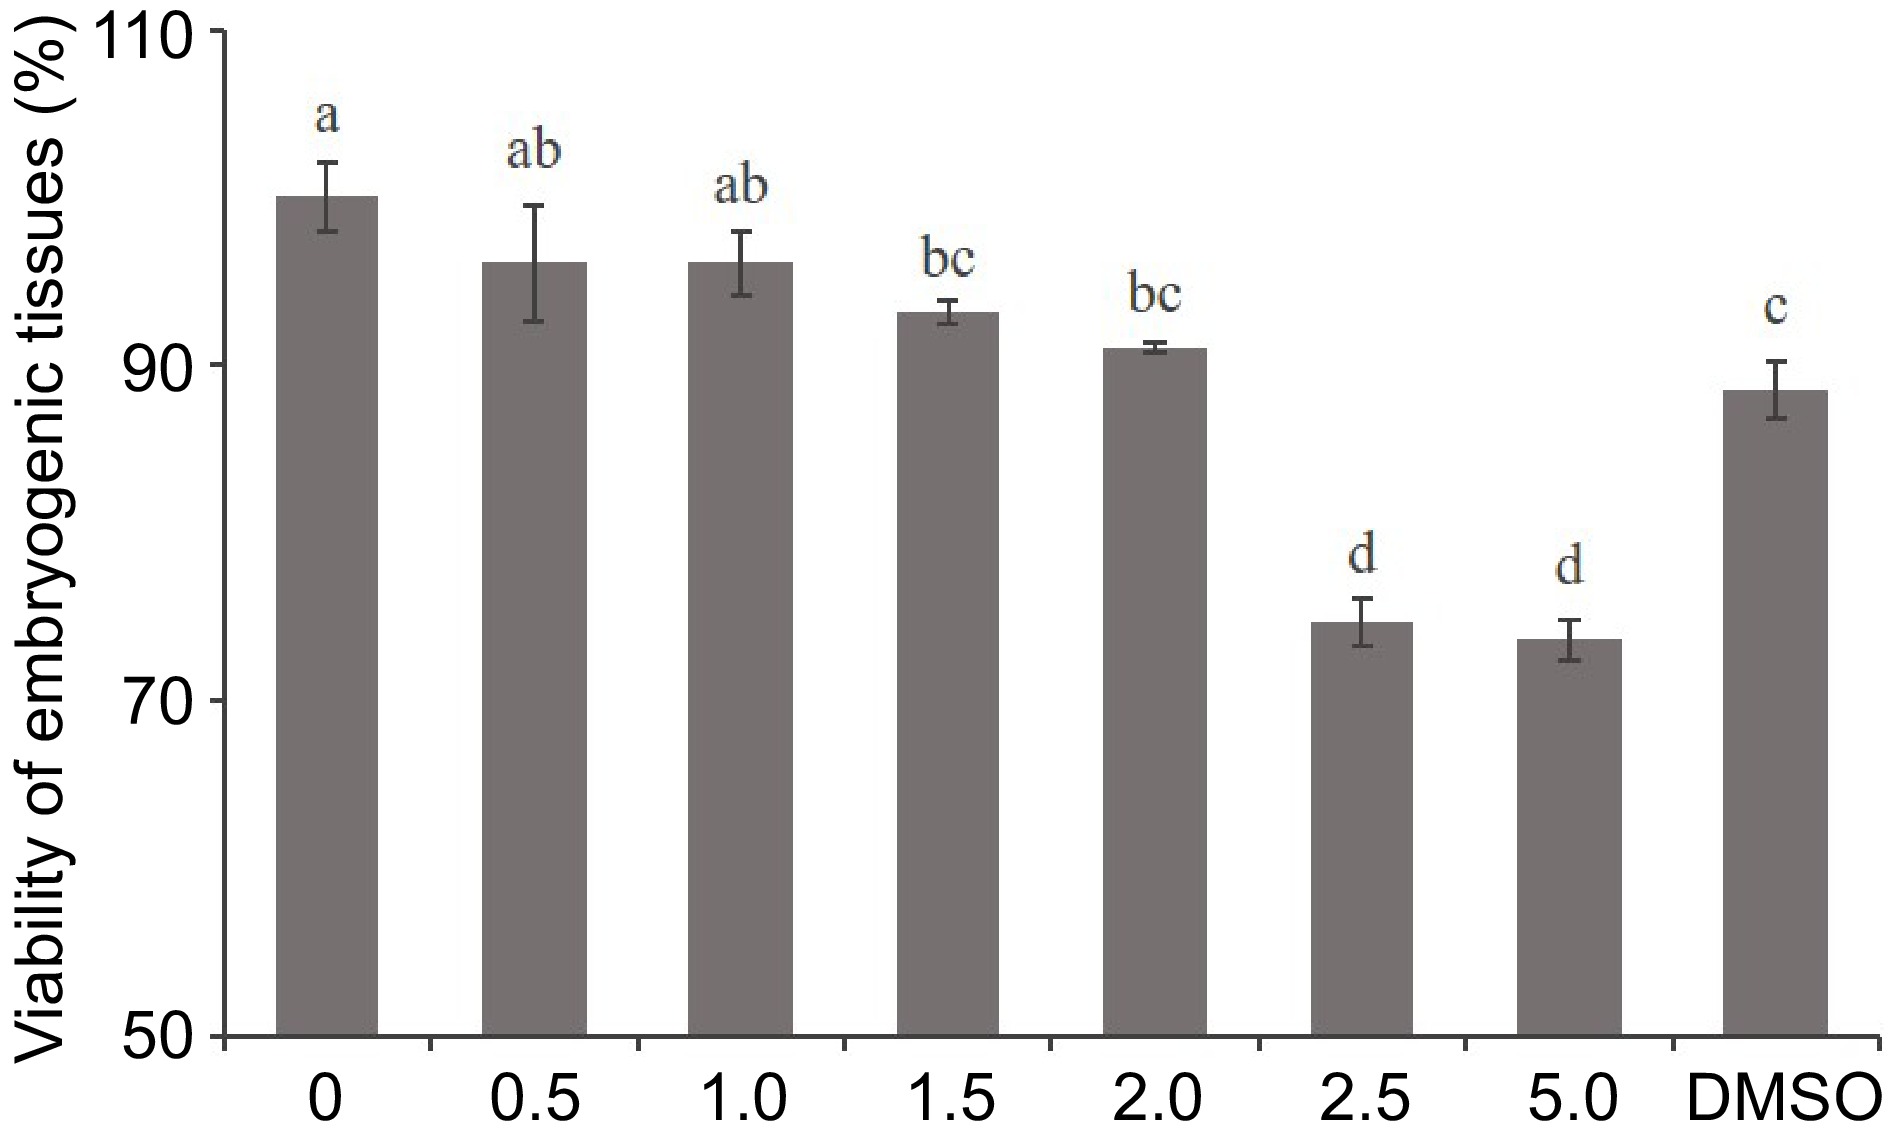
Figure 1.
Effect of 5-aza-dC treatment on the viability of embryogenic tissue by the TTC assay. The embryogenic tissues were treated with 0, 0.5, 1.0, 1.5, 2.0, 2.5, and 5.0 µM 5-aza-dC or 5.0 µM DMSO.
-
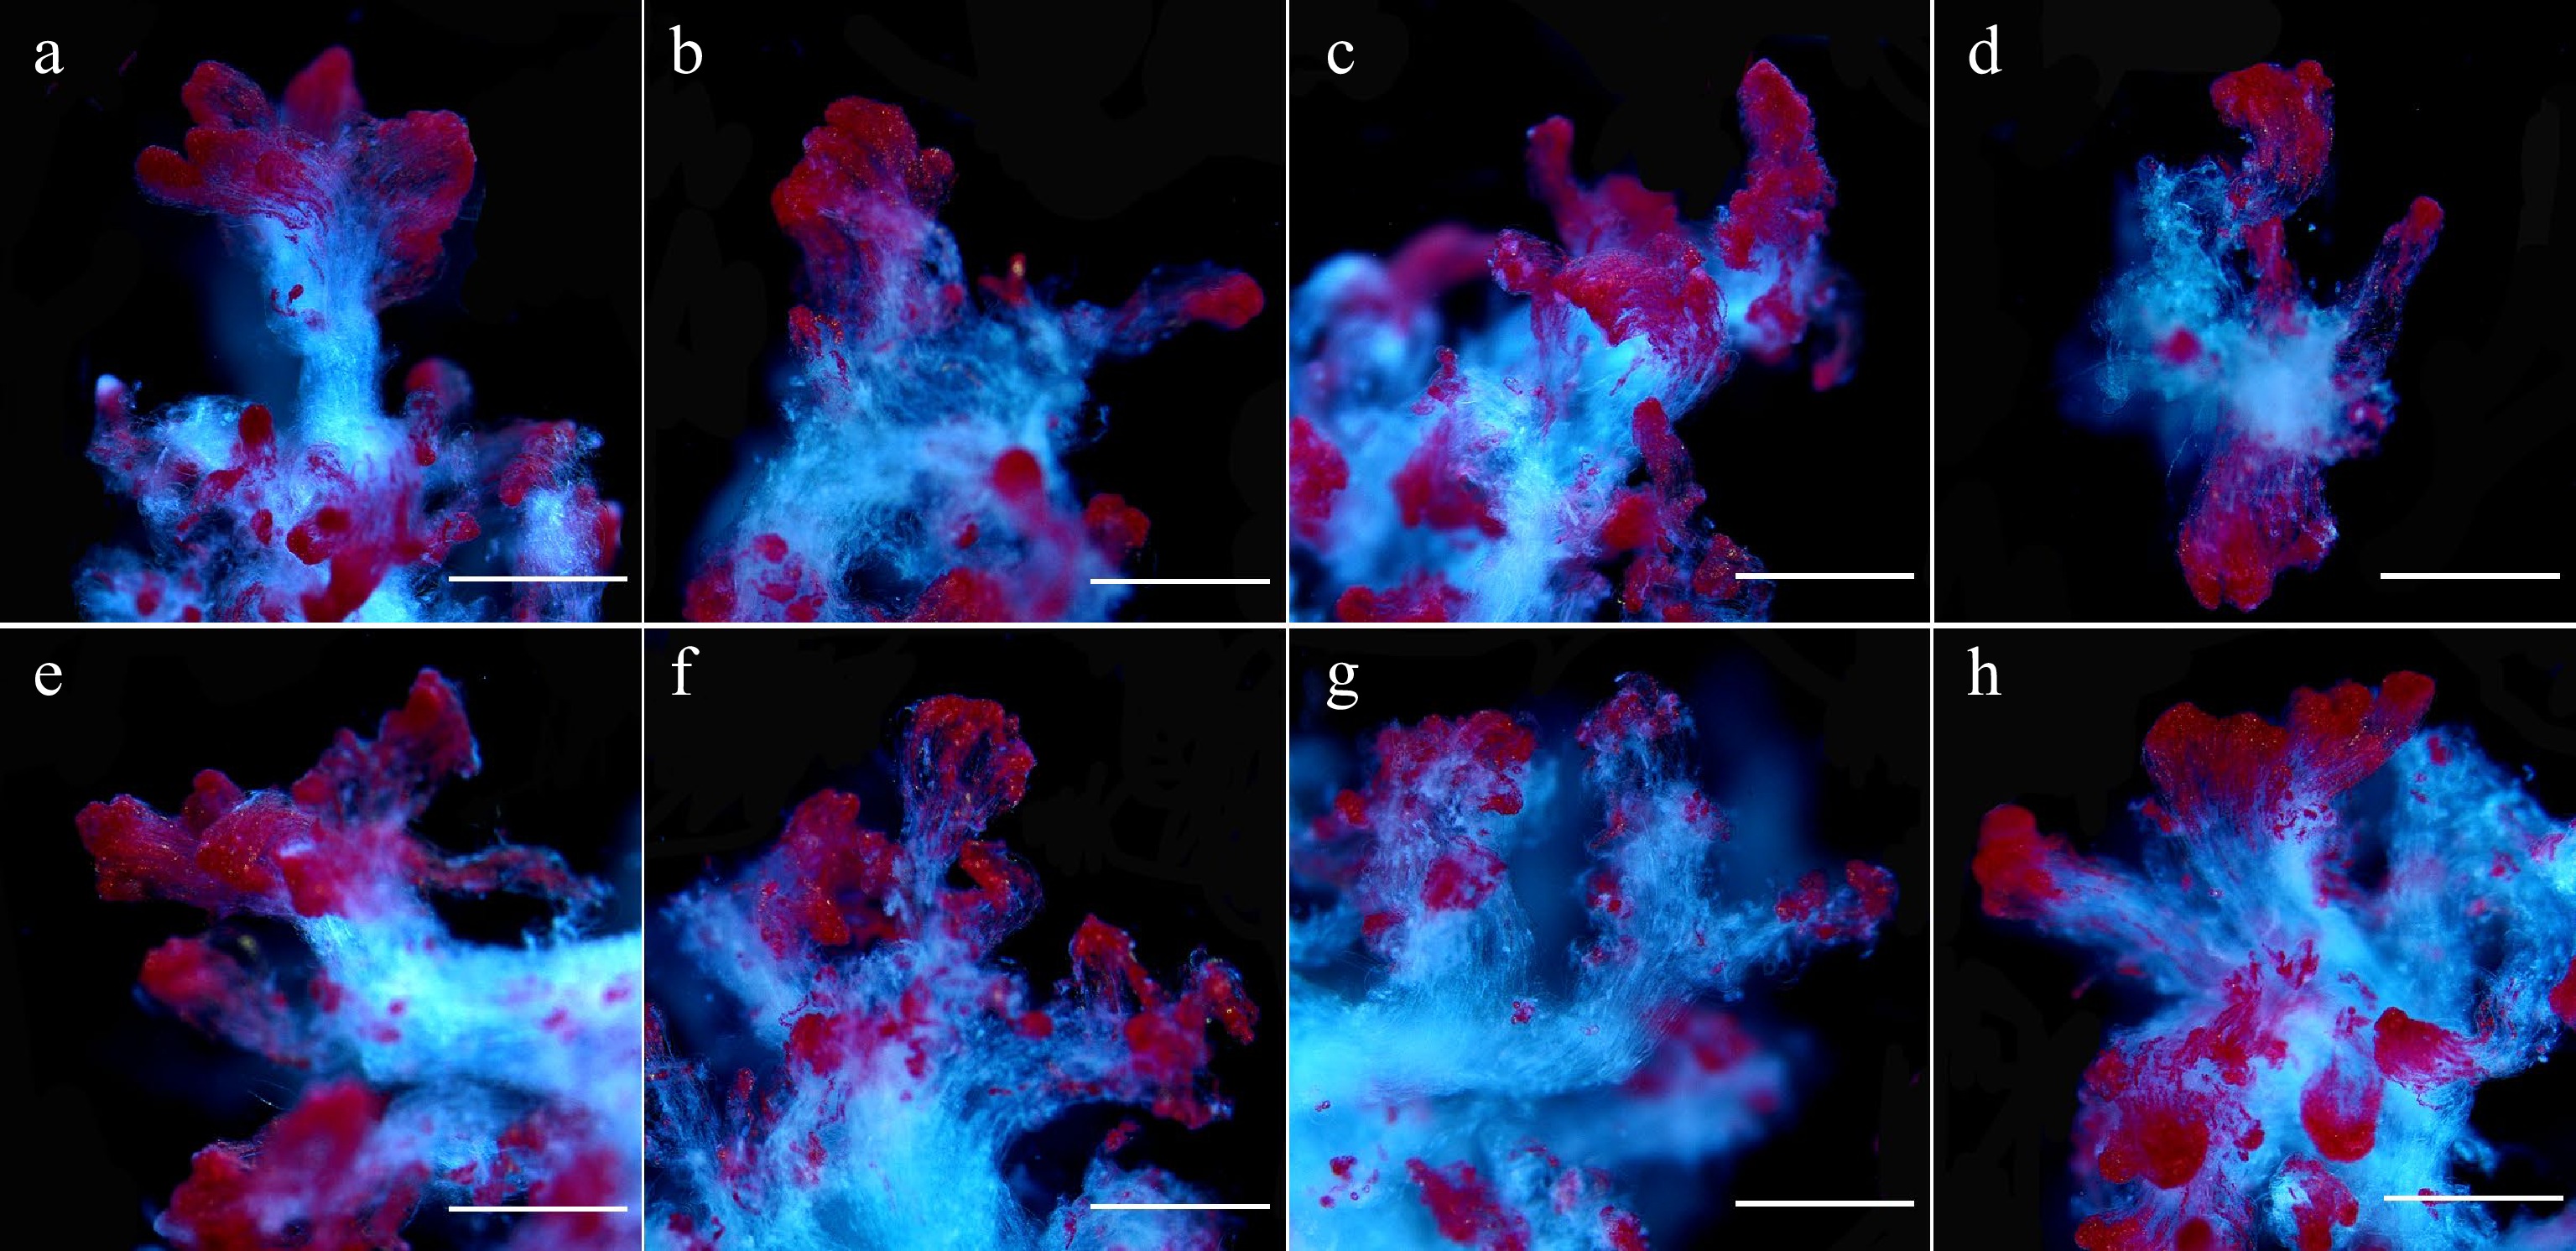
Figure 2.
Microscopic observation of 5-aza-dC treated embryogenic tissues by TTC staining. The embryogenic tissues in (a)–(g) were treated with 0, 0.5, 1.0, 1.5, 2.0, 2.5, and 5.0 µM 5-aza-dC, and the embryogenic tissues in (h) were treated with 5.0 µM DMSO (negative control). All bars = 2.2 mm.
-
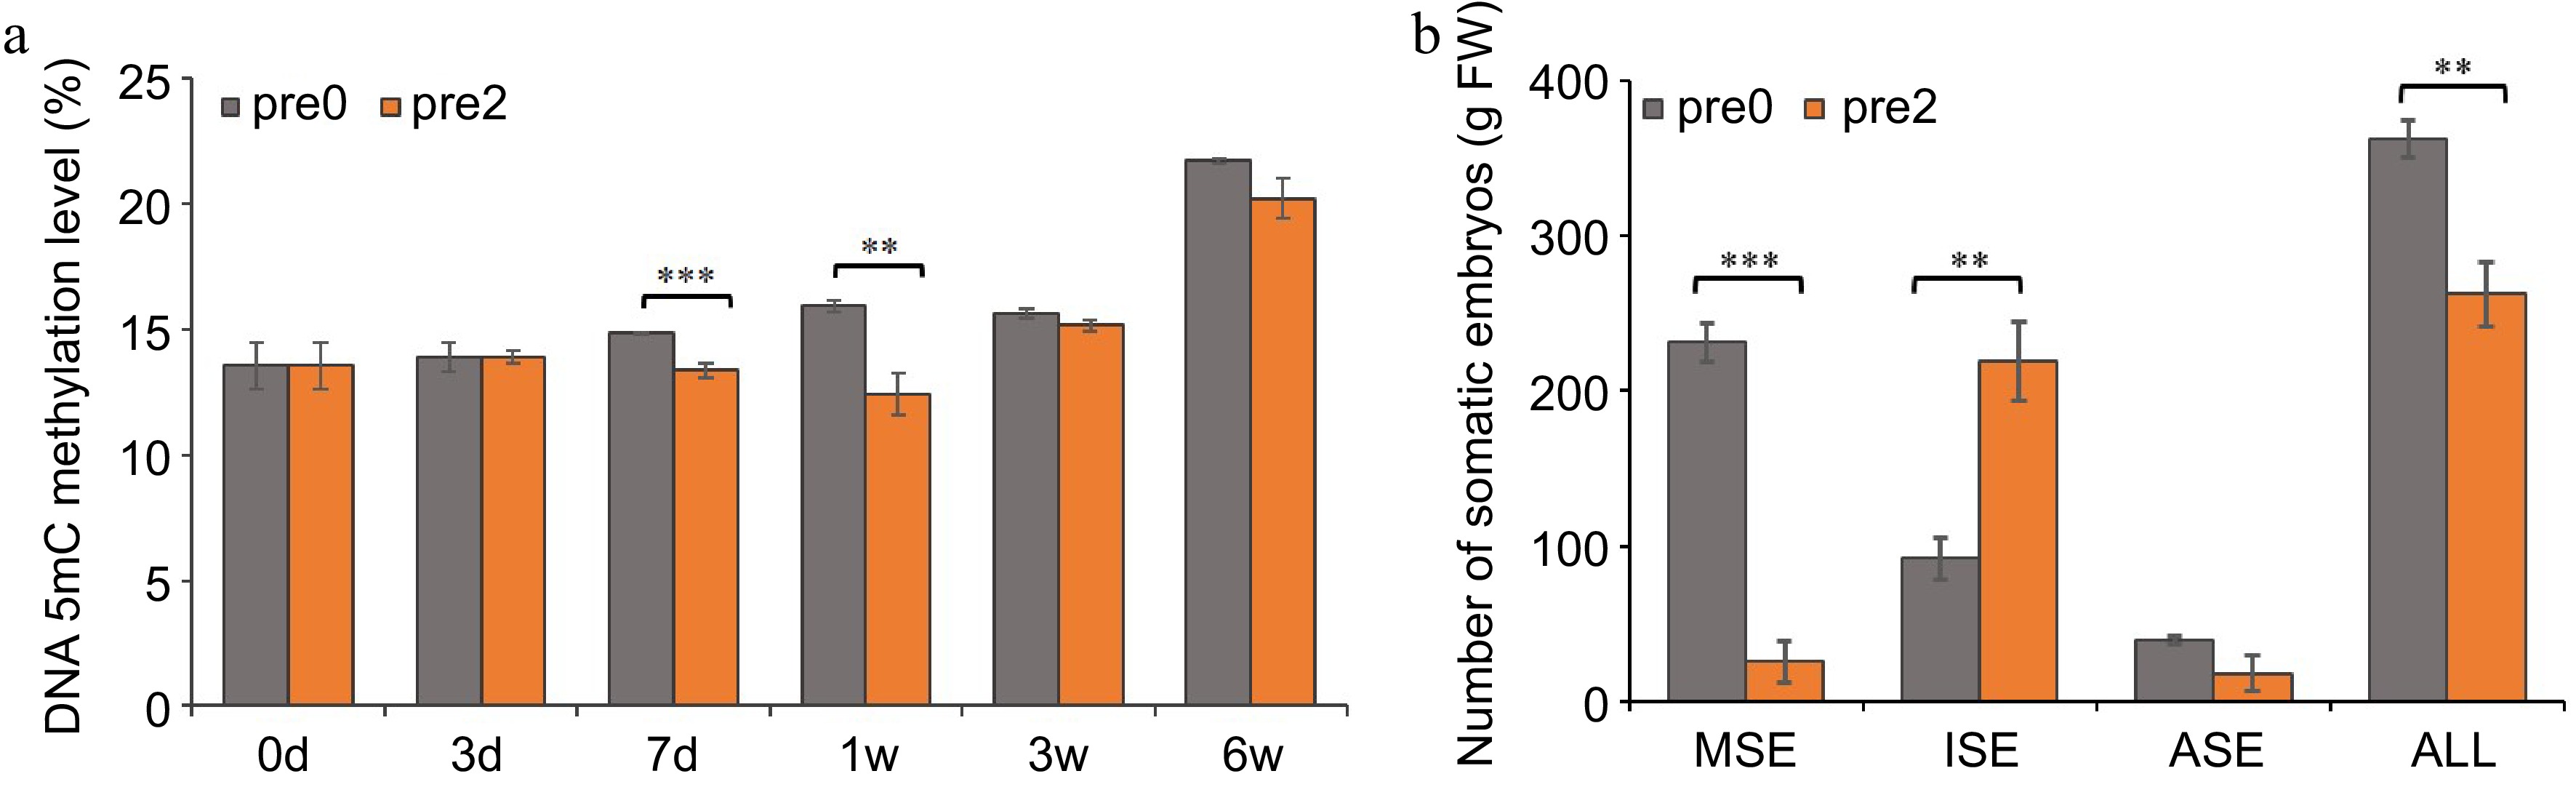
Figure 3.
Effect of 5-aza-dC on the development of SEs. (a) The DNA methylation levels of embryogenic tissues on the 0, 3rd, 7th d of pre-maturation treatment and the 1st, 3rd, 6th week of maturation culture. (b) The numbers of mature somatic embryos (MSE), immature somatic embryos (ISE), abnormal somatic embryos (ASE), and total somatic embryos (ALL). Pre0 and pre2 represent untreated and 5-aza-dC treated embryogenic tissues, respectively.
-
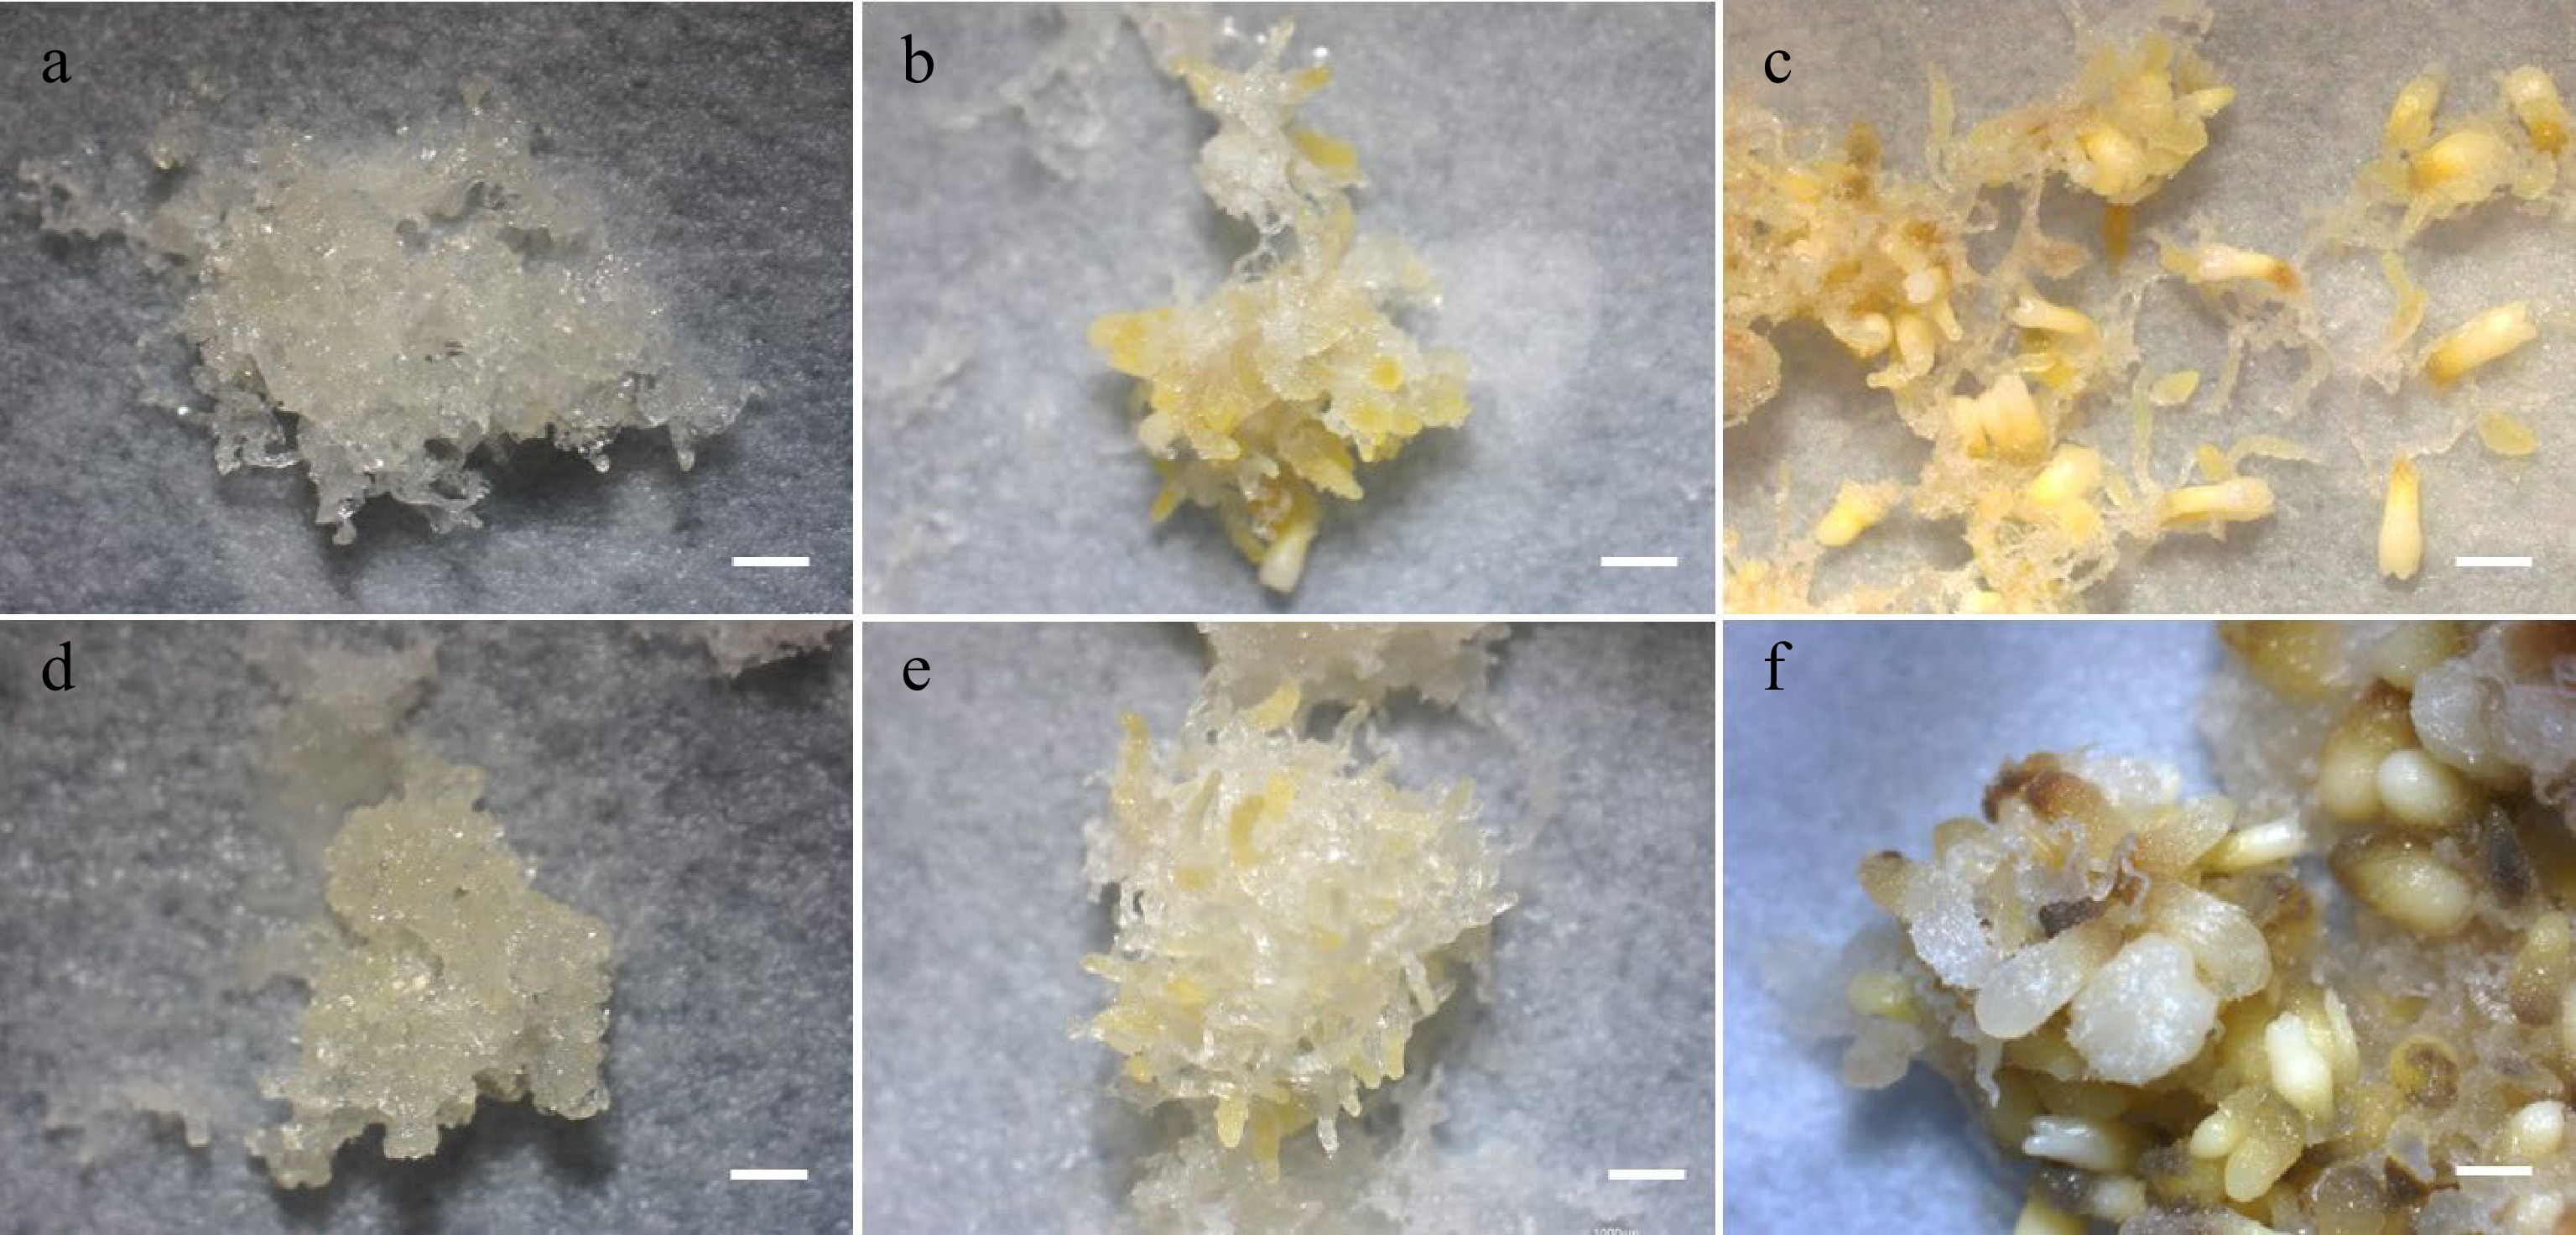
Figure 4.
SE development in maturation cultures. (a) Untreated and (d) 5-aza-dC treated embryogenic tissues on the 1st week of maturation culture. (b) Untreated and (e) 5-aza-dC treated embryogenic tissues on the 3rd week of maturation culture. (c) Untreated and (f) 5-aza-dC treated embryogenic tissues on the 6th week of maturation culture. Bar = 1,000 µm.
-
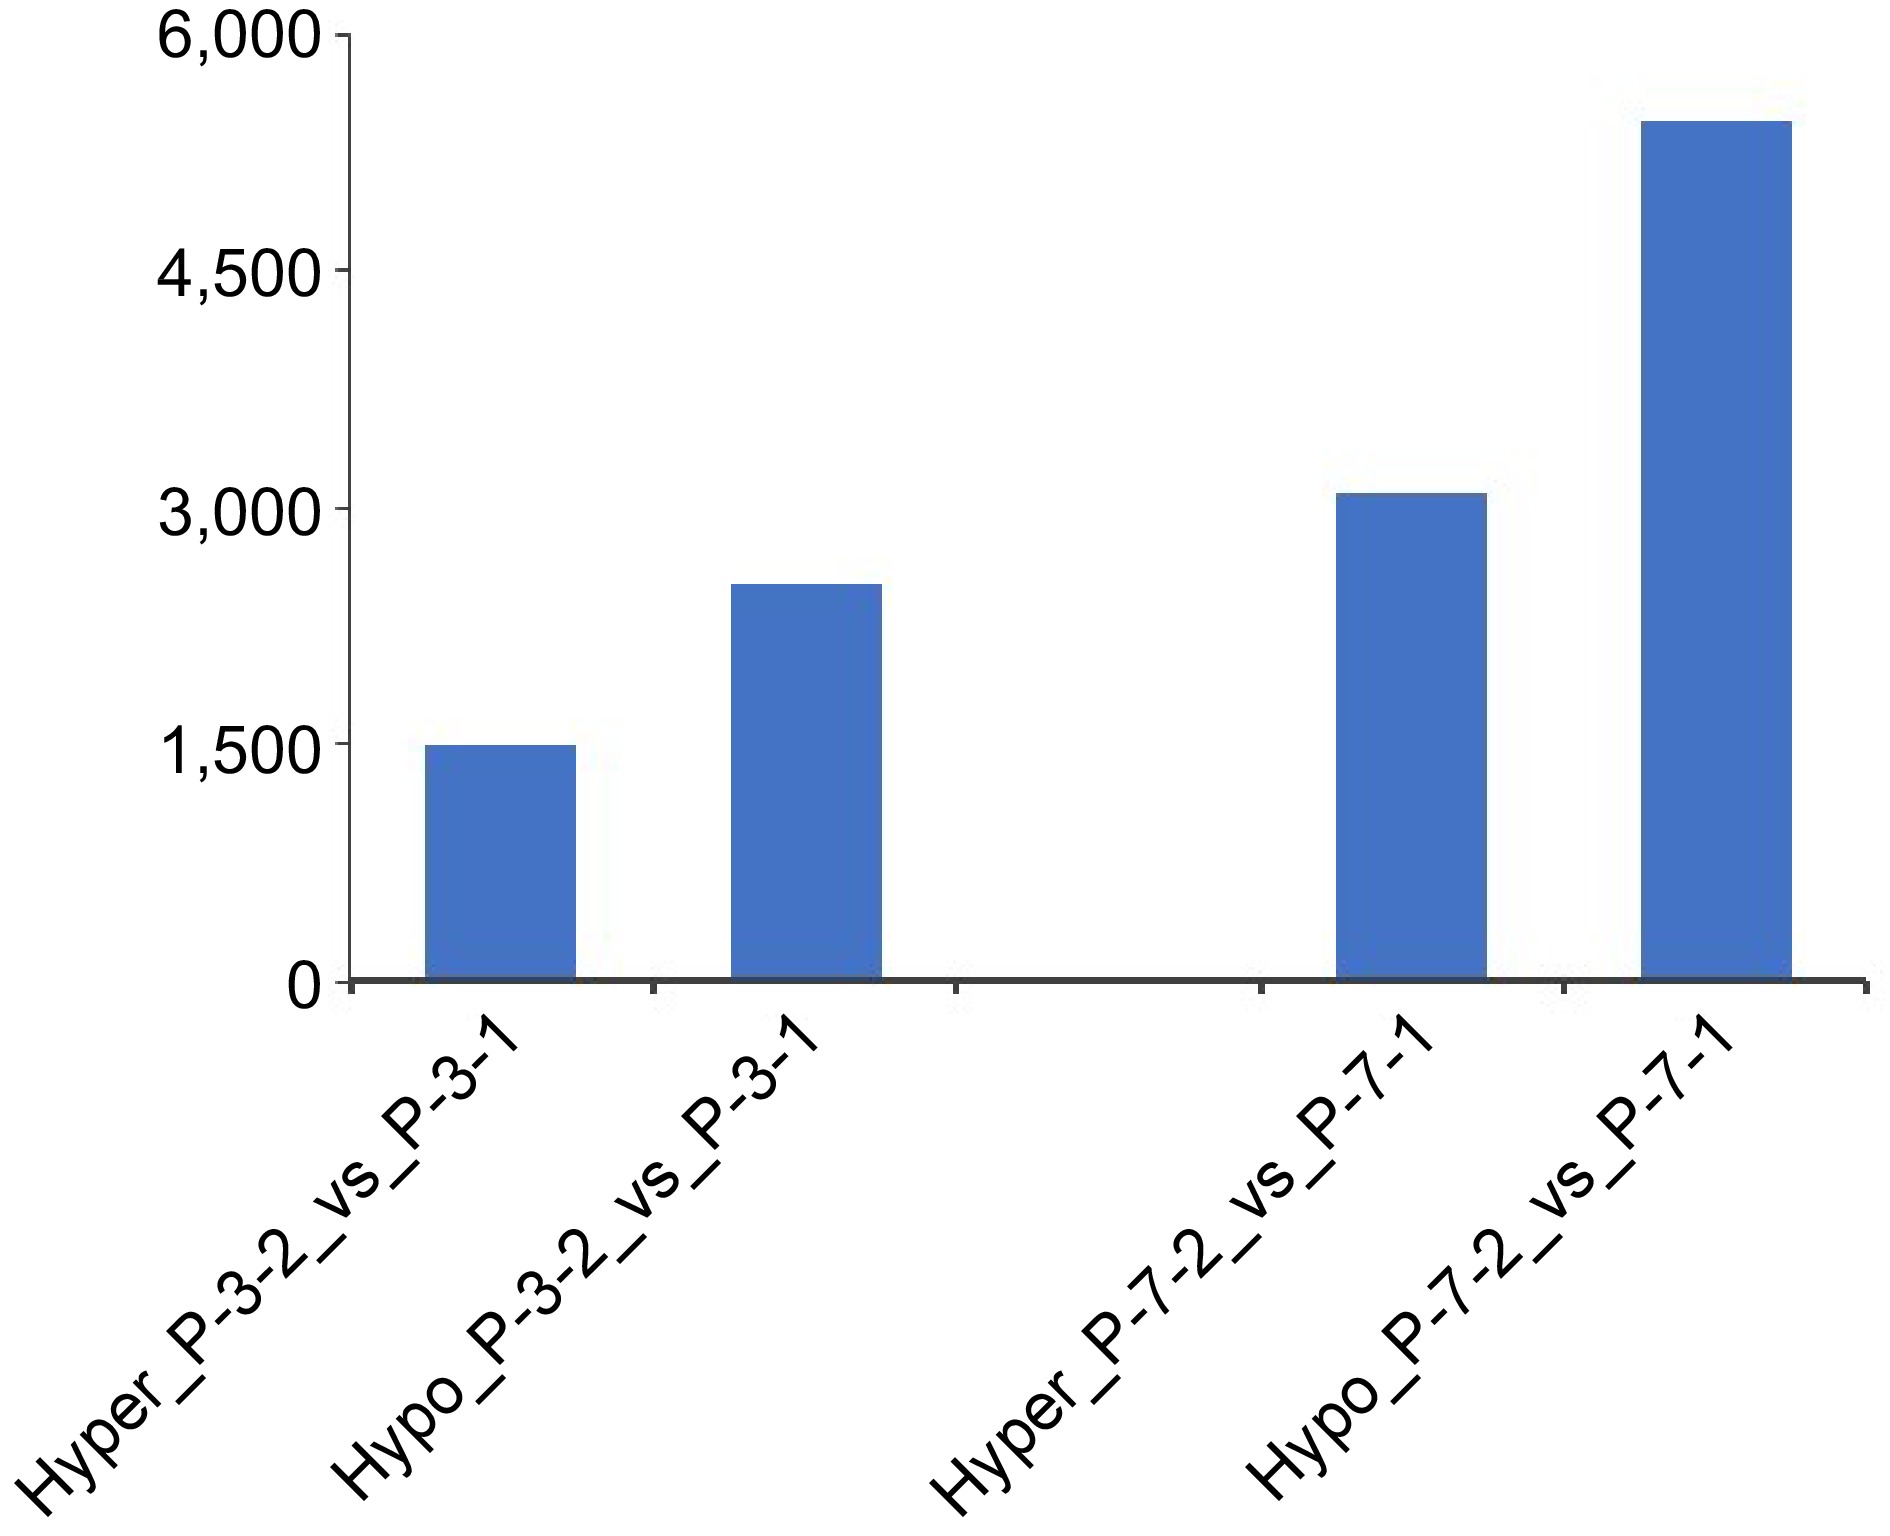
Figure 5.
Numbers of hypermethylated/hypomethylated differentially methylated regions between embryogenic tissues (P_3_1, P_7_1) and 5-aza-dC treated embryogenic tissues (P_3_2, P_7_2) during the pre-maturation treatment.
-
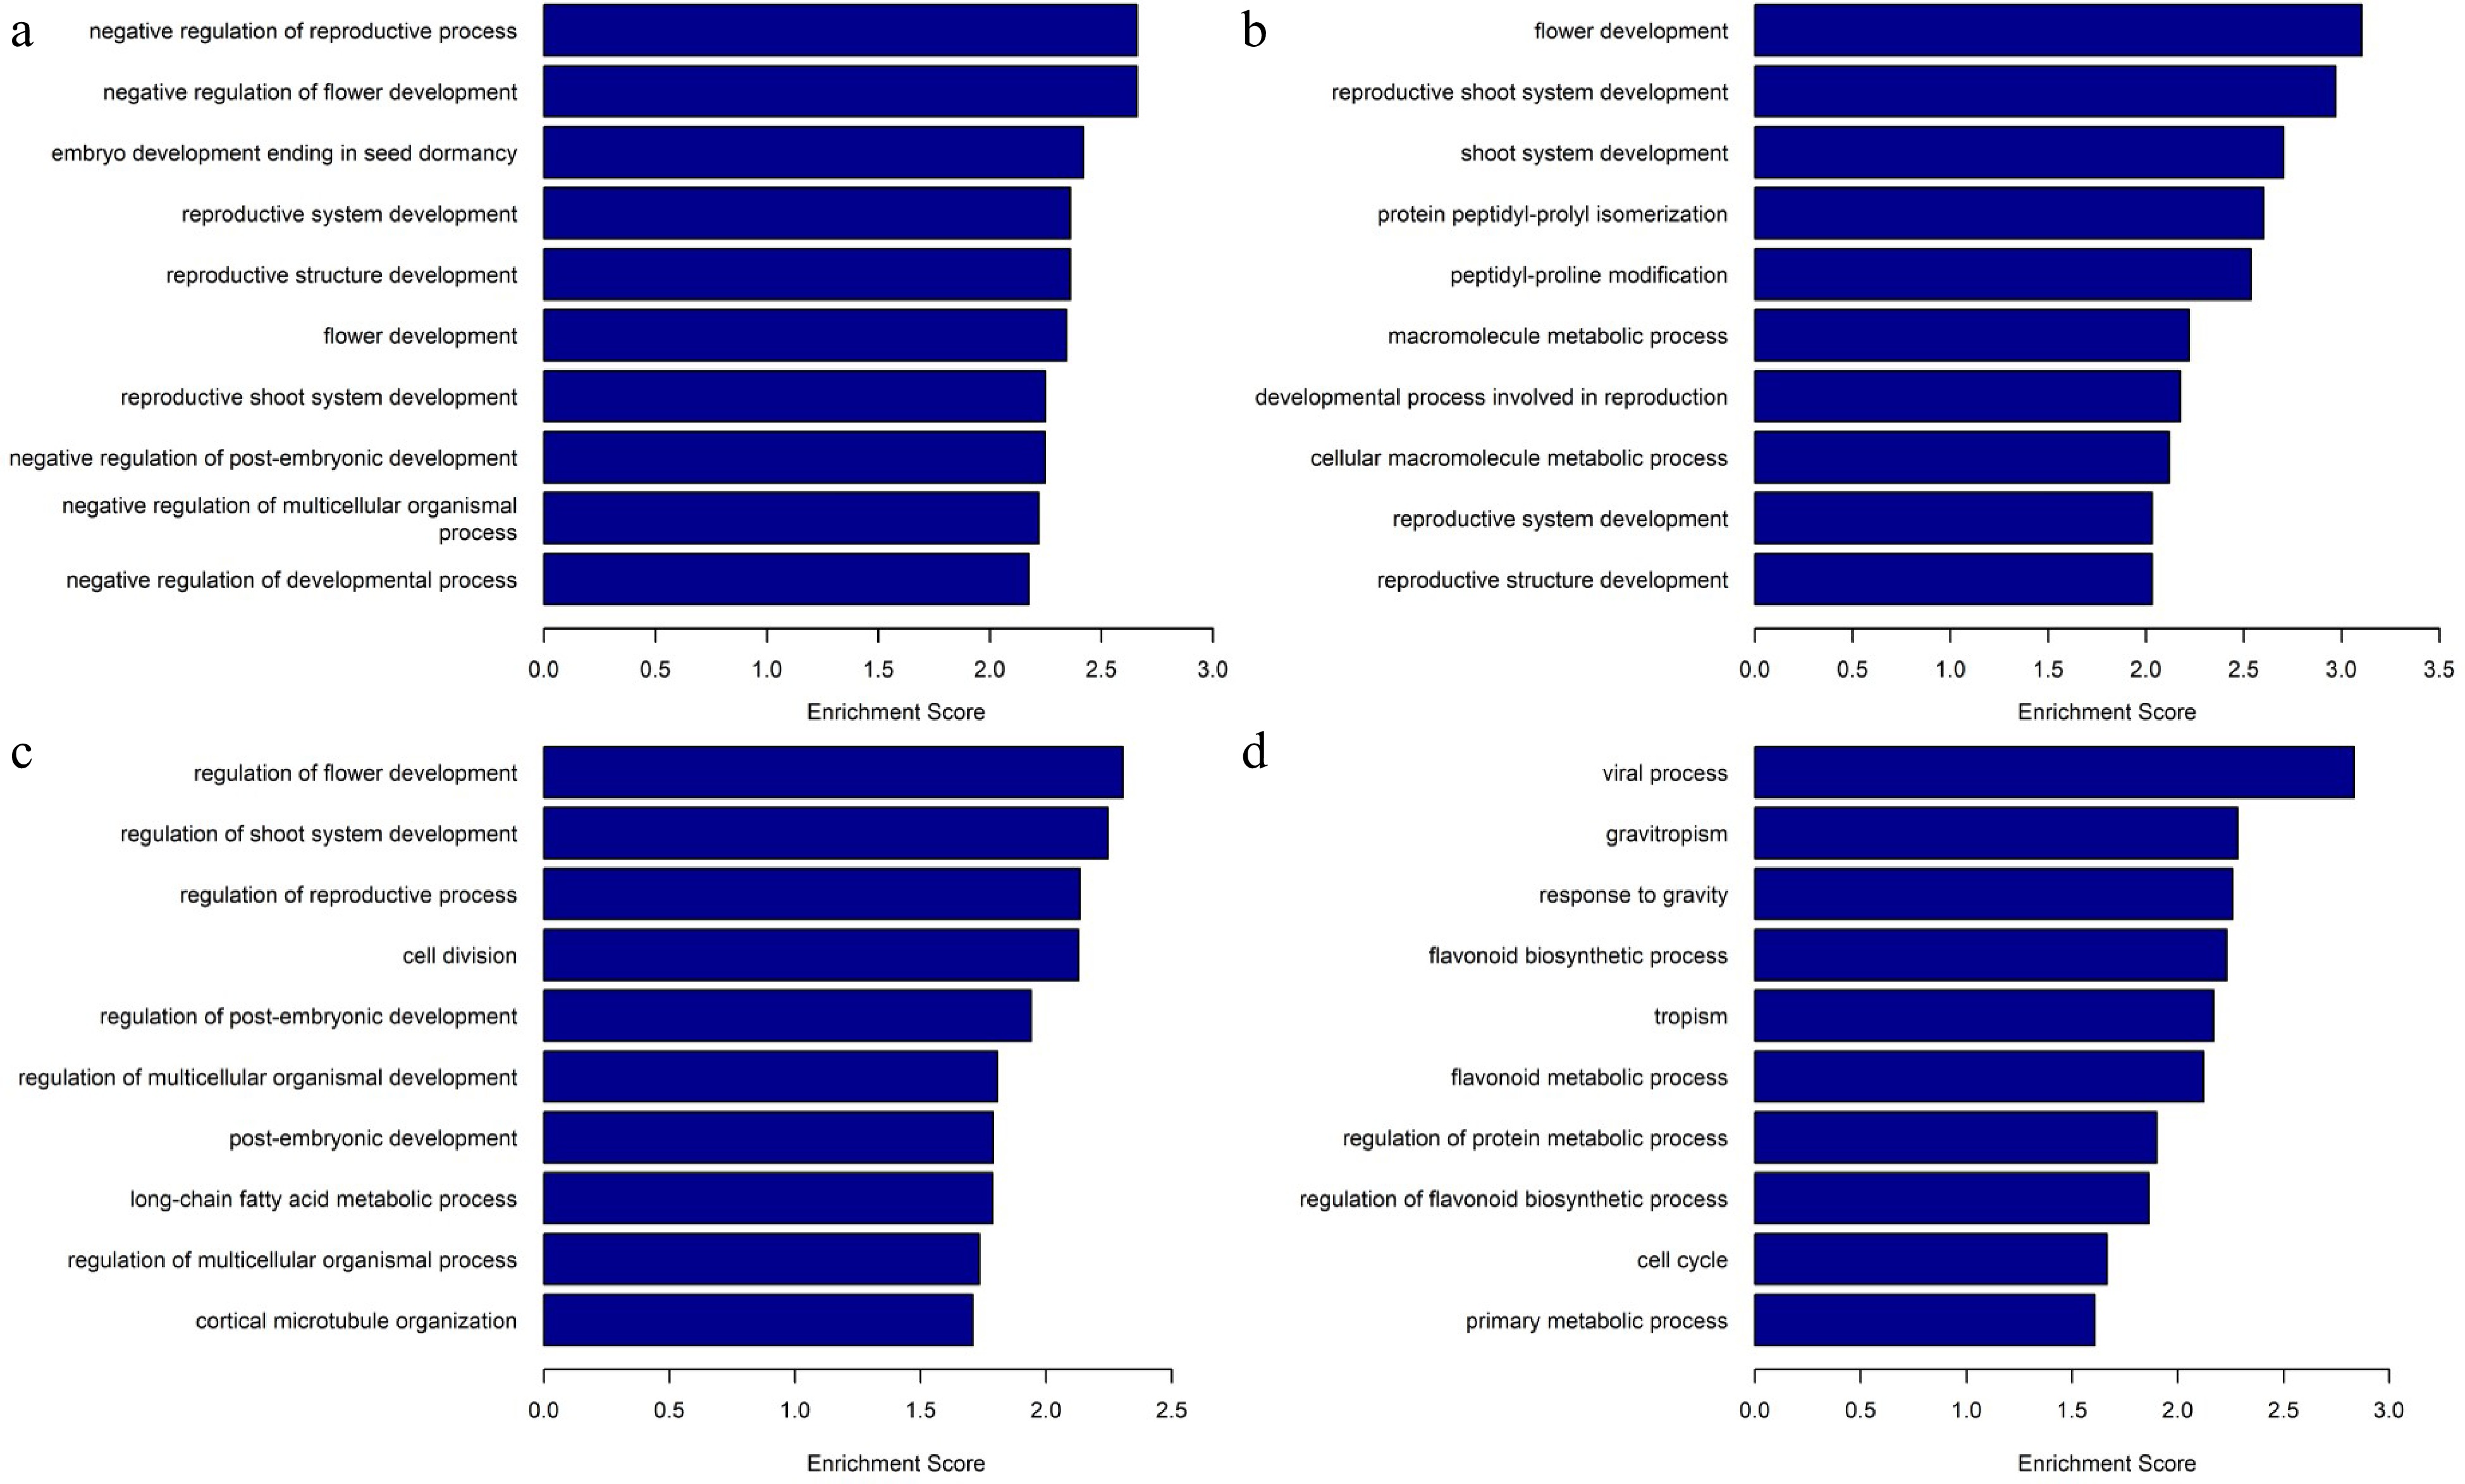
Figure 6.
Gene Ontology analysis and biological processes of differentially methylated regions. (a) Enriched biological processes in differentially hypermethylated regions of P_3_2_vs_P_3_1. (b) Enriched biological processes in differentially hypermethylated regions of P_7_2_vs_P_7_1. (c) Enriched biological processes in differentially hypomethylated regions of P_3_2_vs_ P_3_1, (d) Enriched biological processes in differentially hypomethylated regions of P_7_2_vs_ P_7_1.
-
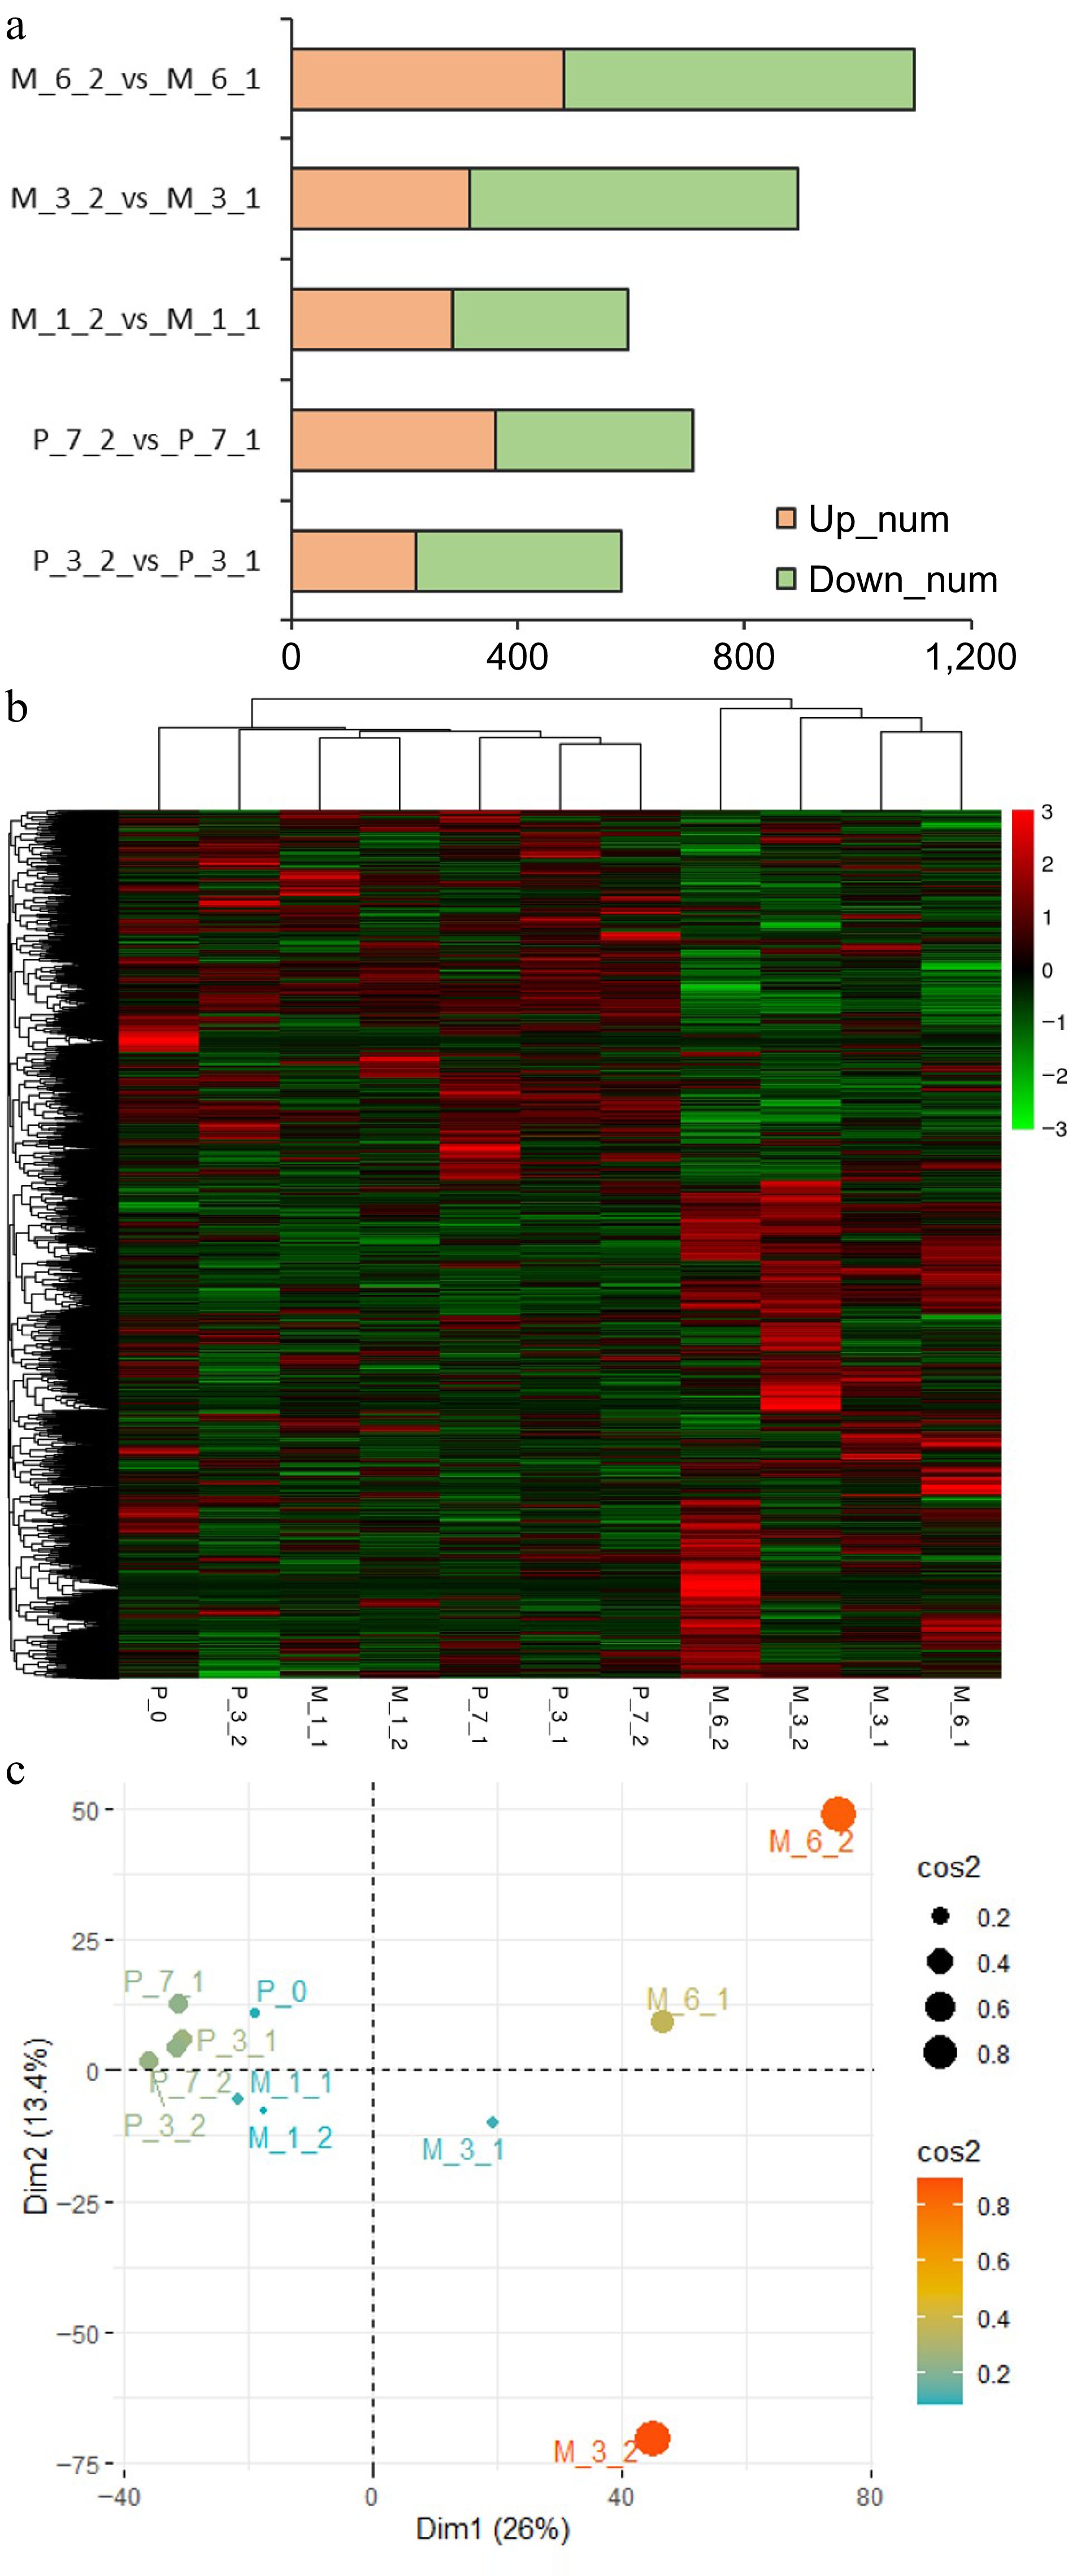
Figure 7.
Results of RNA sequencing. (a) The differentially expressed genes between untreated (P_3_1, P_7_1, M_1_1, M_3_1, M_6_1) and 5-aza-dC treated (P_3_2, P_7_2, M_1_2, M_3_2, M_6_2) embryogenic tissues on the 3rd day (P_3) and 7th day (P_7) of pre-maturation and the 1st week (M_1), 3rd week (M_3), and 6th week (M_6) of maturation. (b) Heatmap of clustering analysis with all samples (P_0, P_3_1, P_7_1, P_3_2, P_7_2, M_1_1, M_1_2, M_3_1, M_3_2, M_6_1, M_6_2). (c) PCA analysis with all samples.
-
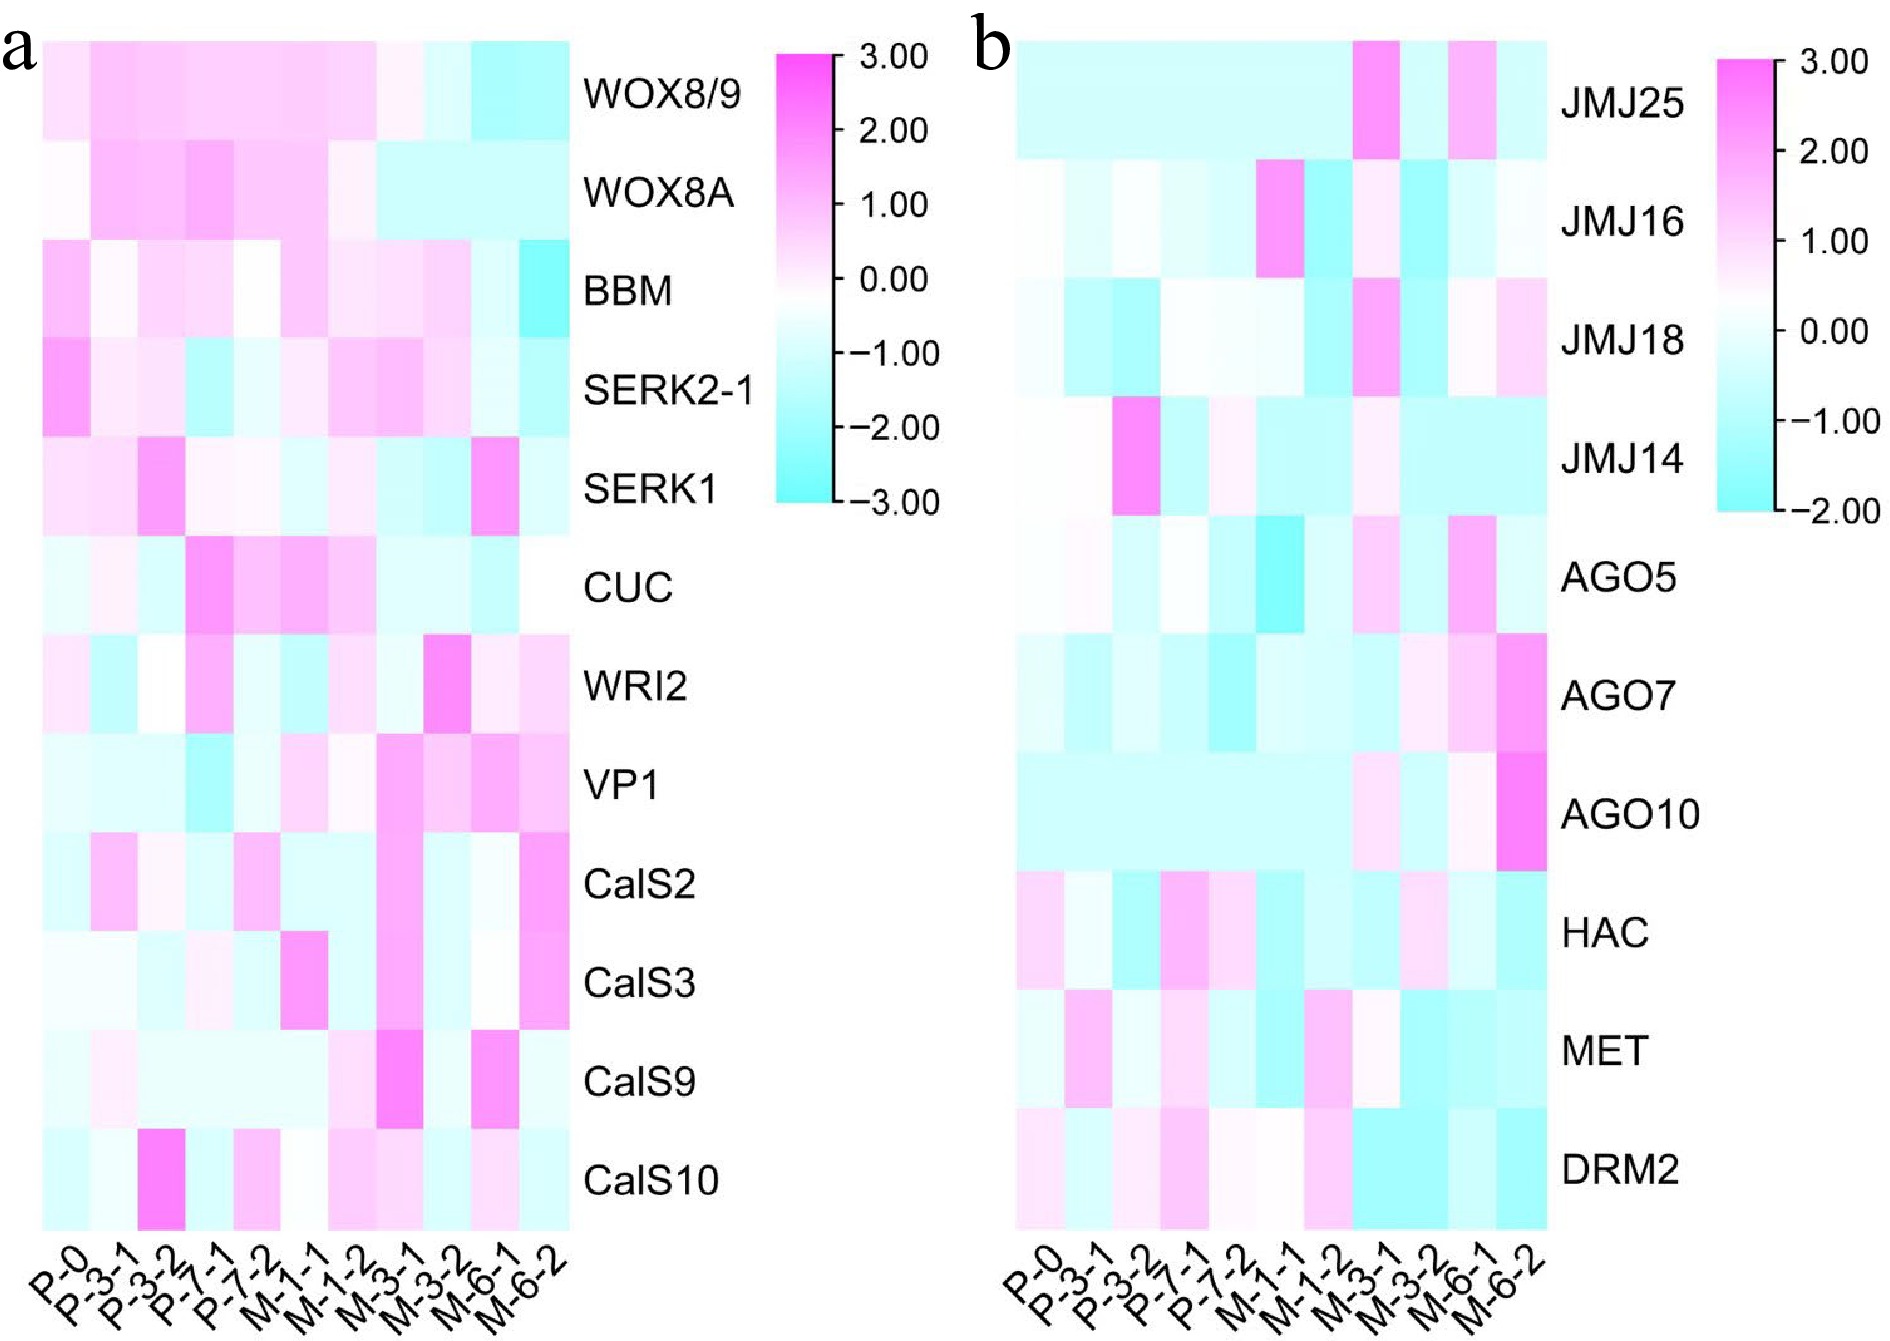
Figure 8.
Results of heatmap. (a) The expression profile of embryogenic genes during the development of SEs. (b) The expression profile of epigenetic genes during the development of SEs.
-
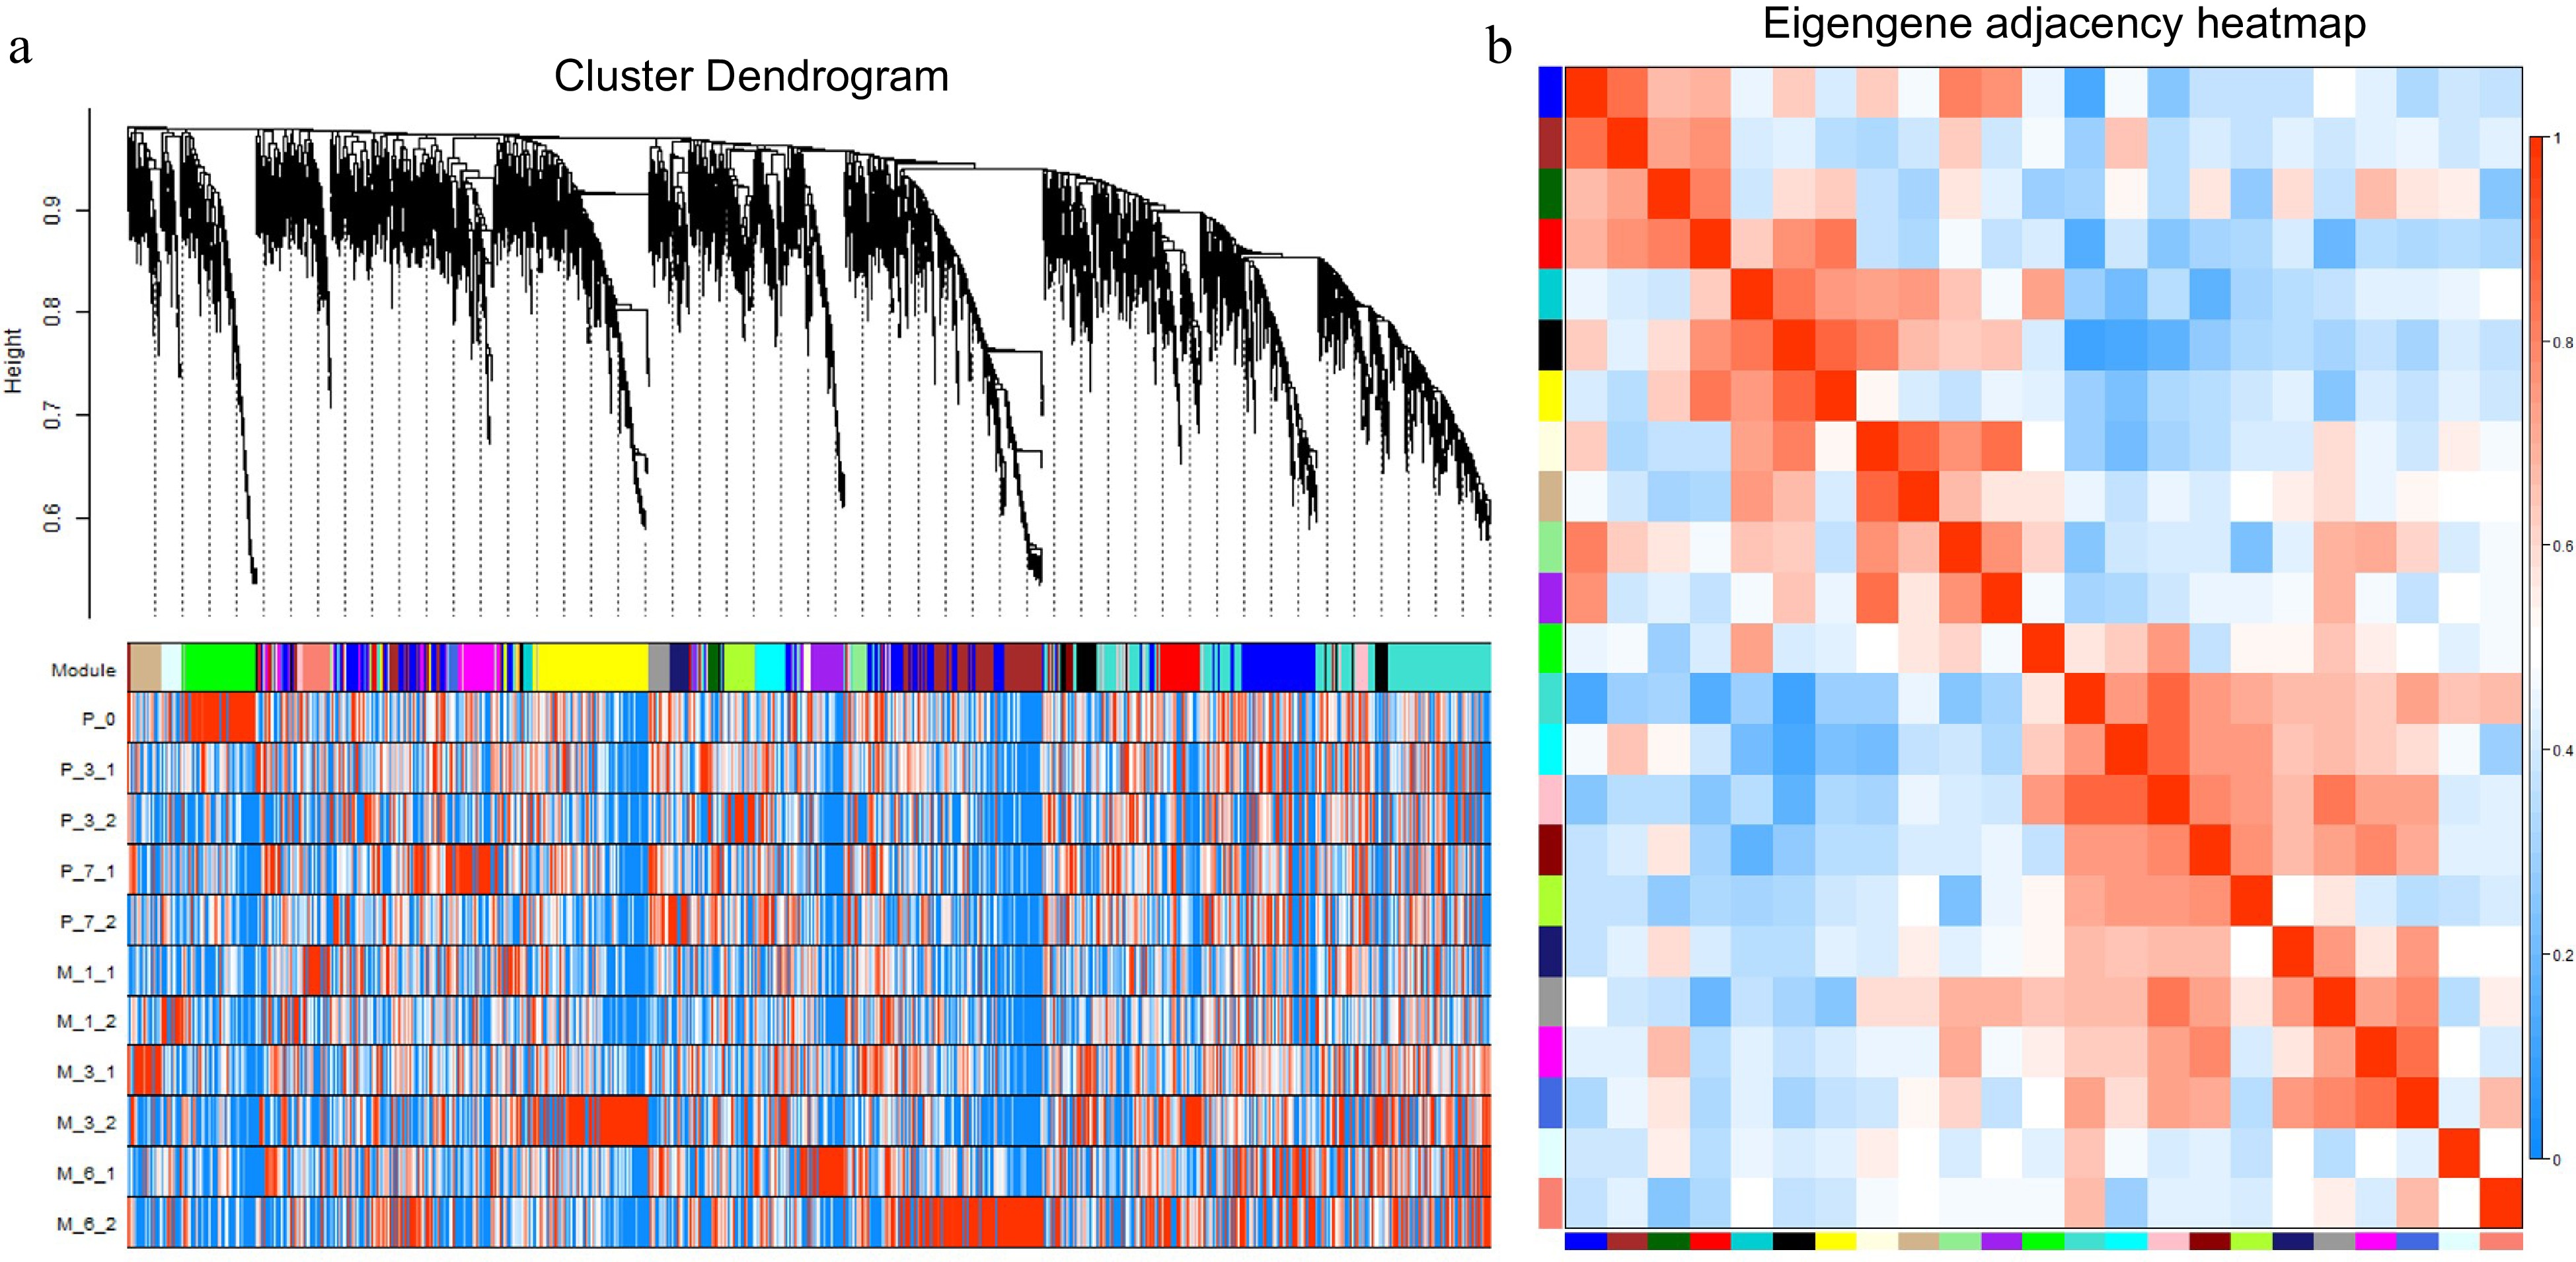
Figure 9.
WGCNA analysis of 5970 differentially expressed genes. (a) Hierarchical cluster tree showing coexpression modules with differential expression trends identified by WGCNA. Each leaf in the tree is one gene, and the expression profile of each gene is displayed in the following heatmap. The major tree branches constitute 23 modules labeled by different colors. (b) Eigengene adjacency heatmap. Each row and column correspond to a module.
-
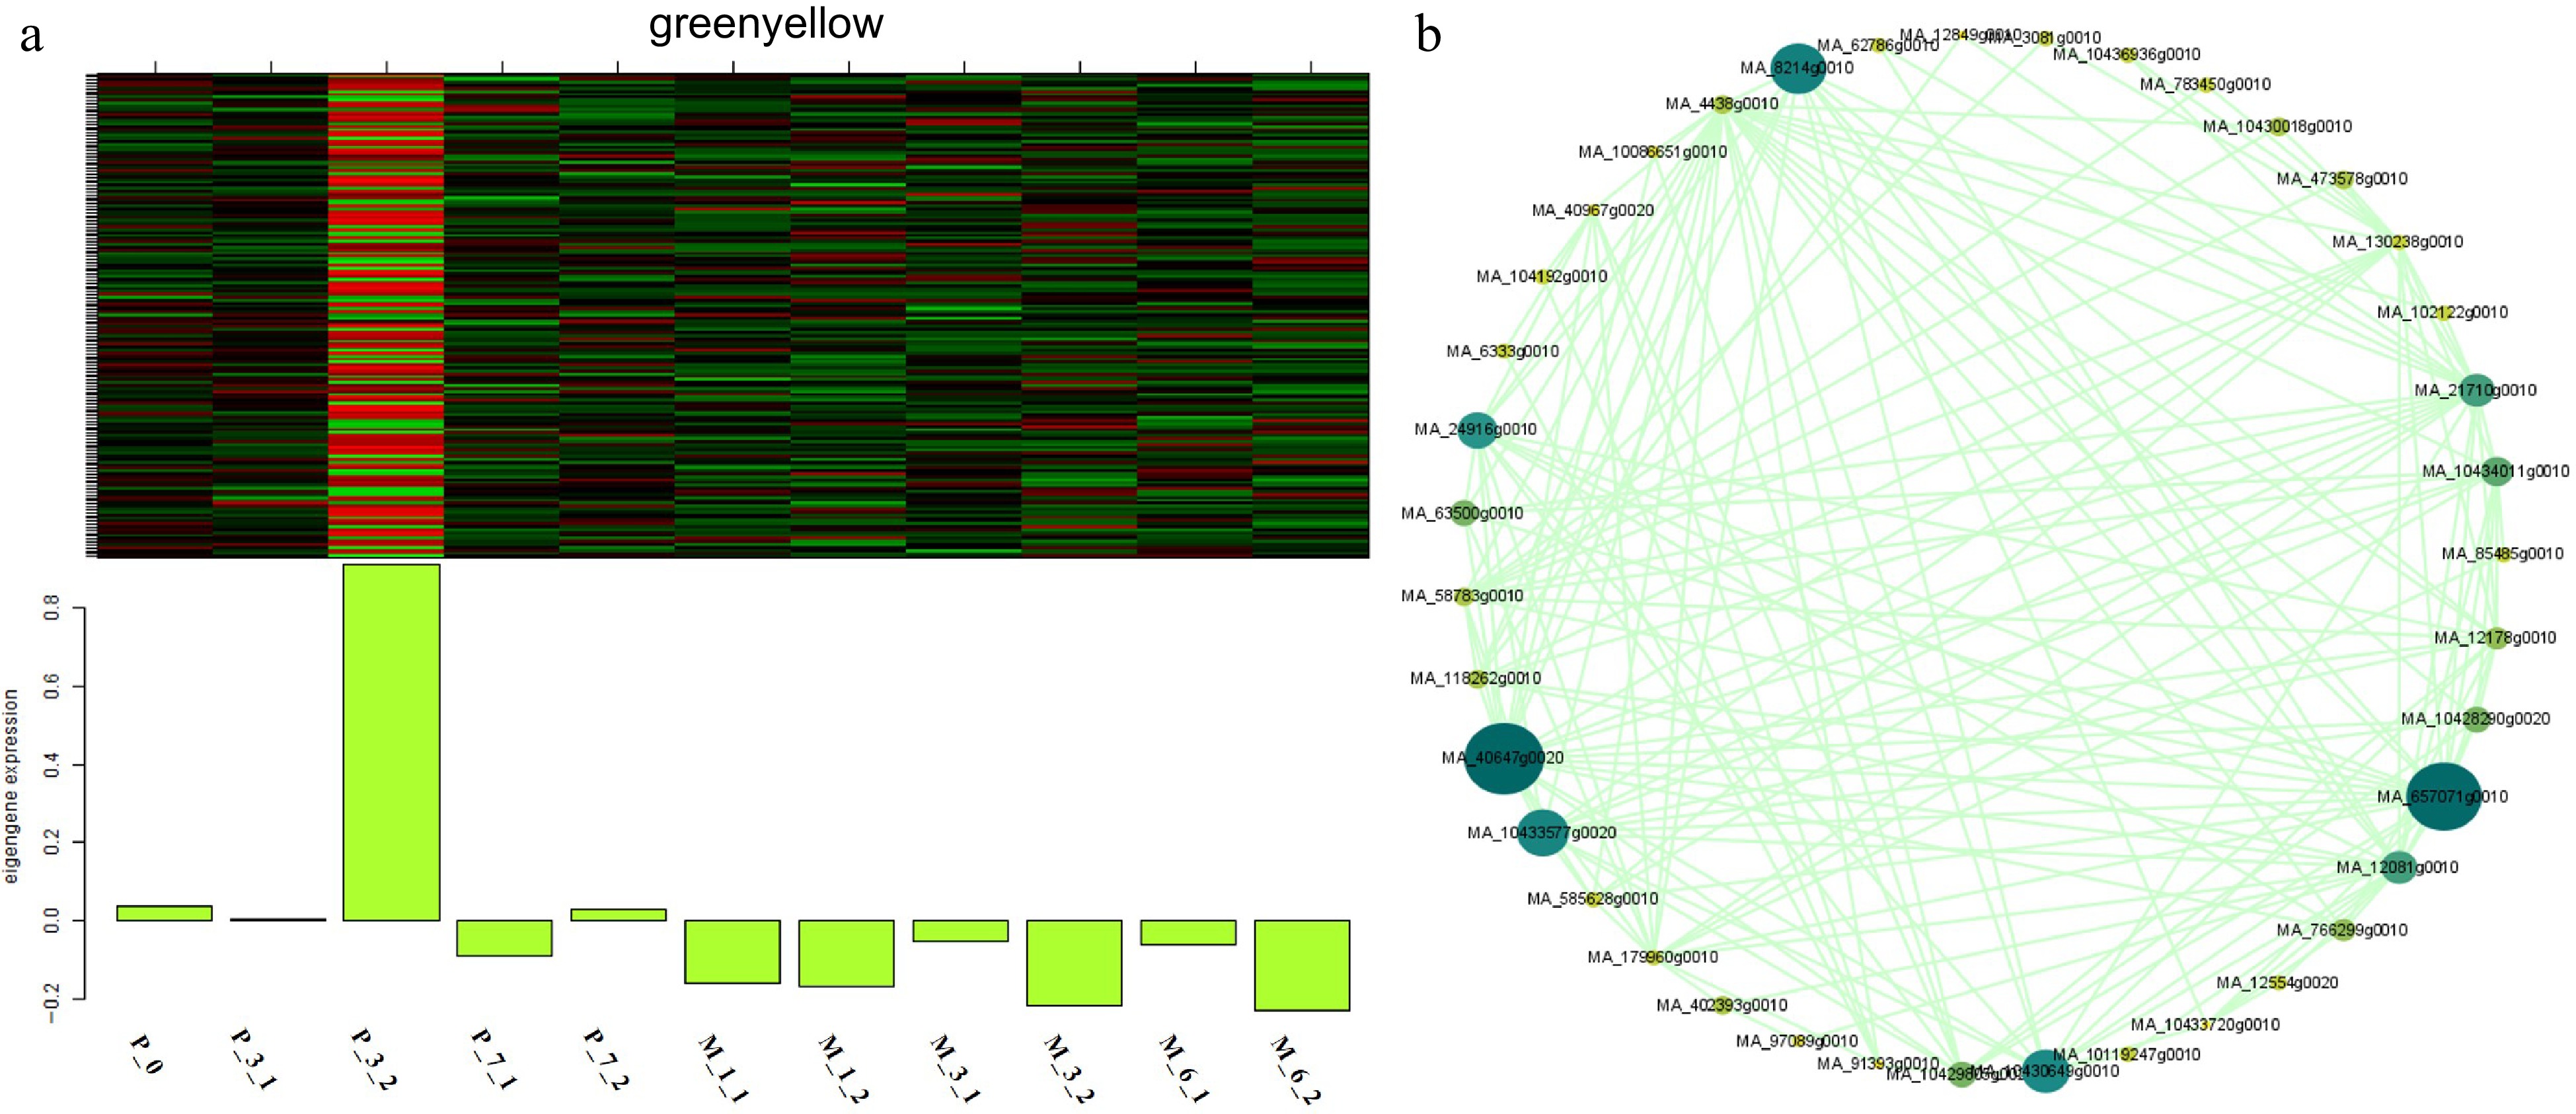
Figure 10.
Expression module and correlation network associated with the sample-specific modules. Heatmaps of (a) greenyellow module show the expression profile of all co-expressed genes in the modules (labeled on top). The color scale represents the Z-score. Bar graphs (below the heat maps) show the consensus expression pattern of the co-expressed genes in each module. (b) Correlation network of genes within the greenyellow module.
-
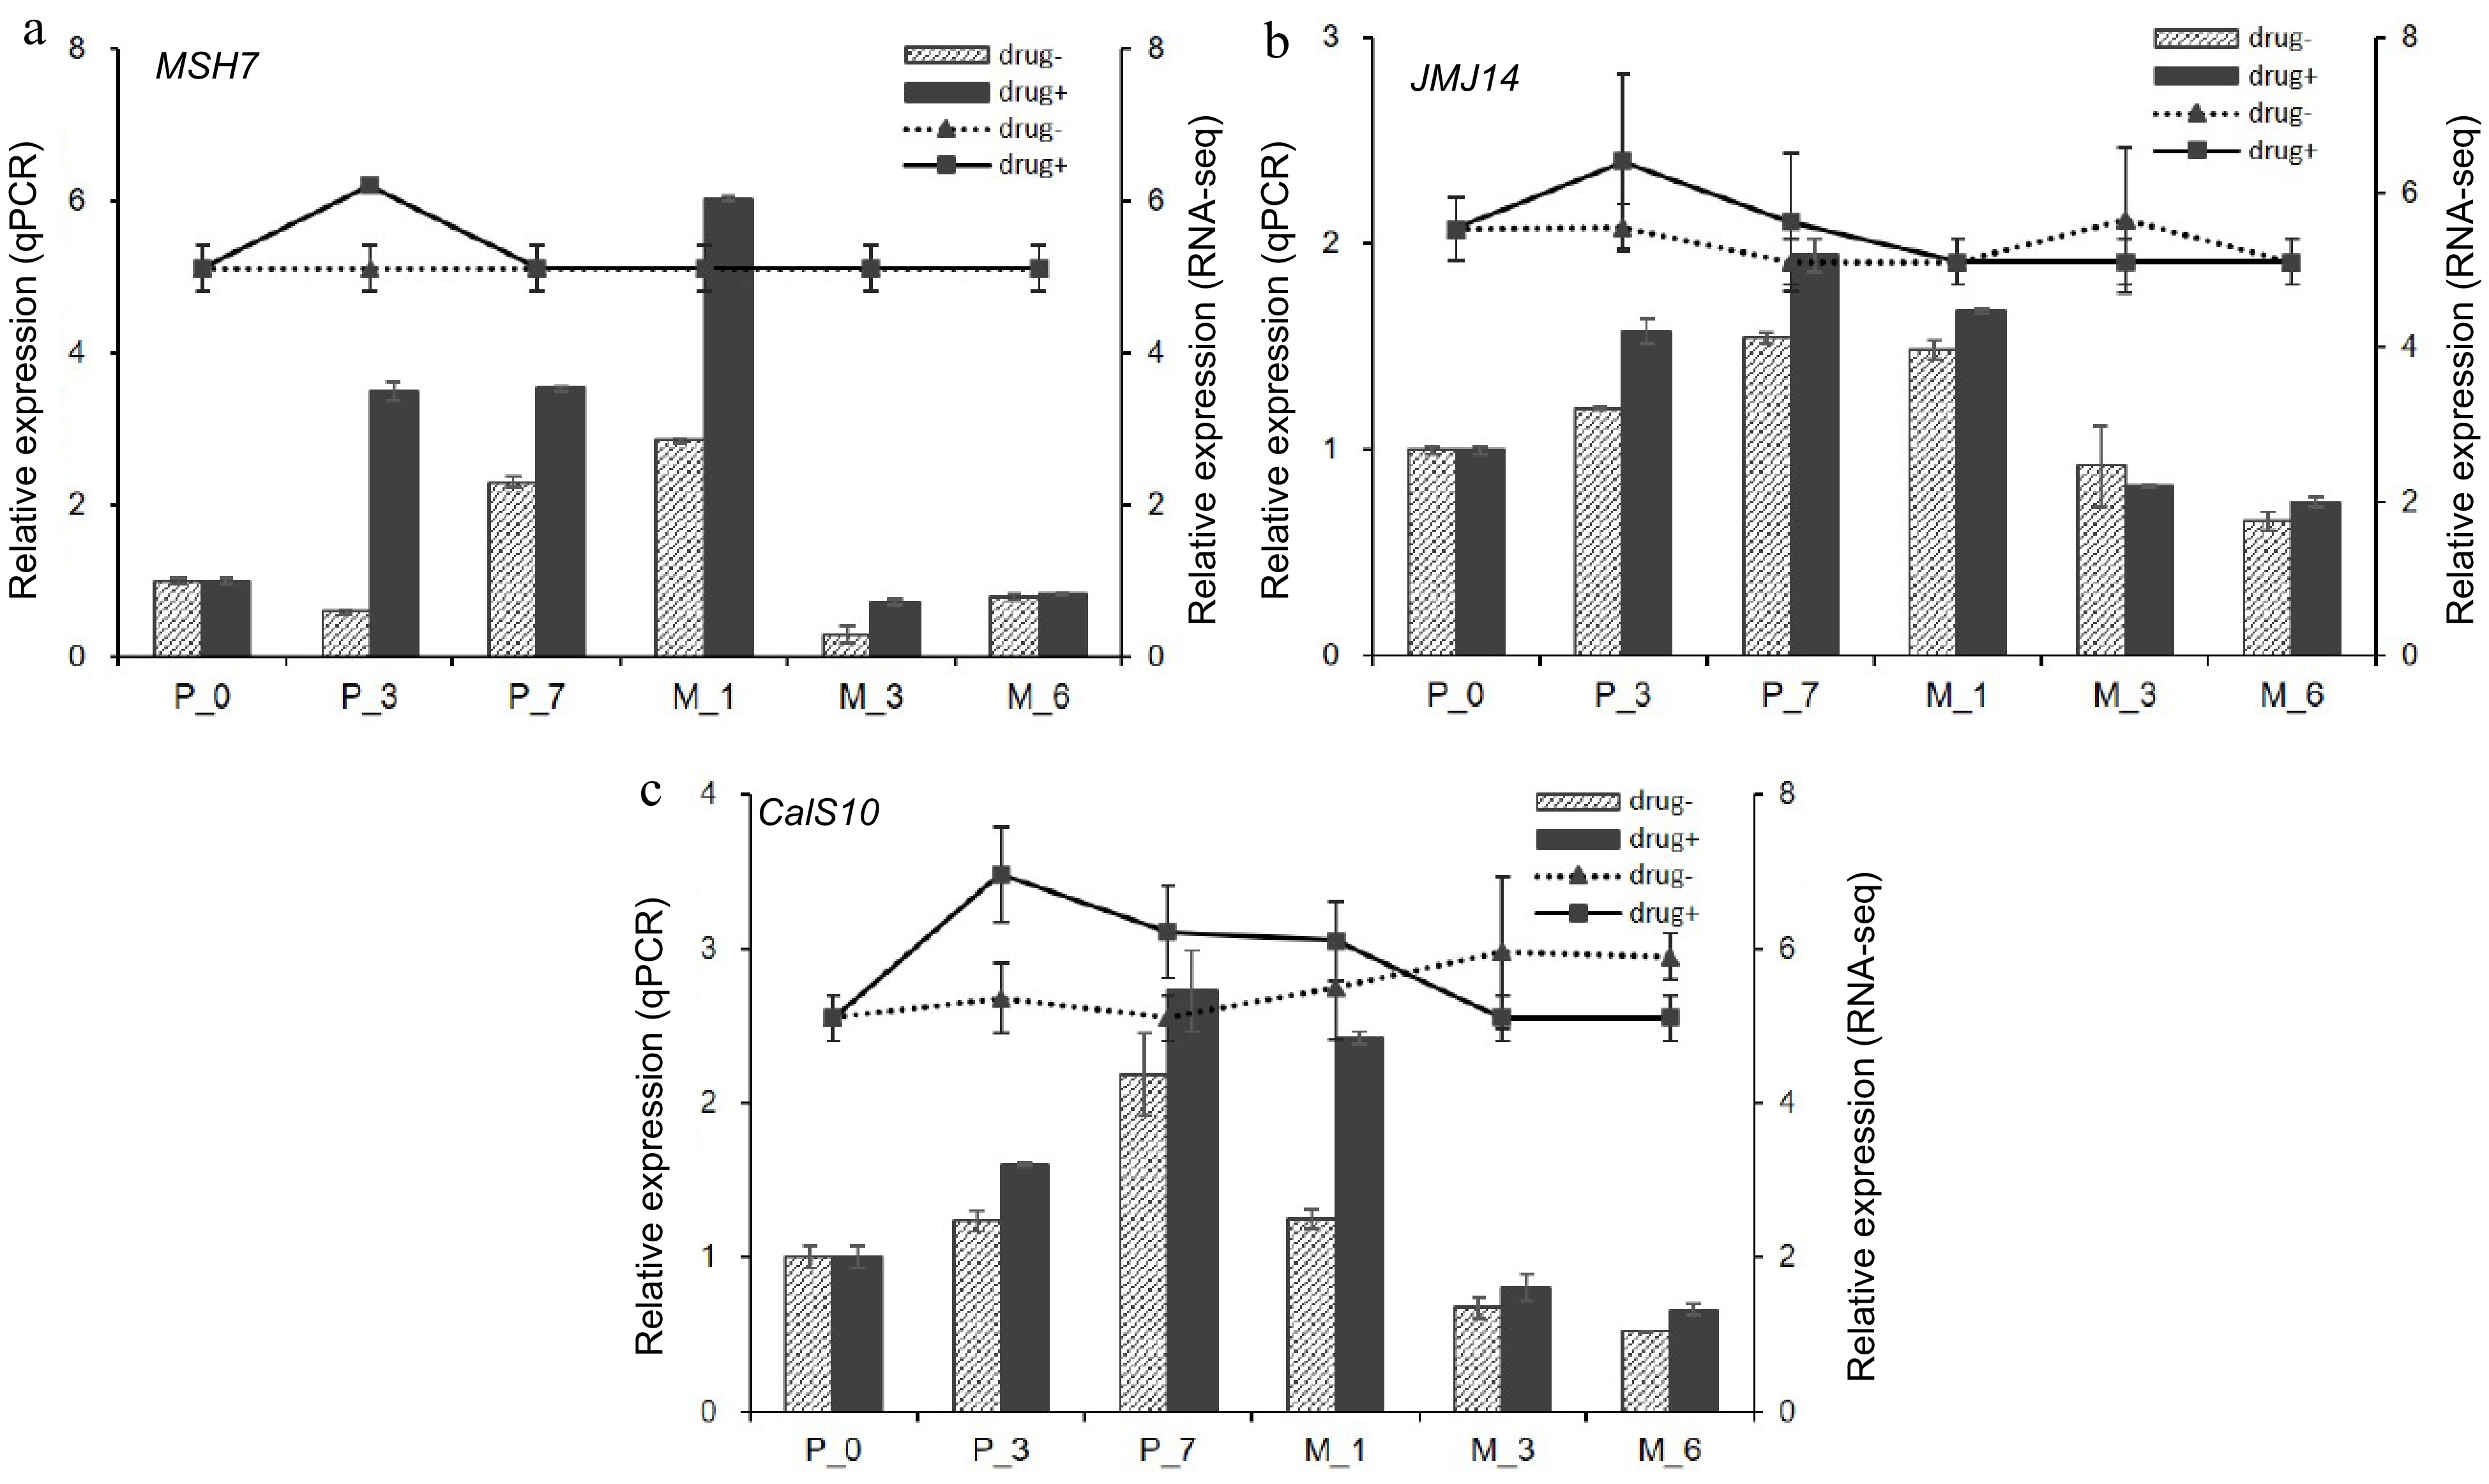
Figure 11.
qPCR verification of hub genes. qPCR results of (a) DNA mismatch repair protein MSH7-like (MSH7), (b) lysine-specific demethylase JMJ14 (JMJ14), and (c) callose synthase 10 (Cals10). Drug+ represents 5-aza-dC treated embryogenic tissues, and drug- represents untreated embryogenic tissues. The columns represent the qPCR expression level related to the left axis, while the lines represent the RNA-seq expression level correlated with the right axis.
-
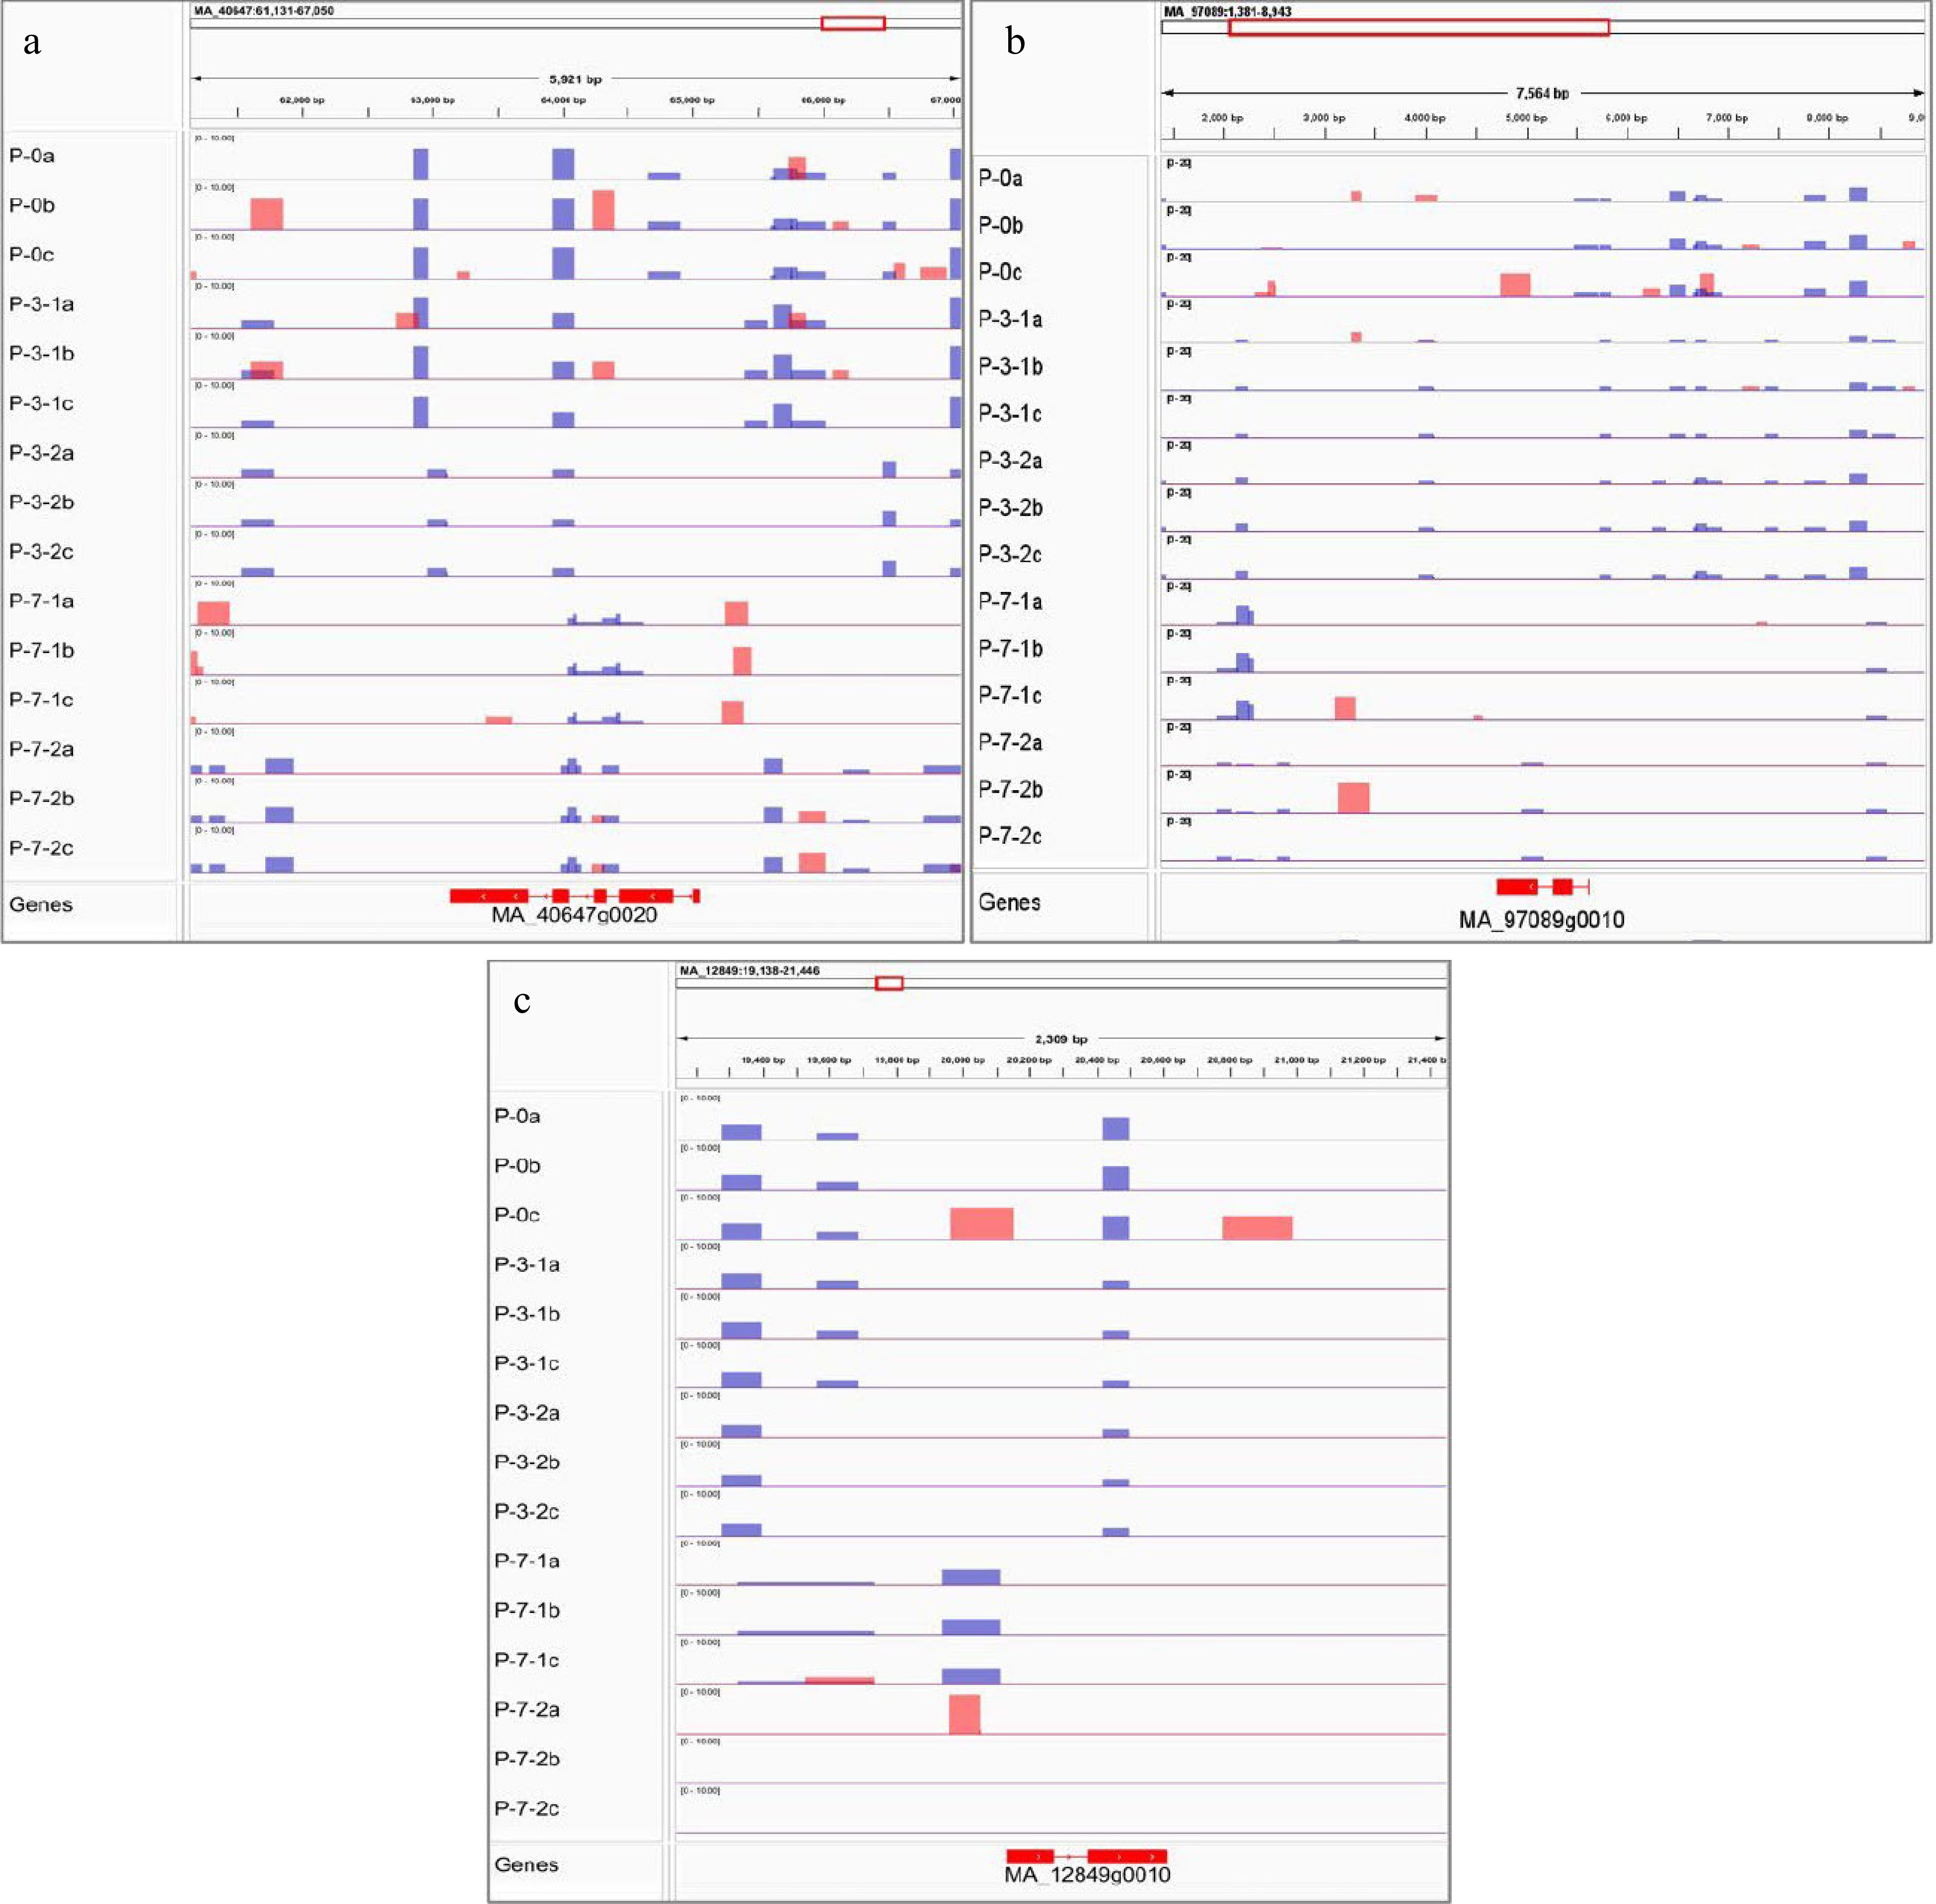
Figure 12.
Visualization results of differentially methylated regions. MeDIP results of (a) DNA mismatch repair protein MSH7-like (MSH7), (b) lysine-specific demethylase JMJ14 (JMJ14), and (c) callose synthase 10 (Cals10). Red peak represents IP, blue peak represents Input.
Figures
(12)
Tables
(0)