-

Figure 1.
Reaction equation for the synthesis of adipic acid by oxidation of cyclohexene with H2O2 catalyzed by Na2WO4.
-
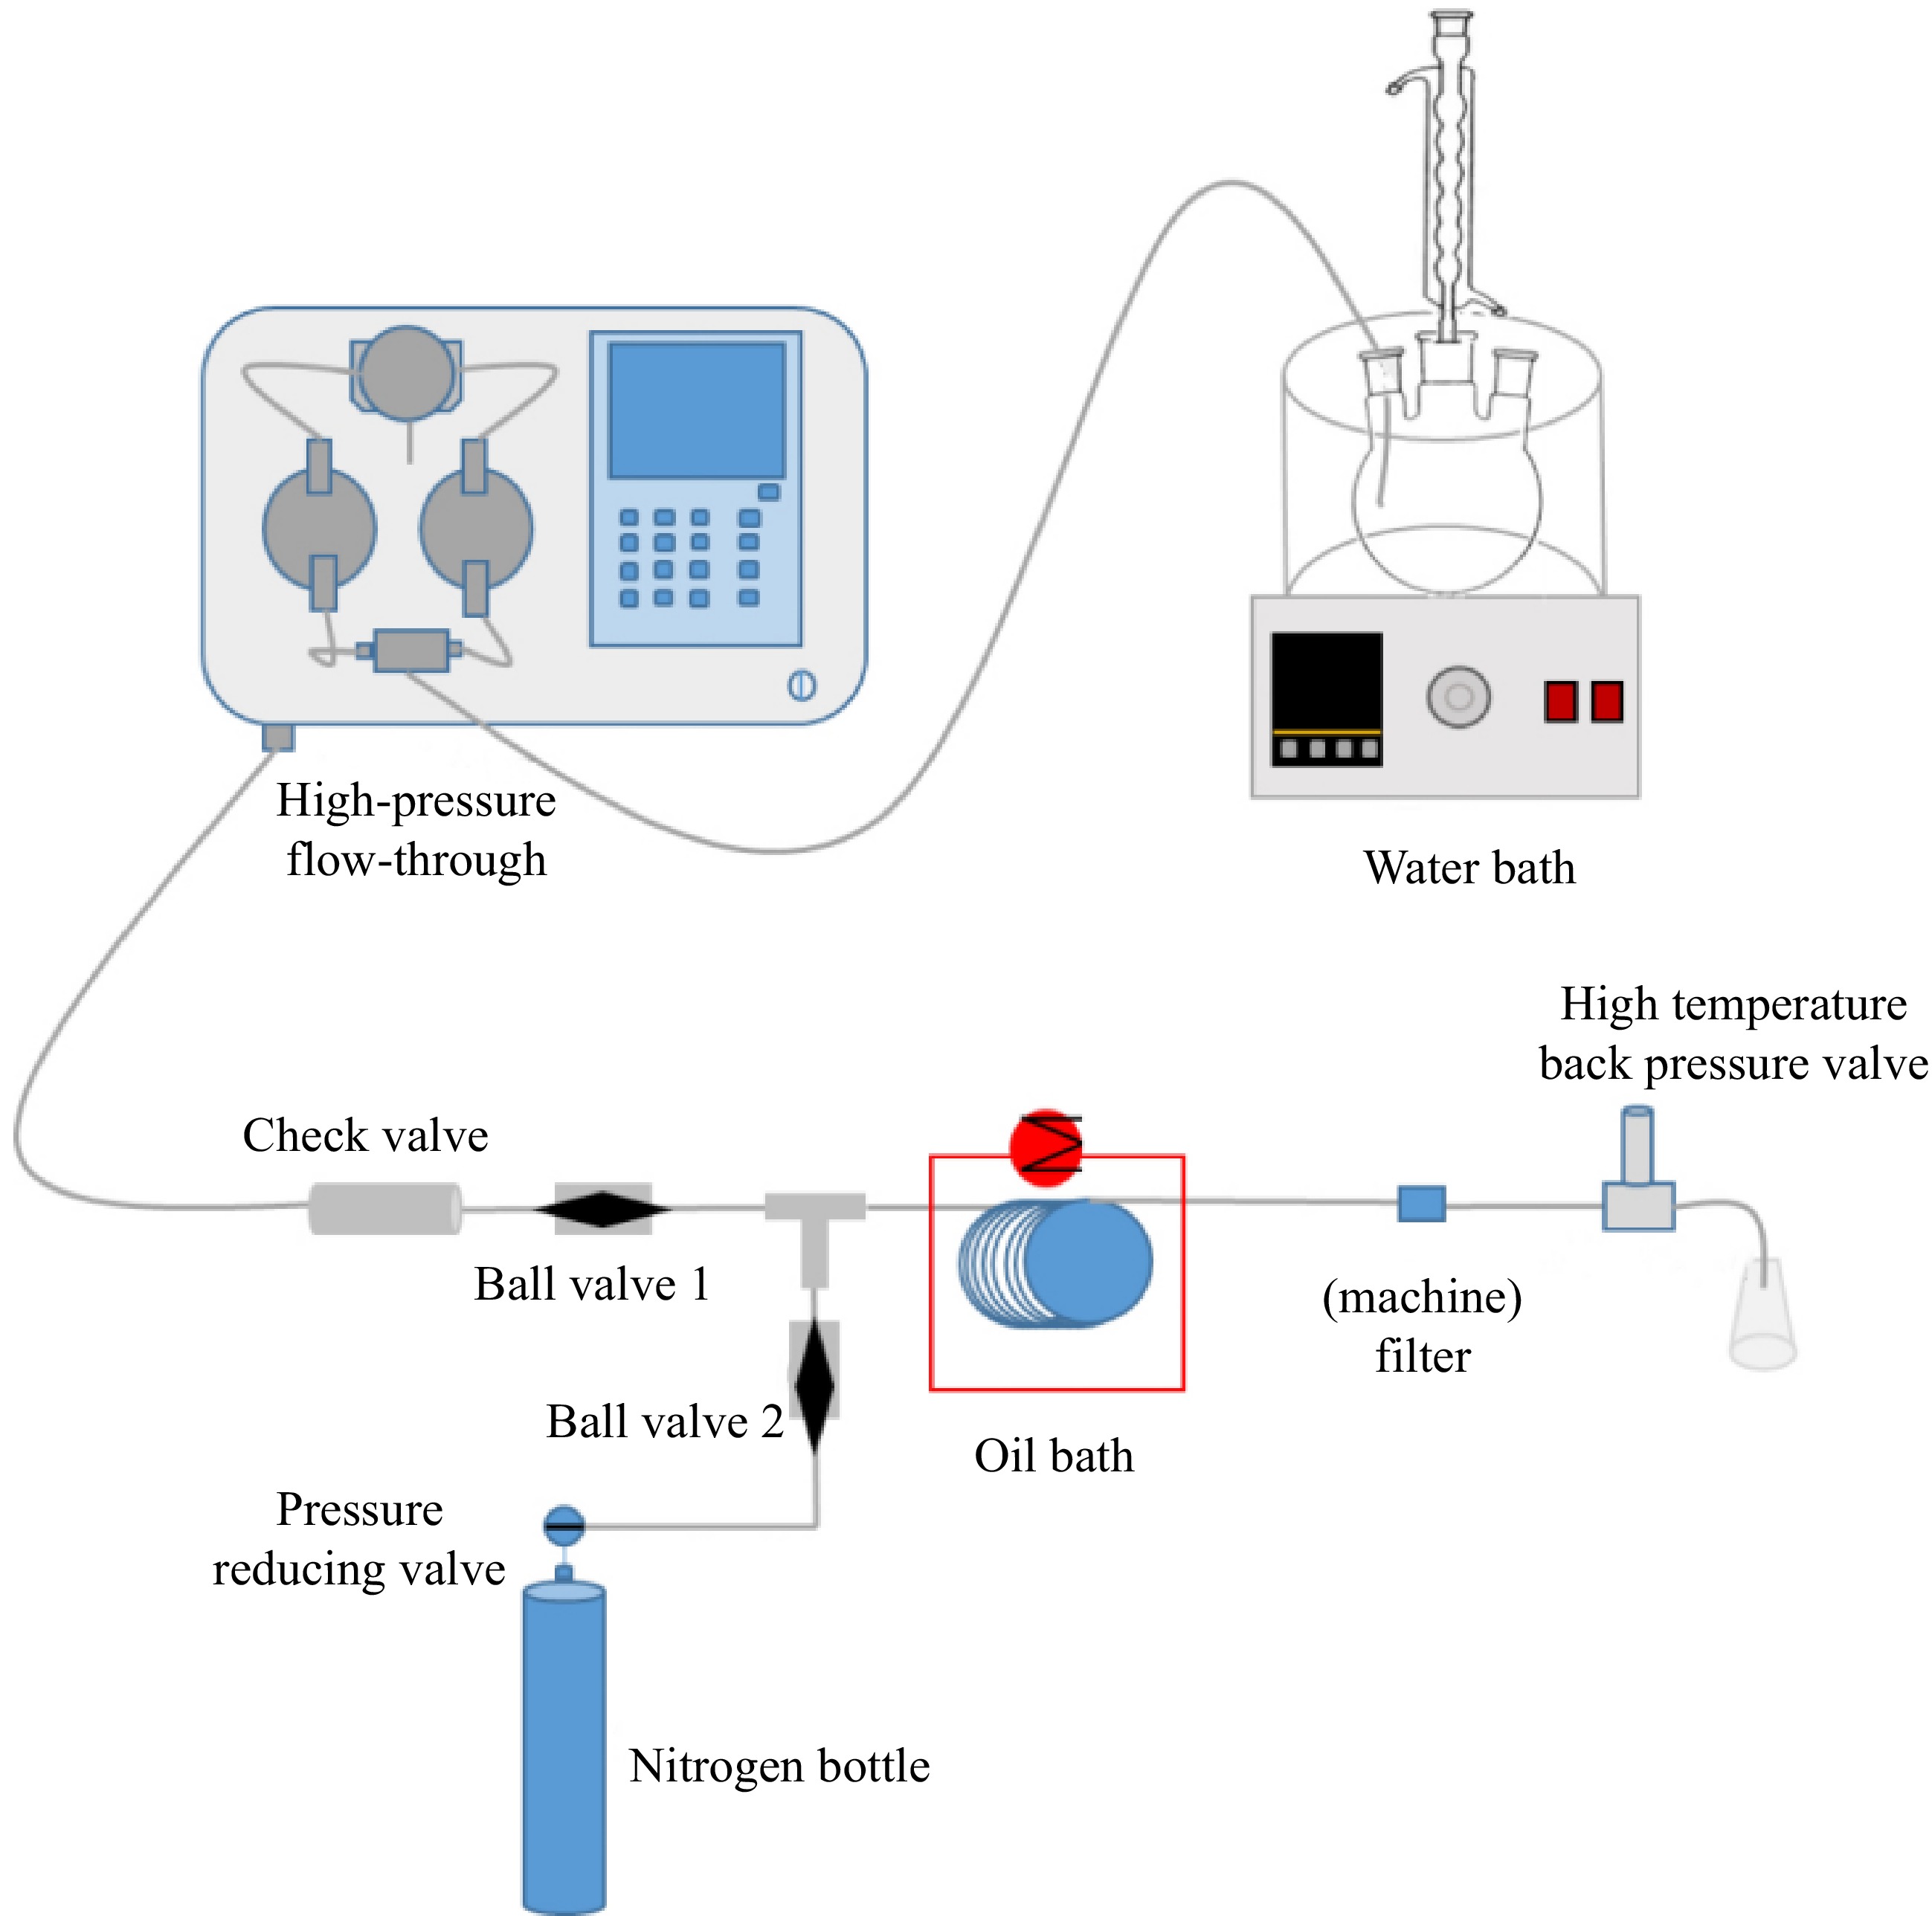
Figure 2.
High pressure microchannel reactor.
-
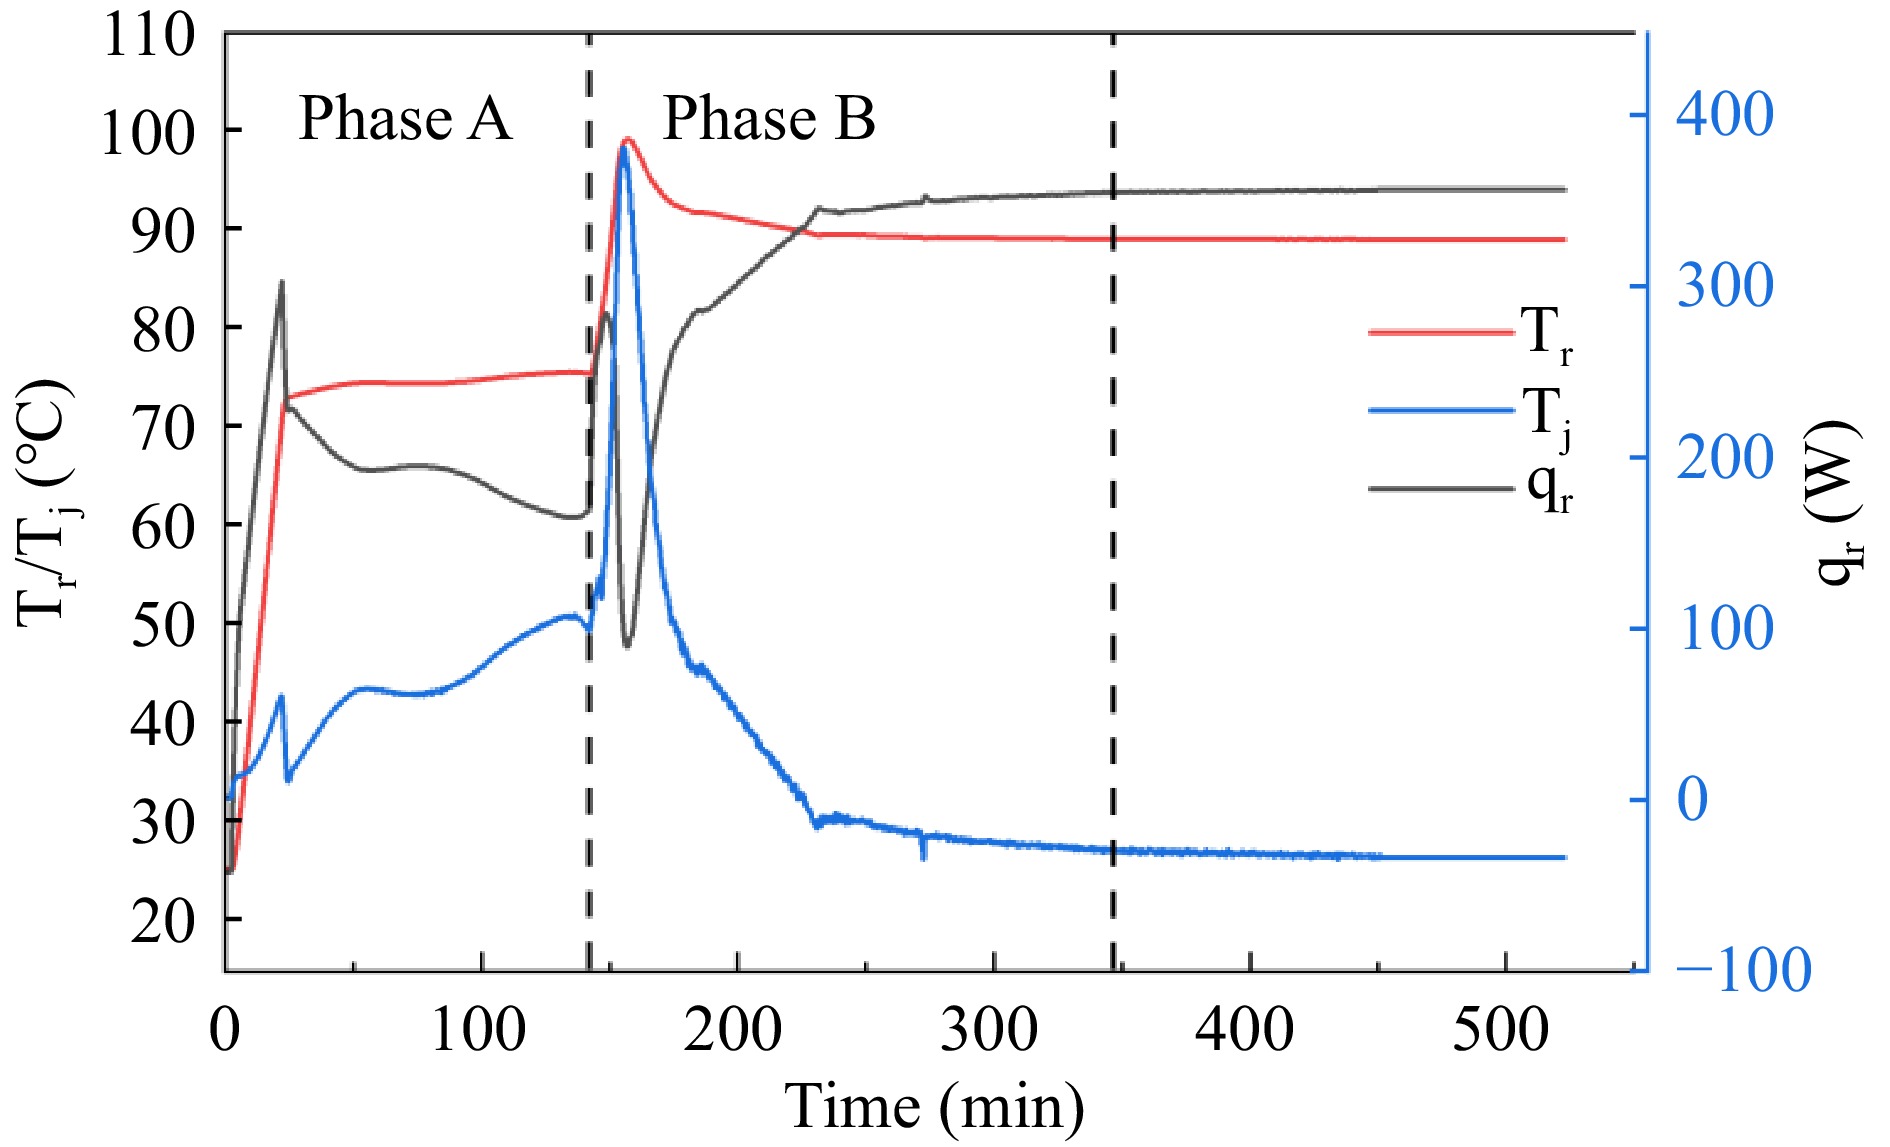
Figure 3.
The Tr, Tj, and qr curves of adipic acid synthesis reaction in RC1e experiment.
-
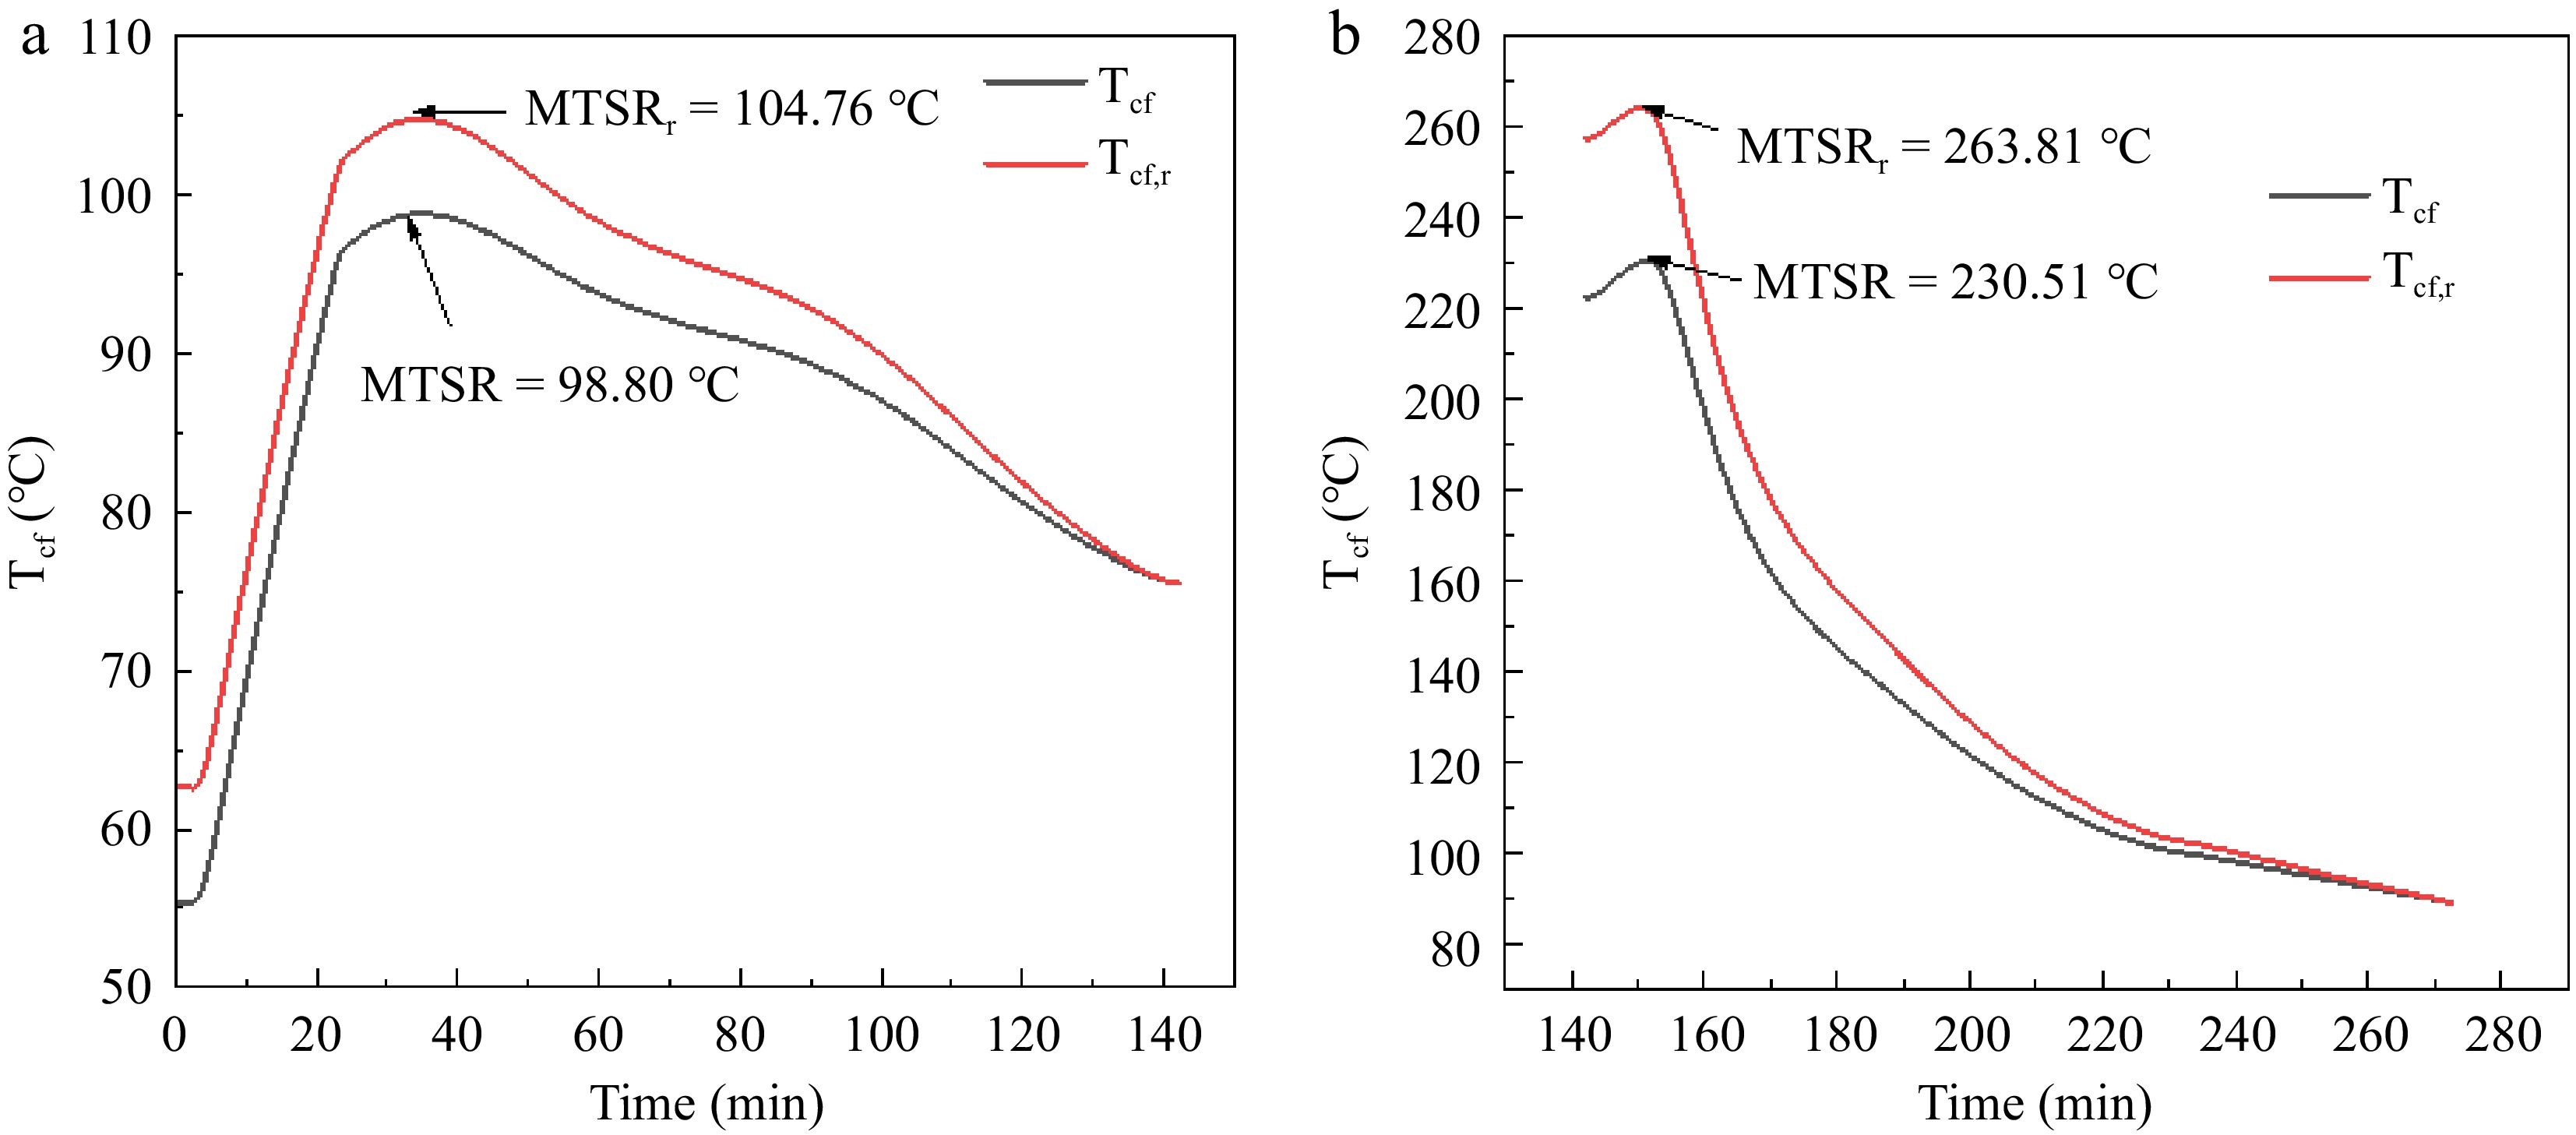
Figure 4.
Tcf curves and MTSR of adipic acid synthesis reaction (a) Phase A; (b) Phase B.
-
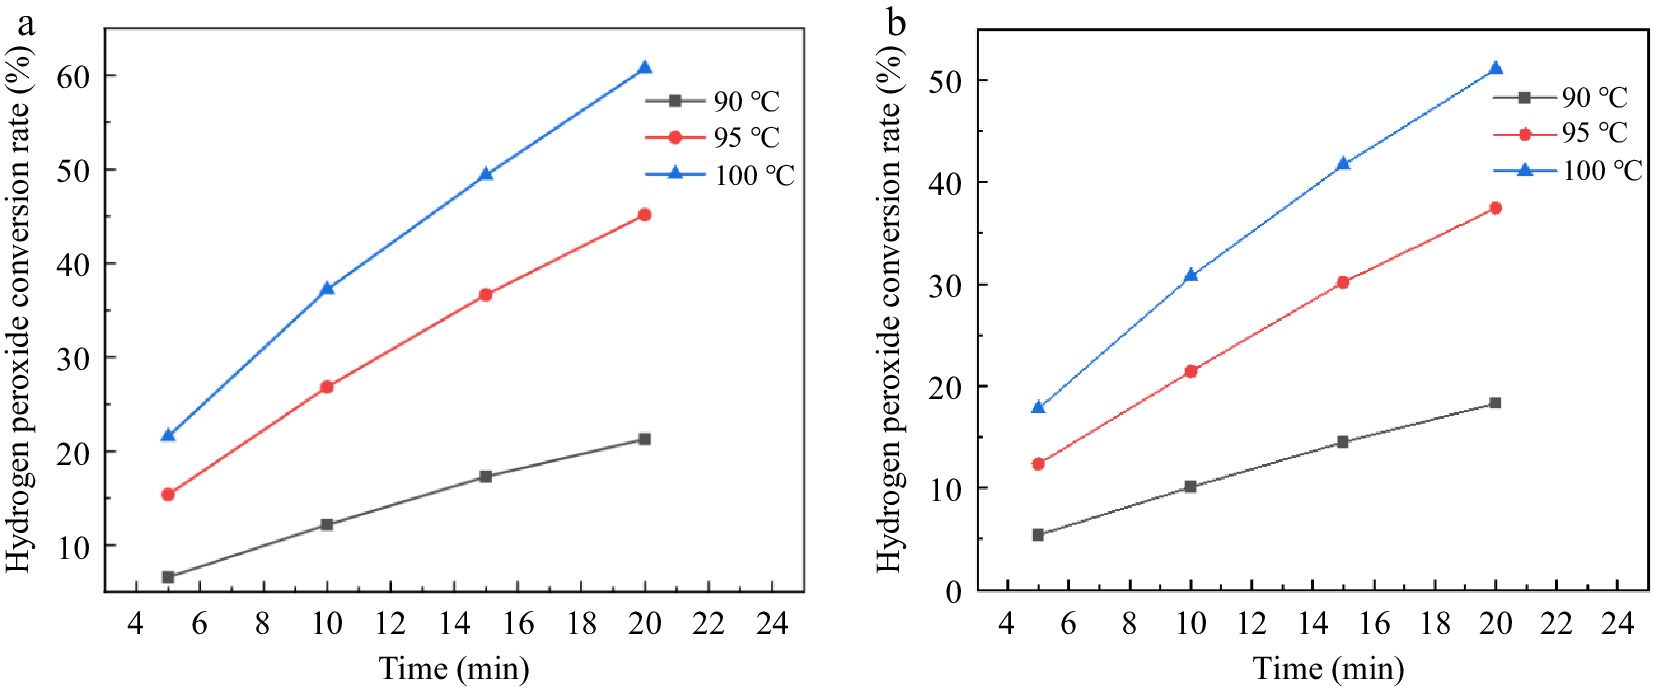
Figure 5.
Effect of reaction temperature and residence time on hydrogen peroxide ecomposition in a stainless steel capillary microreactor. (a) Reaction condition 1; (b) Reaction condition 2.
-
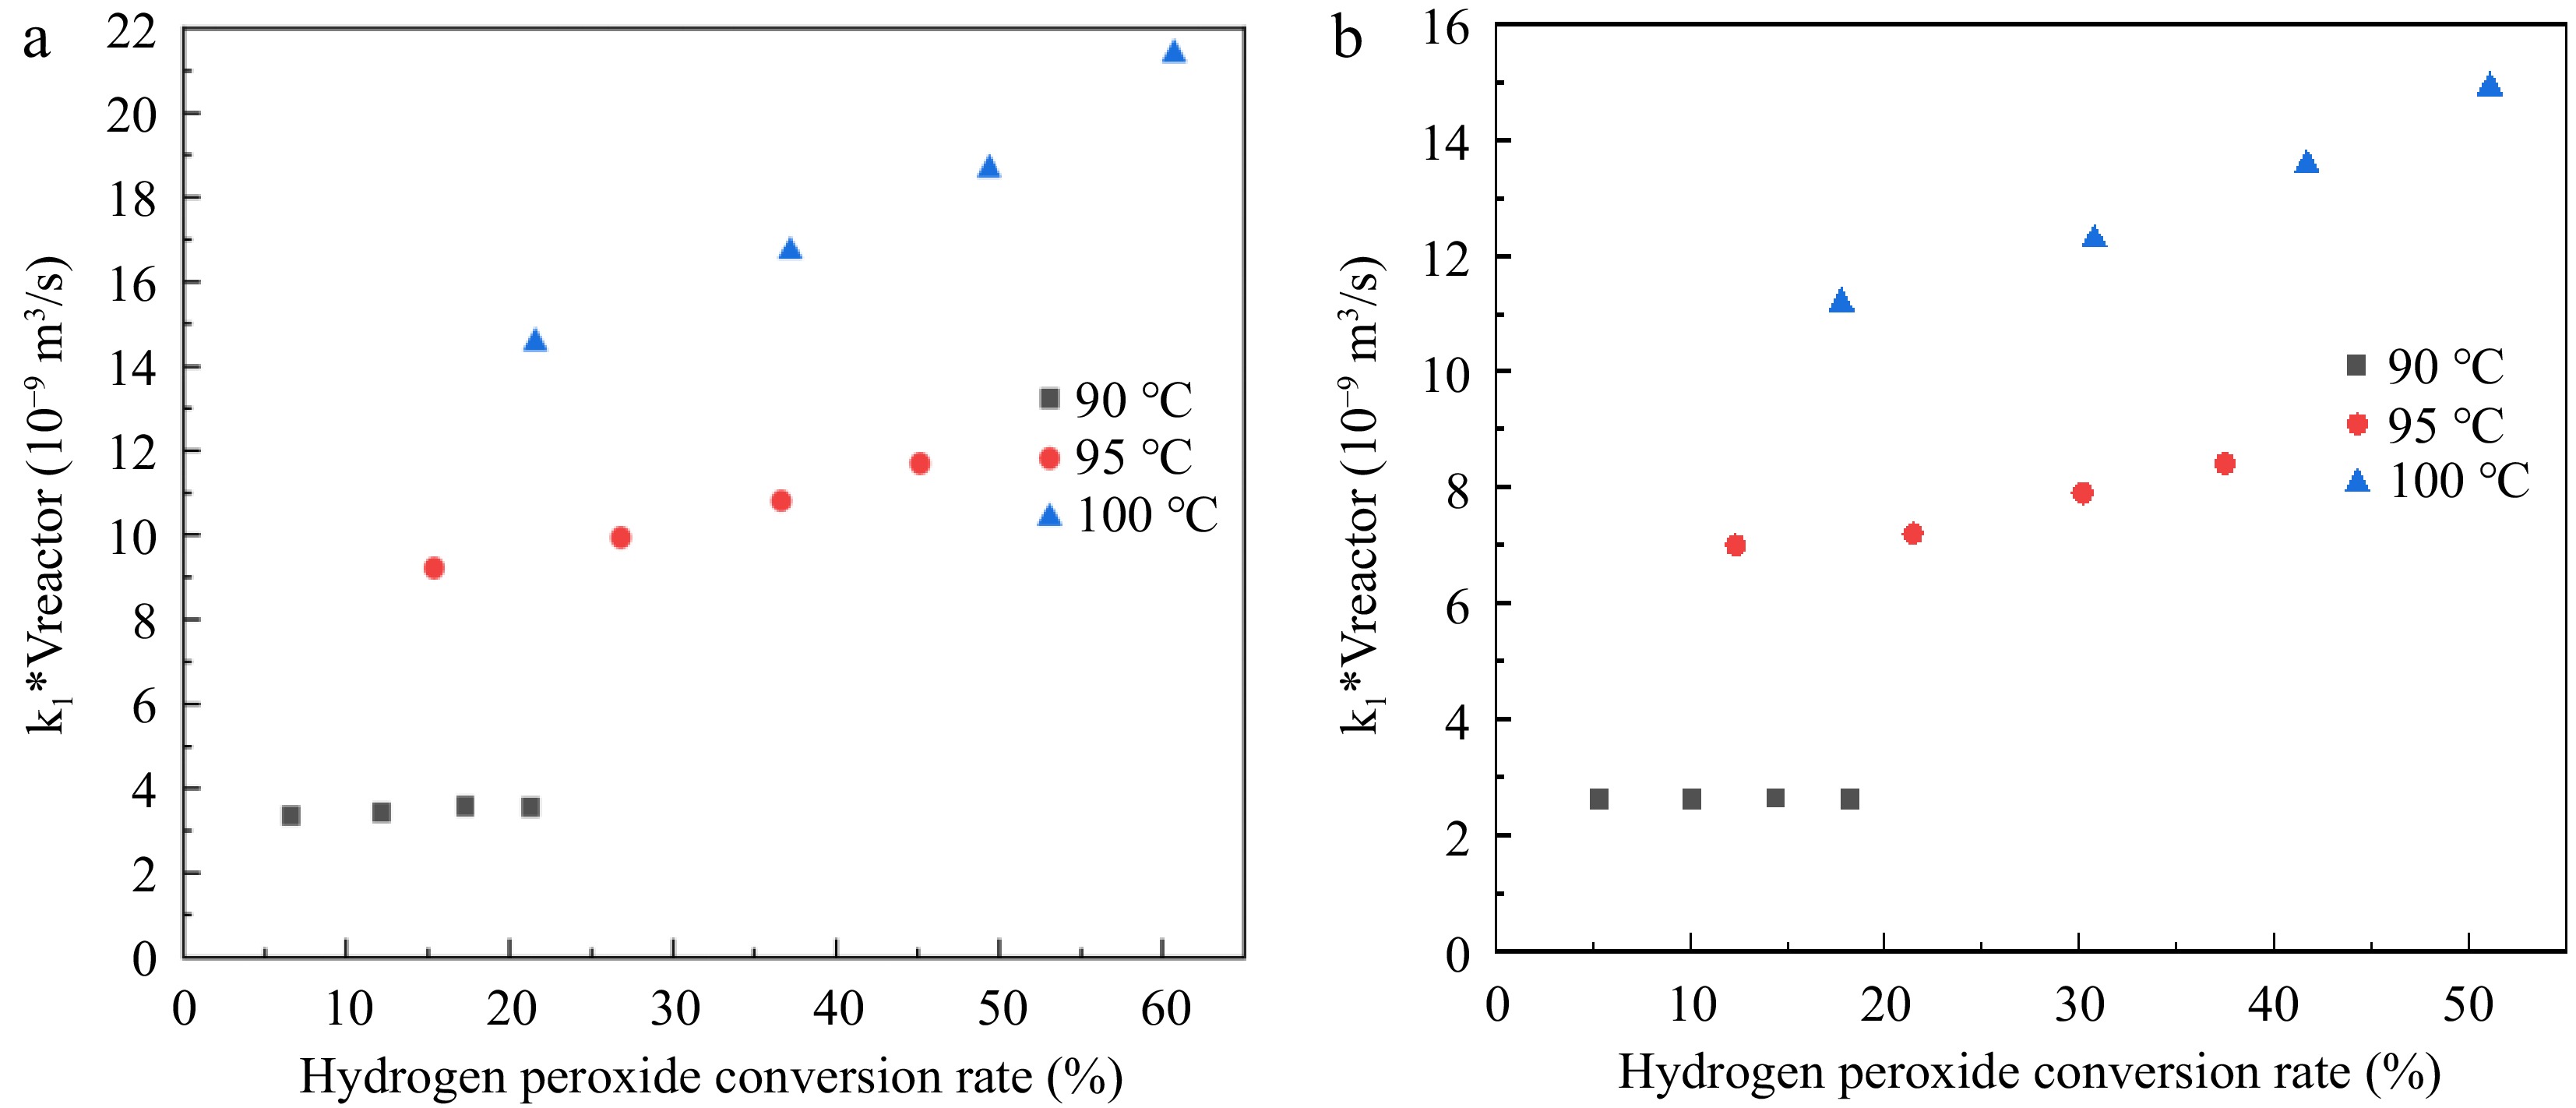
Figure 6.
Relationship between k1*Vreactor and H2O2 conversion rate. (a) Reaction condition 1; (b) Reaction condition 2.
-
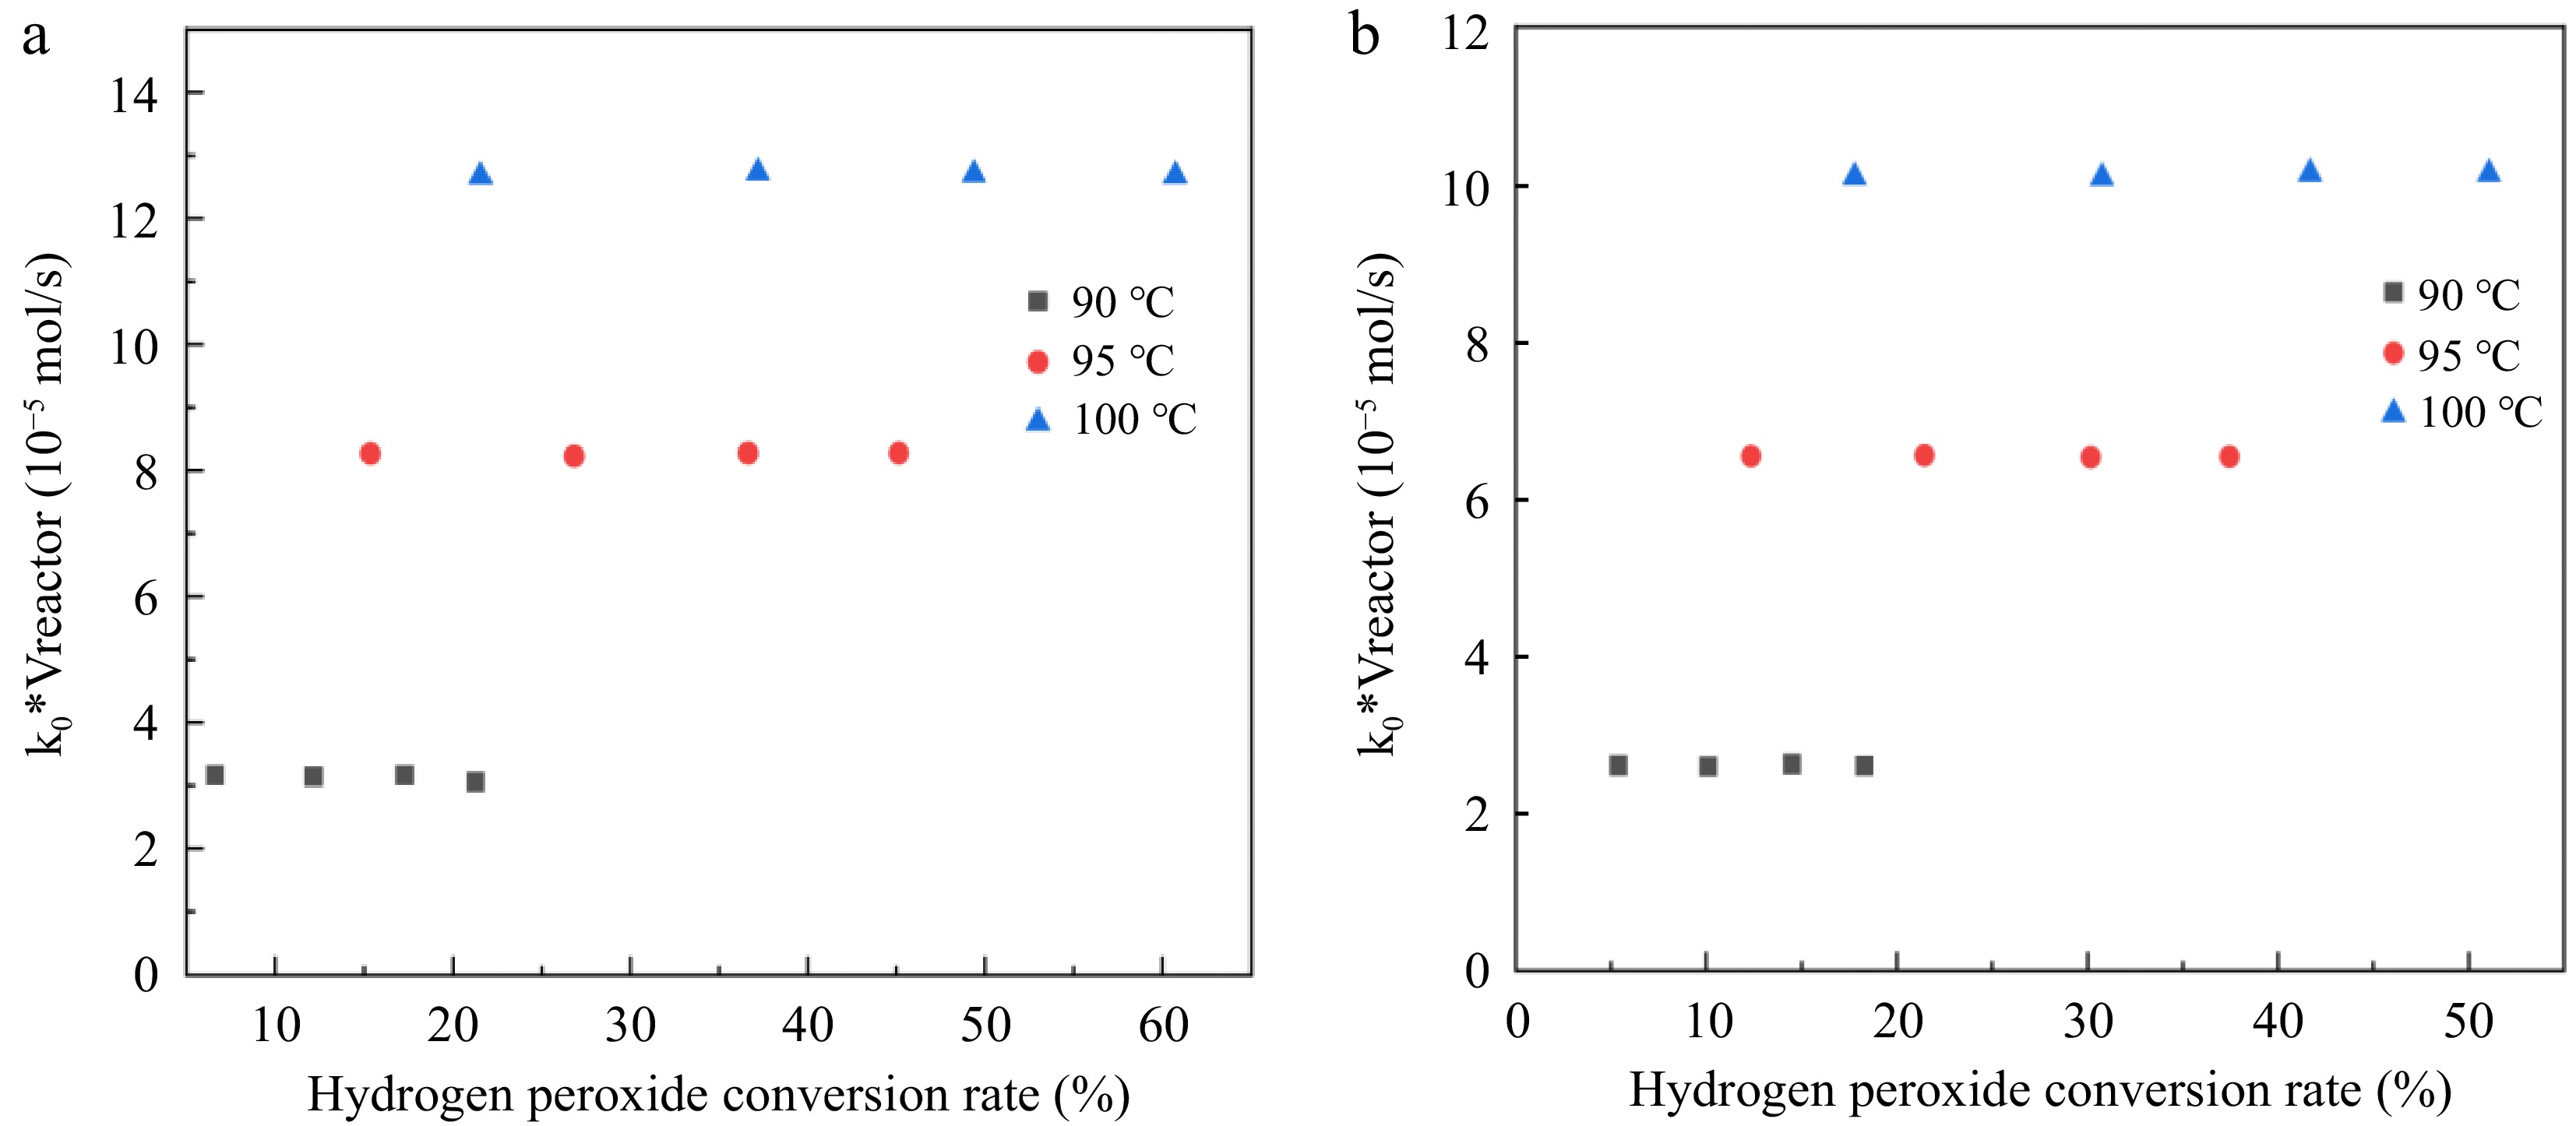
Figure 7.
Relationship between k0*Vreactor and hydrogen peroxide conversion rate. (a) Reaction condition 1; (b) Reaction condition 2.
-
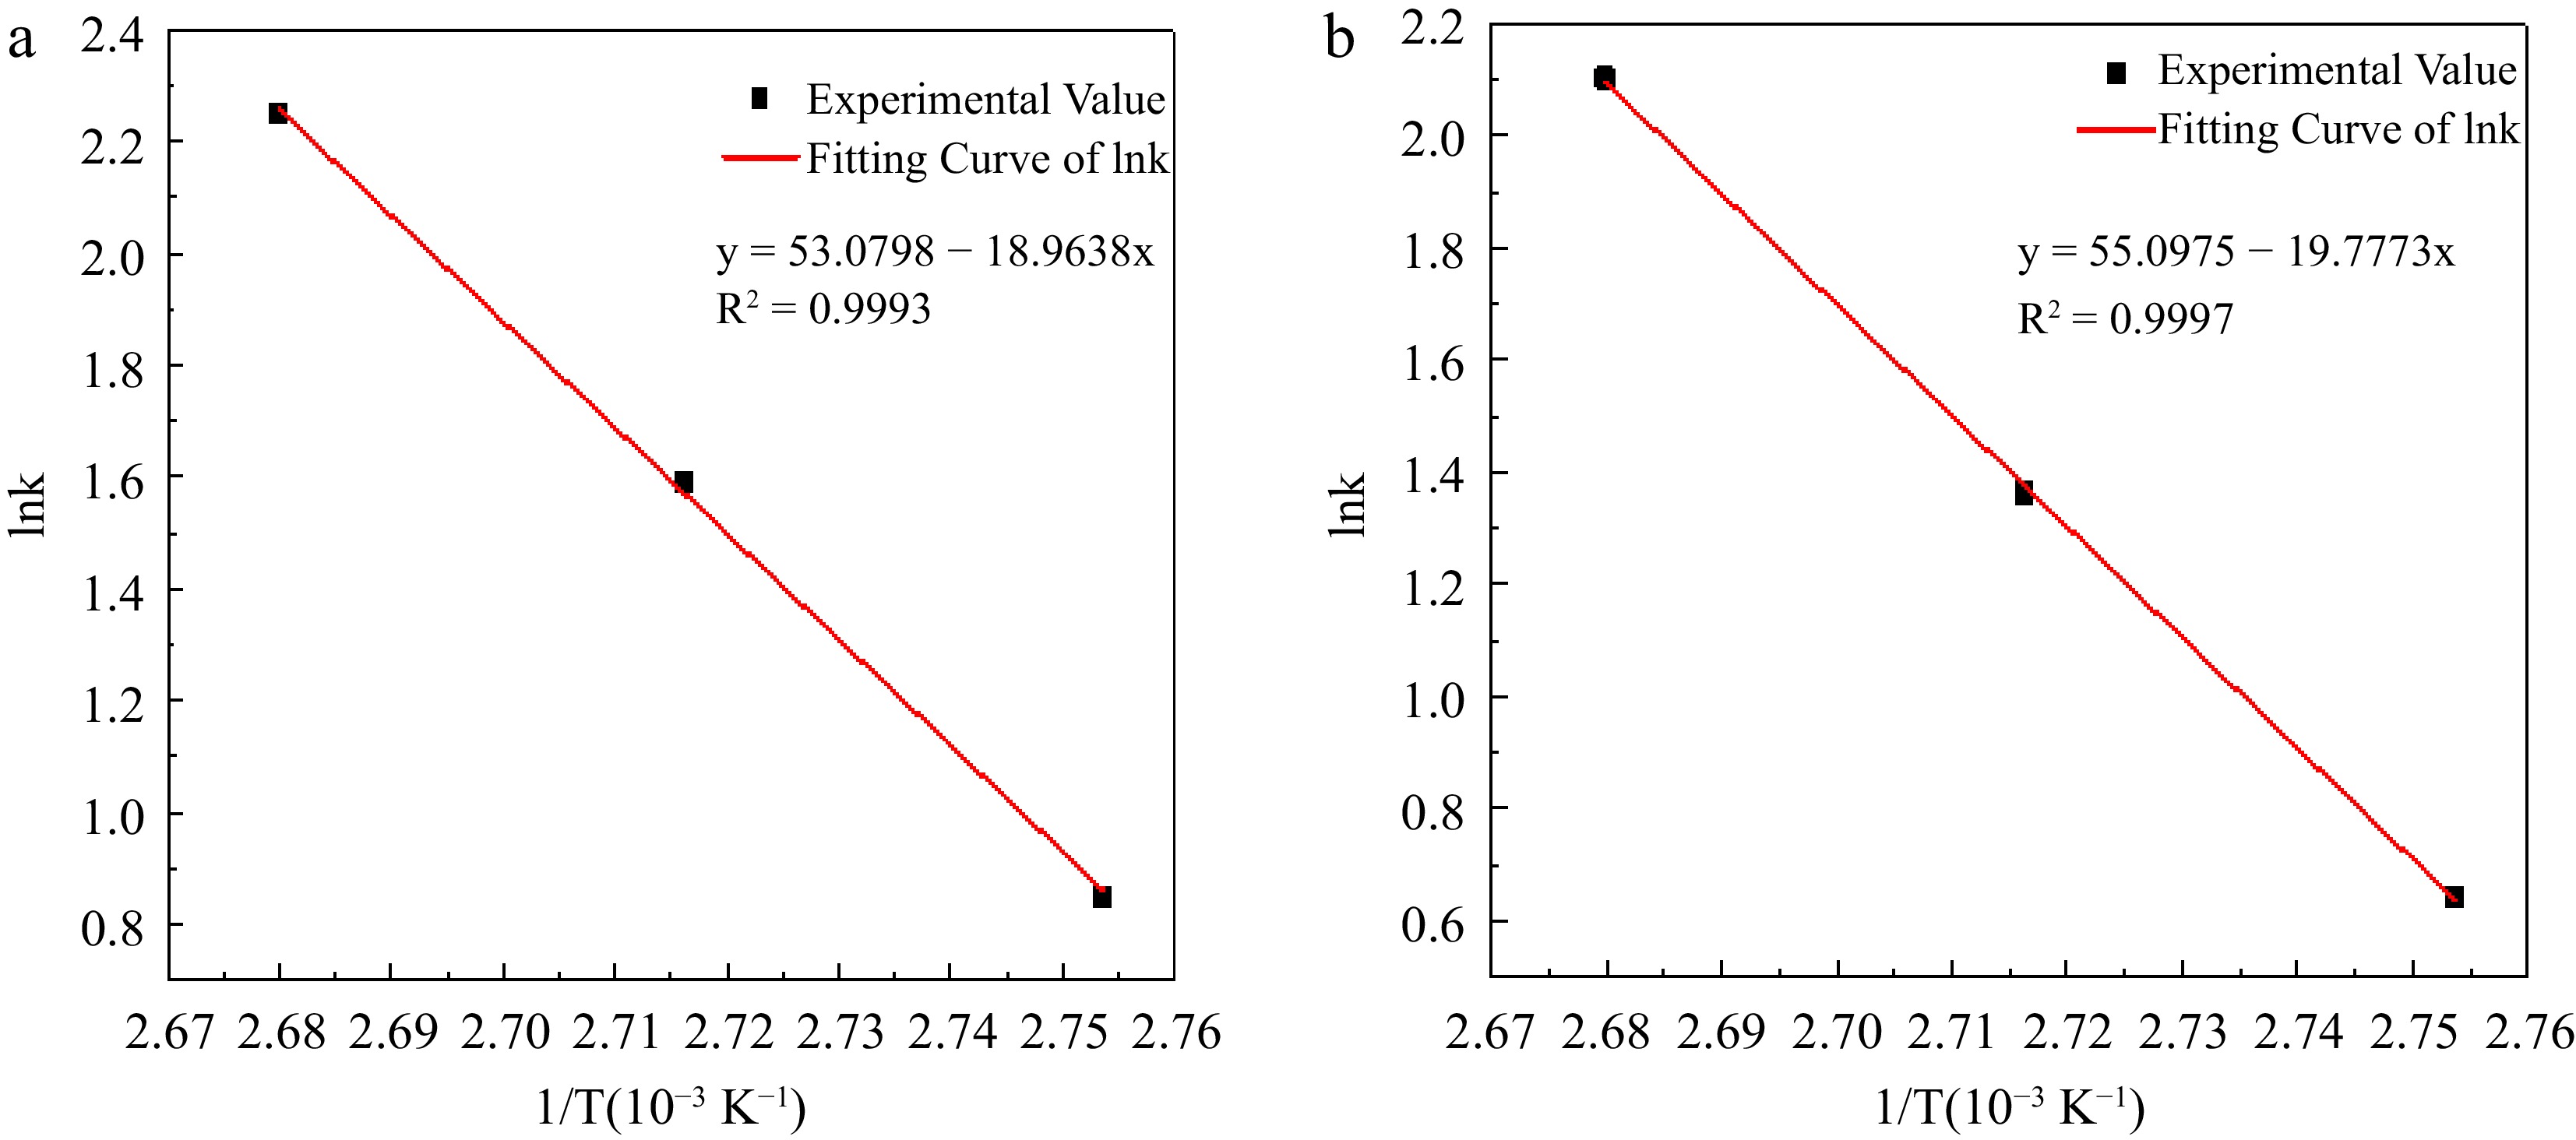
Figure 8.
Experimental value and fitting curve of lnk to 1/T in hydrogen peroxide decomposition. (a) Reaction condition 1; (b) Reaction condition 2.
-

Figure 9.
Schematic diagram of gas to liquid ratio in pipelines.
-
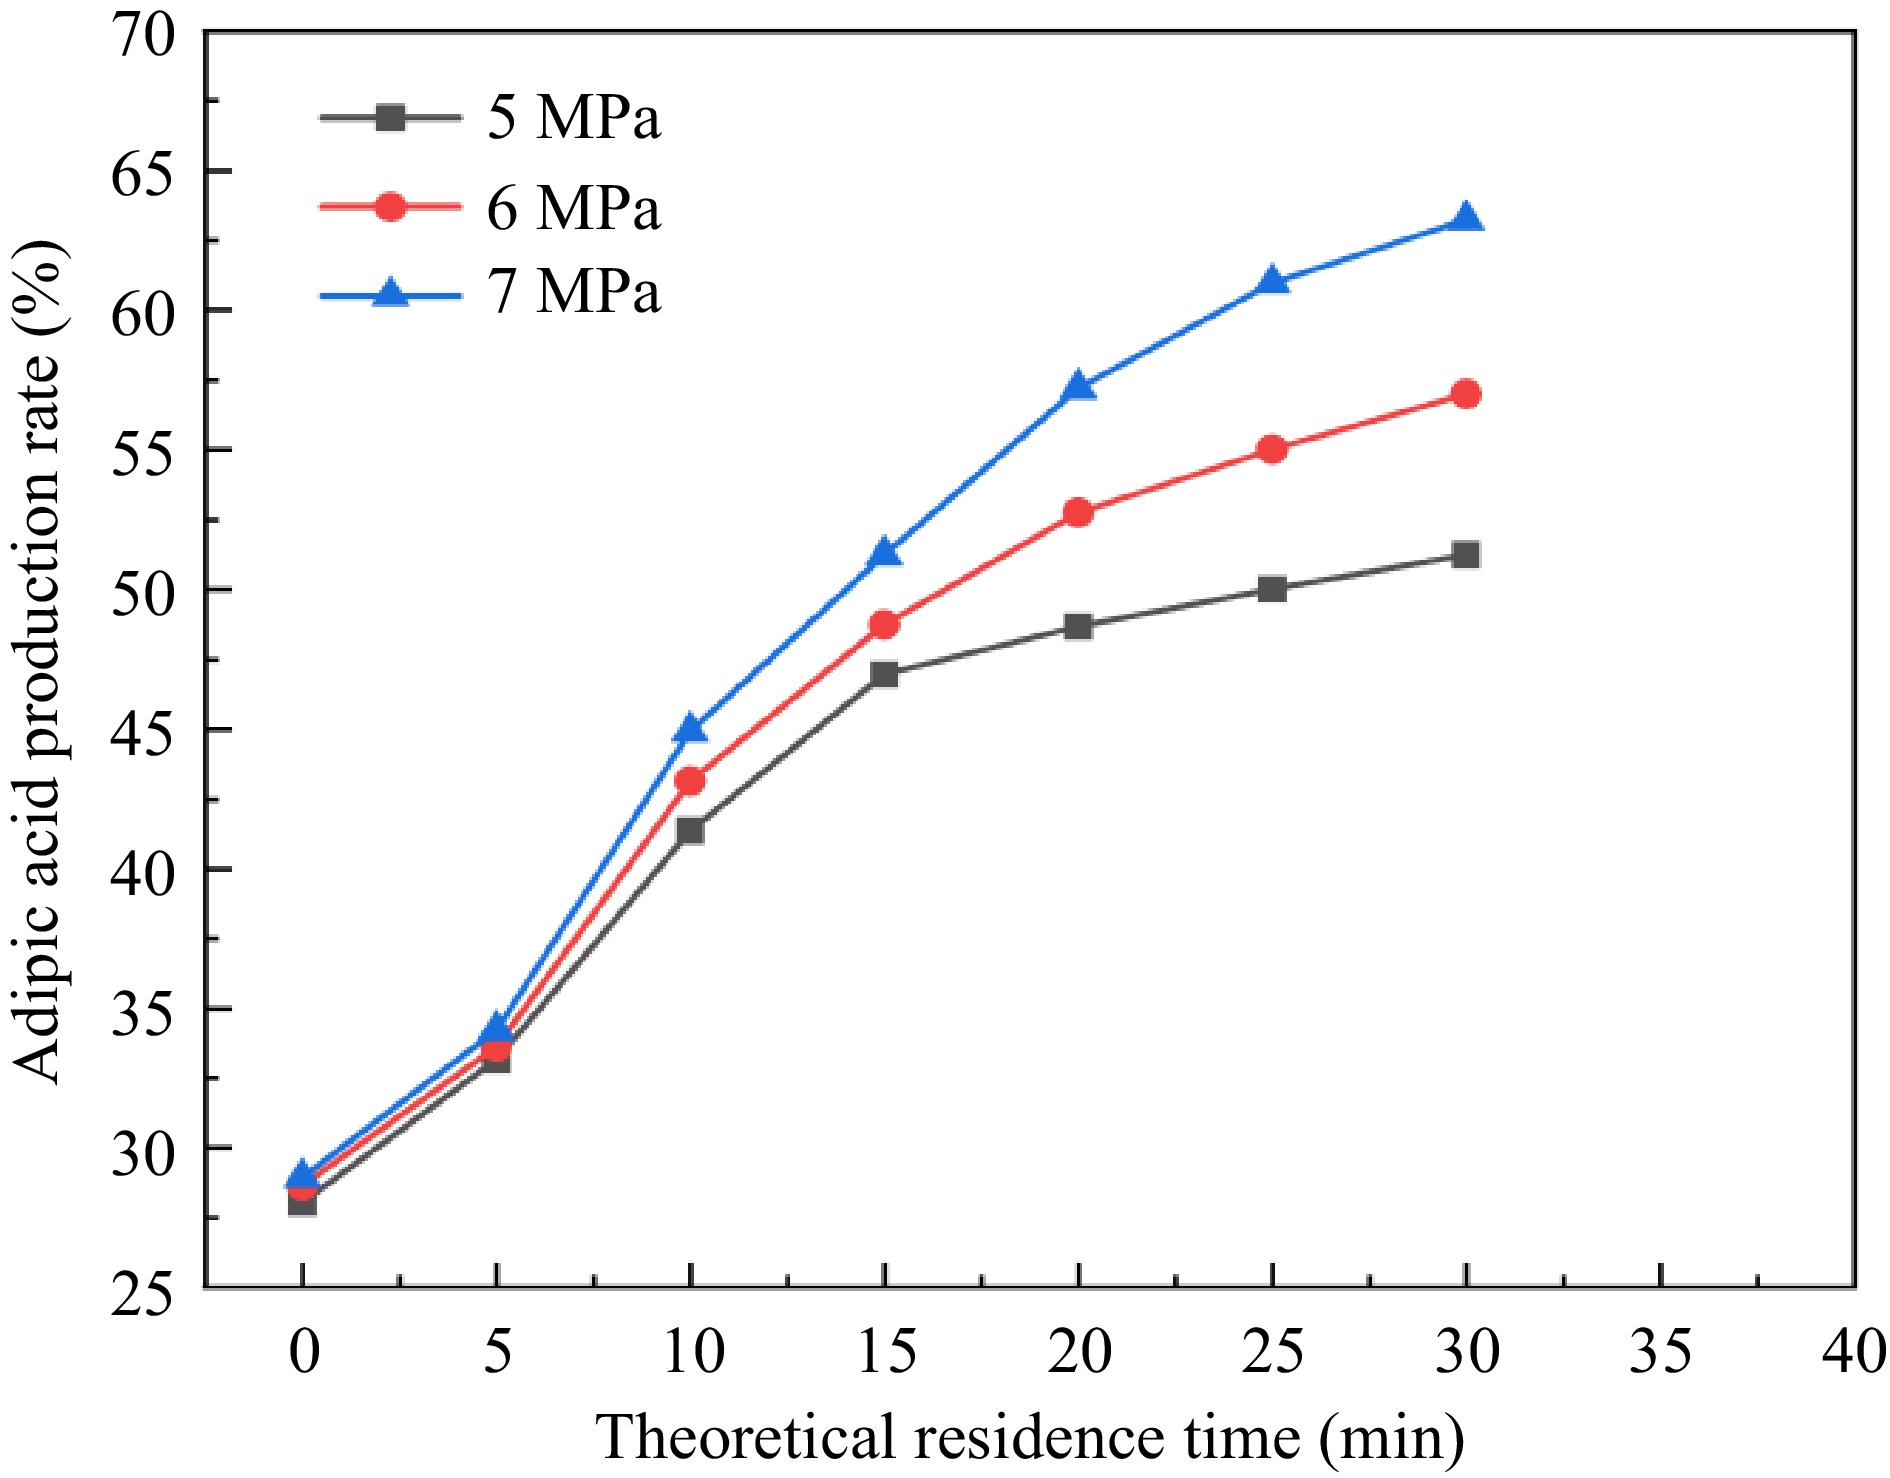
Figure 10.
Green synthesis yield of adipic acid under different pressures and residence times.
-
Material Molecular formula Fineness CAS No. Manufacturer H2O2 aqueous solution H2O2 30.0% 7722-84-1 Sinopharm Chemical Reagent Co., Ltd. Sodium tungstate Na2WO4 ≥ 99.5% 10213-10-2 Shanghai Macklin Biochemical Co., Ltd. Concentrated H2SO4 H2SO4 ≥ 98% 7664-93-9 Sinopharm Chemical Reagent Co., Ltd. EDTA C10H16N2O8 AR 60-00-4 TCI (Shanghai) Development Co., Ltd. Table 1.
Material information used in decomposition experiments.
-
Reaction condition n (H2O2) : n (Na2WO4) Molar concentration of H2SO4 (mol/L) Mass concentration of EDTA (g/L) 1 4.4:0.06 0.22 − 2 4.4:0.06 0.22 18.3 Table 2.
Information table of different reaction conditions.
-
Phase −ΔHr
(kJ)Cp
(J·K−1·g−1)ΔTad,r
(°C)MTSRr (°C)
(Adding EDTA)MTSRr (°C)
(No EDTA)A 103.21 3.8 37.23 104.76 209.77 B 504.77 4.1 168.74 268.81 345.61 Table 3.
Thermal parameters of adipic acid synthesis reaction in RC1e experiment.
-
Reaction temperature (°C) Reaction condition 2 calculated rate constant average k1 (10−3 s−1) Reaction condition 2 calculated rate constant average k1 (10−3 s−1) 90 0.2595 0.2082 95 0.7772 0.5695 100 1.3304 0.9690 Table 4.
Average values of reaction rate constants at different temperatures in a stainless steel capillary microreactor calculated based on the first order reaction assumption under different reaction conditions.
-
Reaction temperature (°C) Reaction condition 2 calculated rate constant average k0 (10−3 mol/(L·s) Reaction condition 3 calculated rate constant average k0 (10−3 mol/(L·s) 90 2.3380 1.9032 95 6.1659 4.7752 100 9.4732 7.38445 Table 5.
Average values of reaction rate constants at different temperatures in a stainless steel capillary microreactor calculated based on the zero order reaction assumption under different reaction conditions.
-
Reaction temperature (°C) k1(10−3 s−1) SD 95% confidence interval of k1 k0 (10−3 mol/L·s) SD 95% confidence interval for k0 90 0.2595 0.1045 0.2471−0.2719 2.3380 0.0493 2.2806−2.3953 95 0.7772 1.0754 0.6495−0.9049 6.1659 0.0225 6.1397−6.1920 100 1.3304 2.9035 0.9856−1.6752 9.4732 0.0271 9.4417−9.5048 Table 6.
Comparison of the calculated reaction rate constant k, standard deviation (SD), and confidence interval of the calculated reaction rate constant k based on the assumption of first and zero order reactions in a stainless steel capillary microreactor under reaction condition 2.
-
Reaction temperature (°C) k1 (10−3 s−1) SD 95% confidence interval of k1 k0 (10−3 mol/L·s) SD 95% confidence interval for k0 90 0.2082 0.0719 0.1967−0.2196 1.9032 0.0098 1.8875−1.9188 95 0.5695 0.4871 0.4920−0.6470 1.9032 0.0068 4.7644−4.7861 100 0.9690 0.1201 0.7778−1.1601 4.7752 0.0205 7.3518−7.4171 Table 7.
Comparison of the calculated reaction rate constant k, standard deviation (SD), and confidence interval of the calculated reaction rate constant k based on the assumption of first and zero order reactions in a stainless steel capillary microreactor under reaction condition 3.
Figures
(10)
Tables
(7)