-
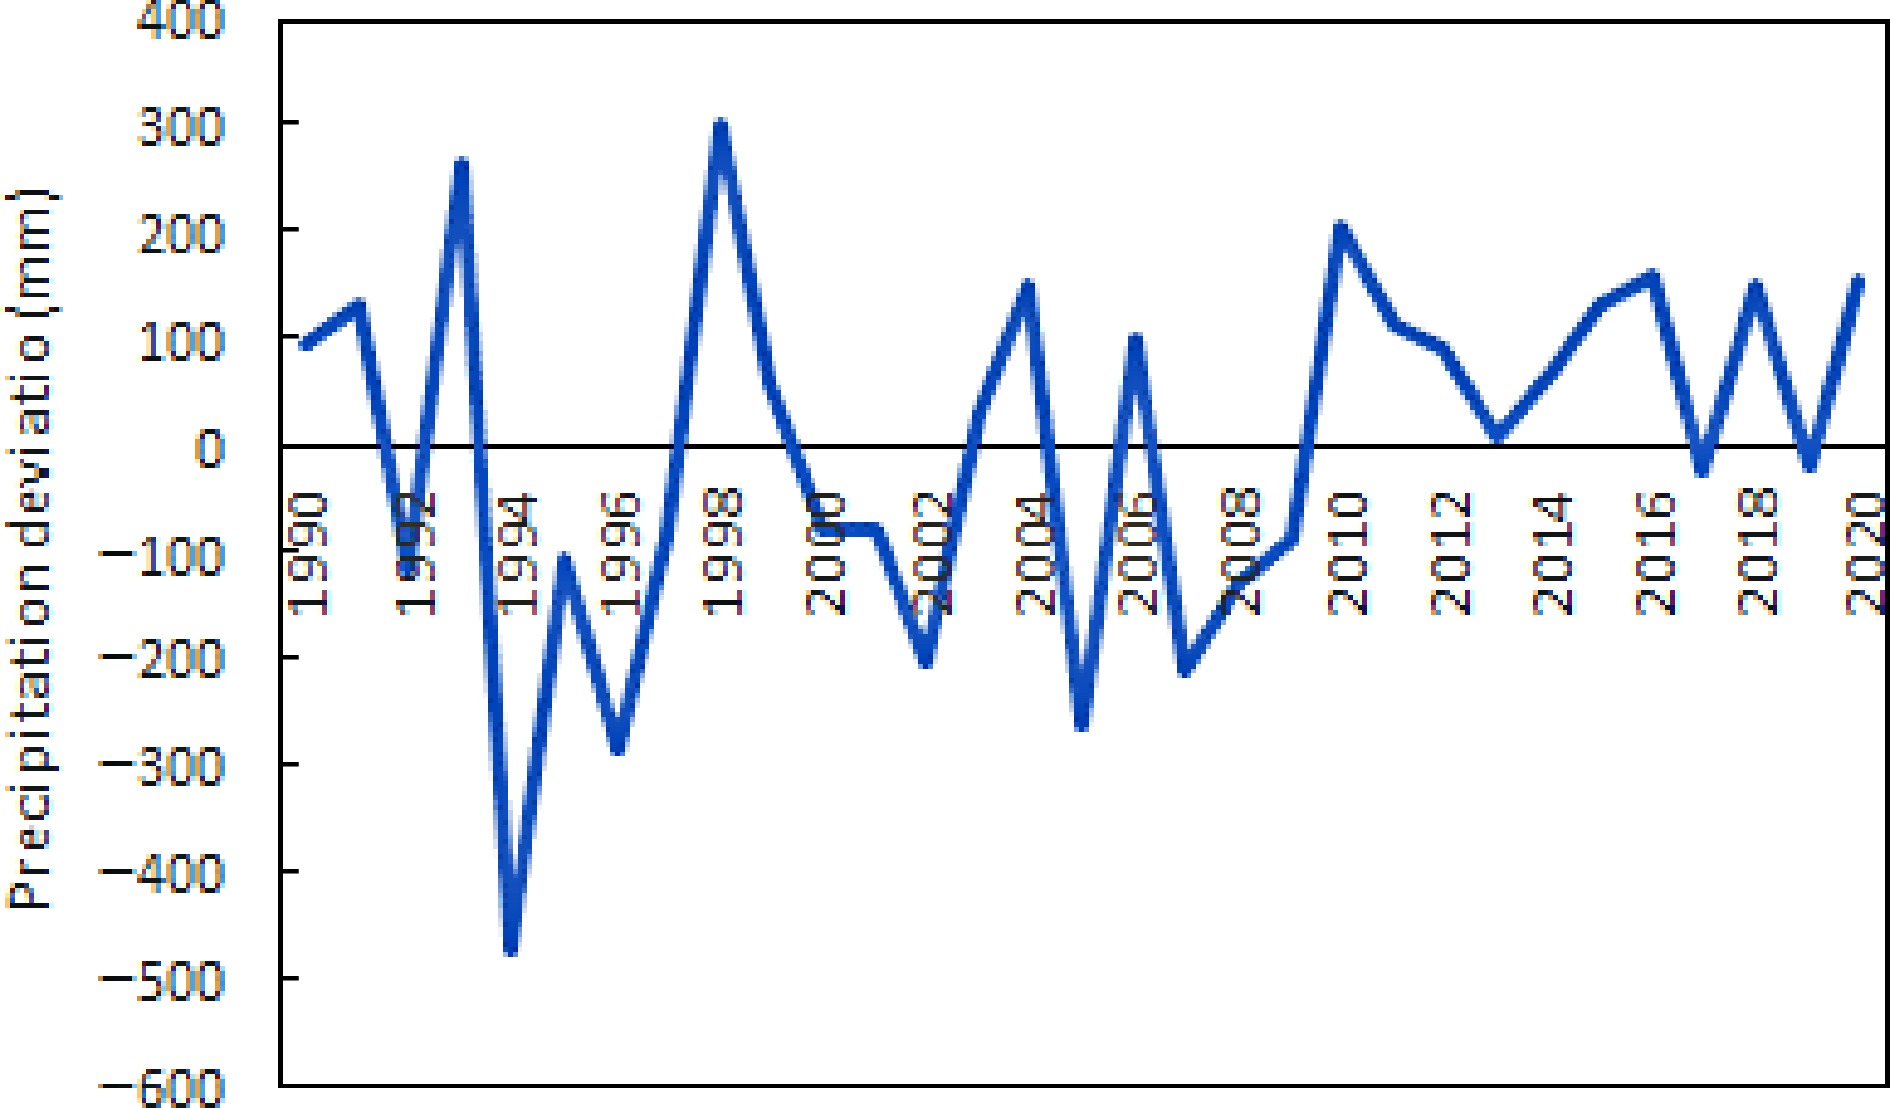
Figure 1.
Deviation of annual precipitation from the mean value of 1991−2020 (Source: Japan Meteorological Agency).
-
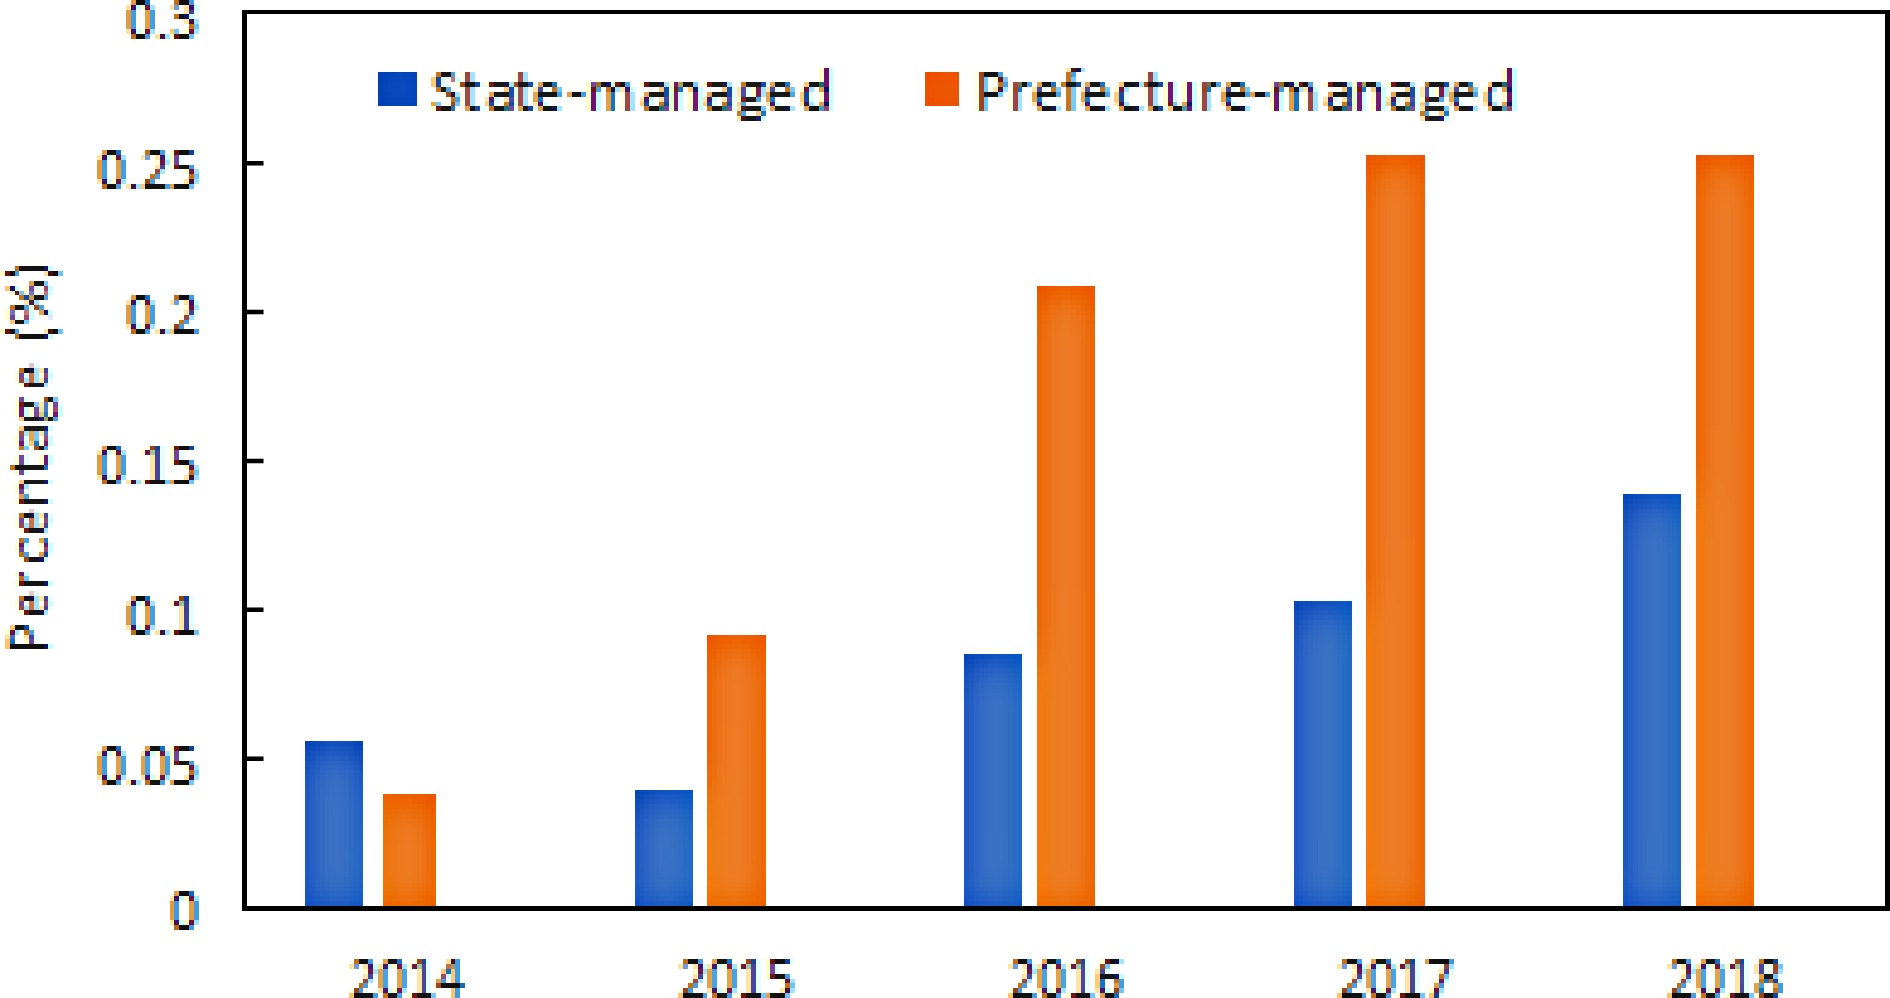
Figure 2.
Change in percentage of state-managed rivers having water levels higher than flood danger water levels (Source: MLIT).
-
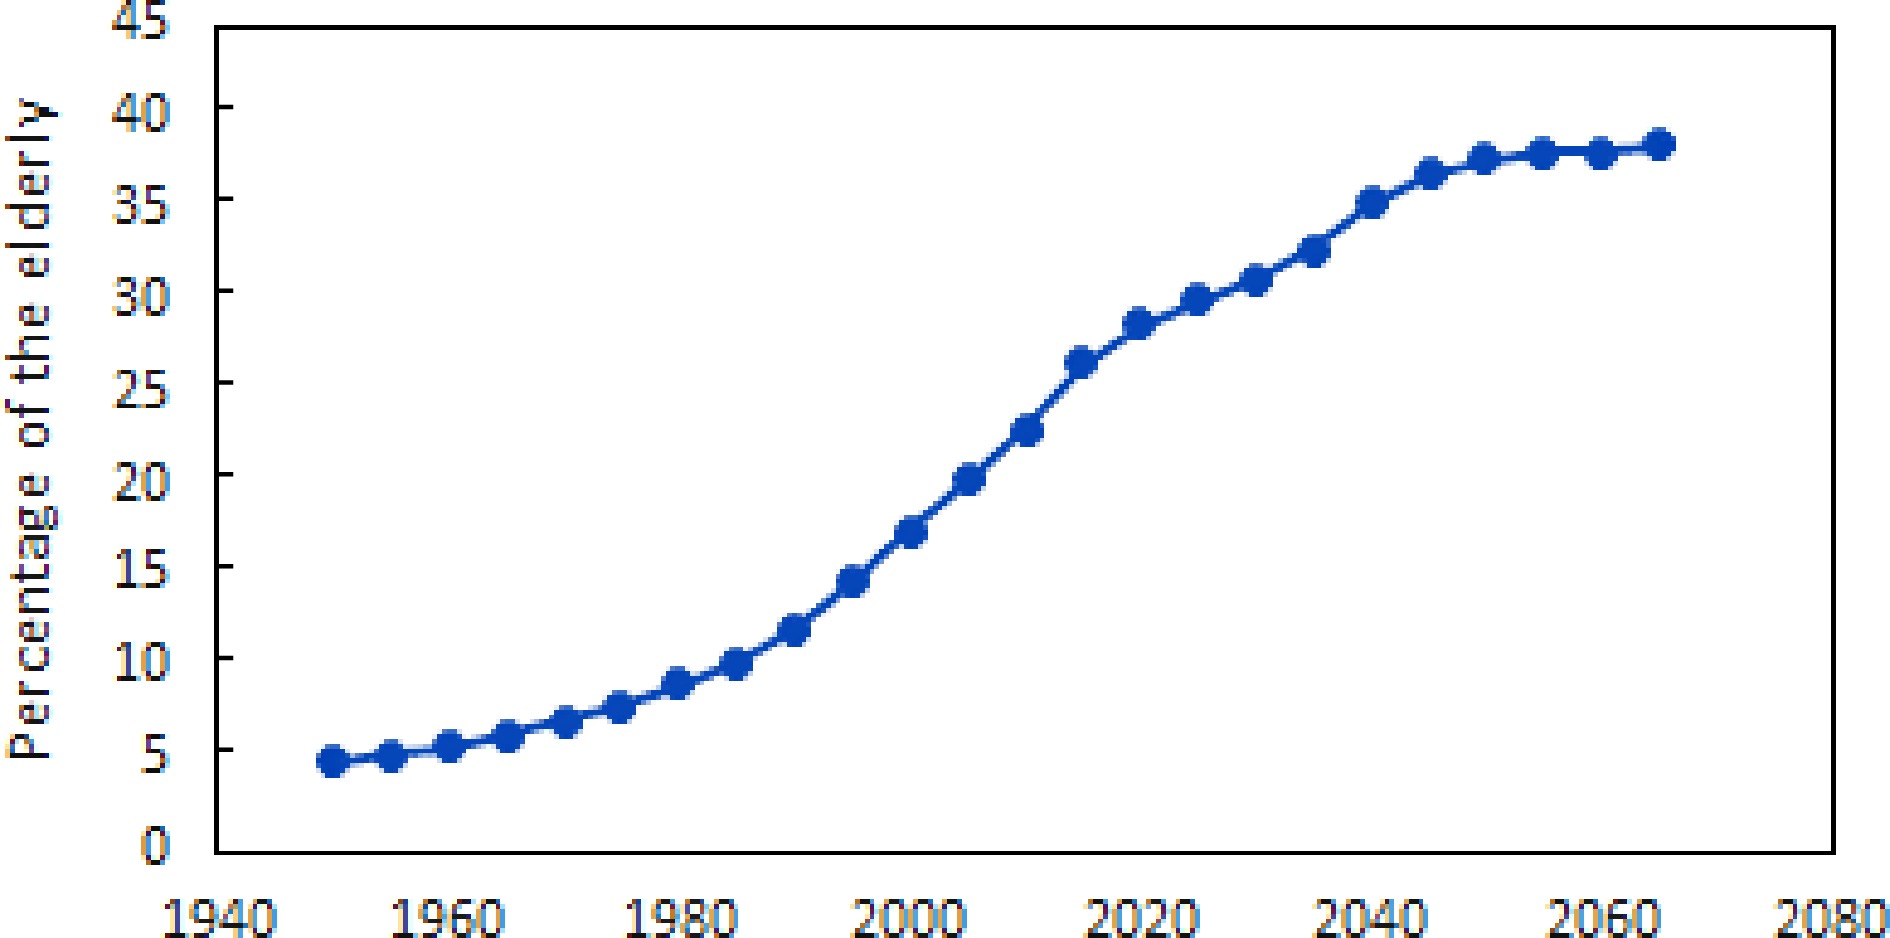
Figure 3.
Change in percentage of people above 65 in Japan.
-
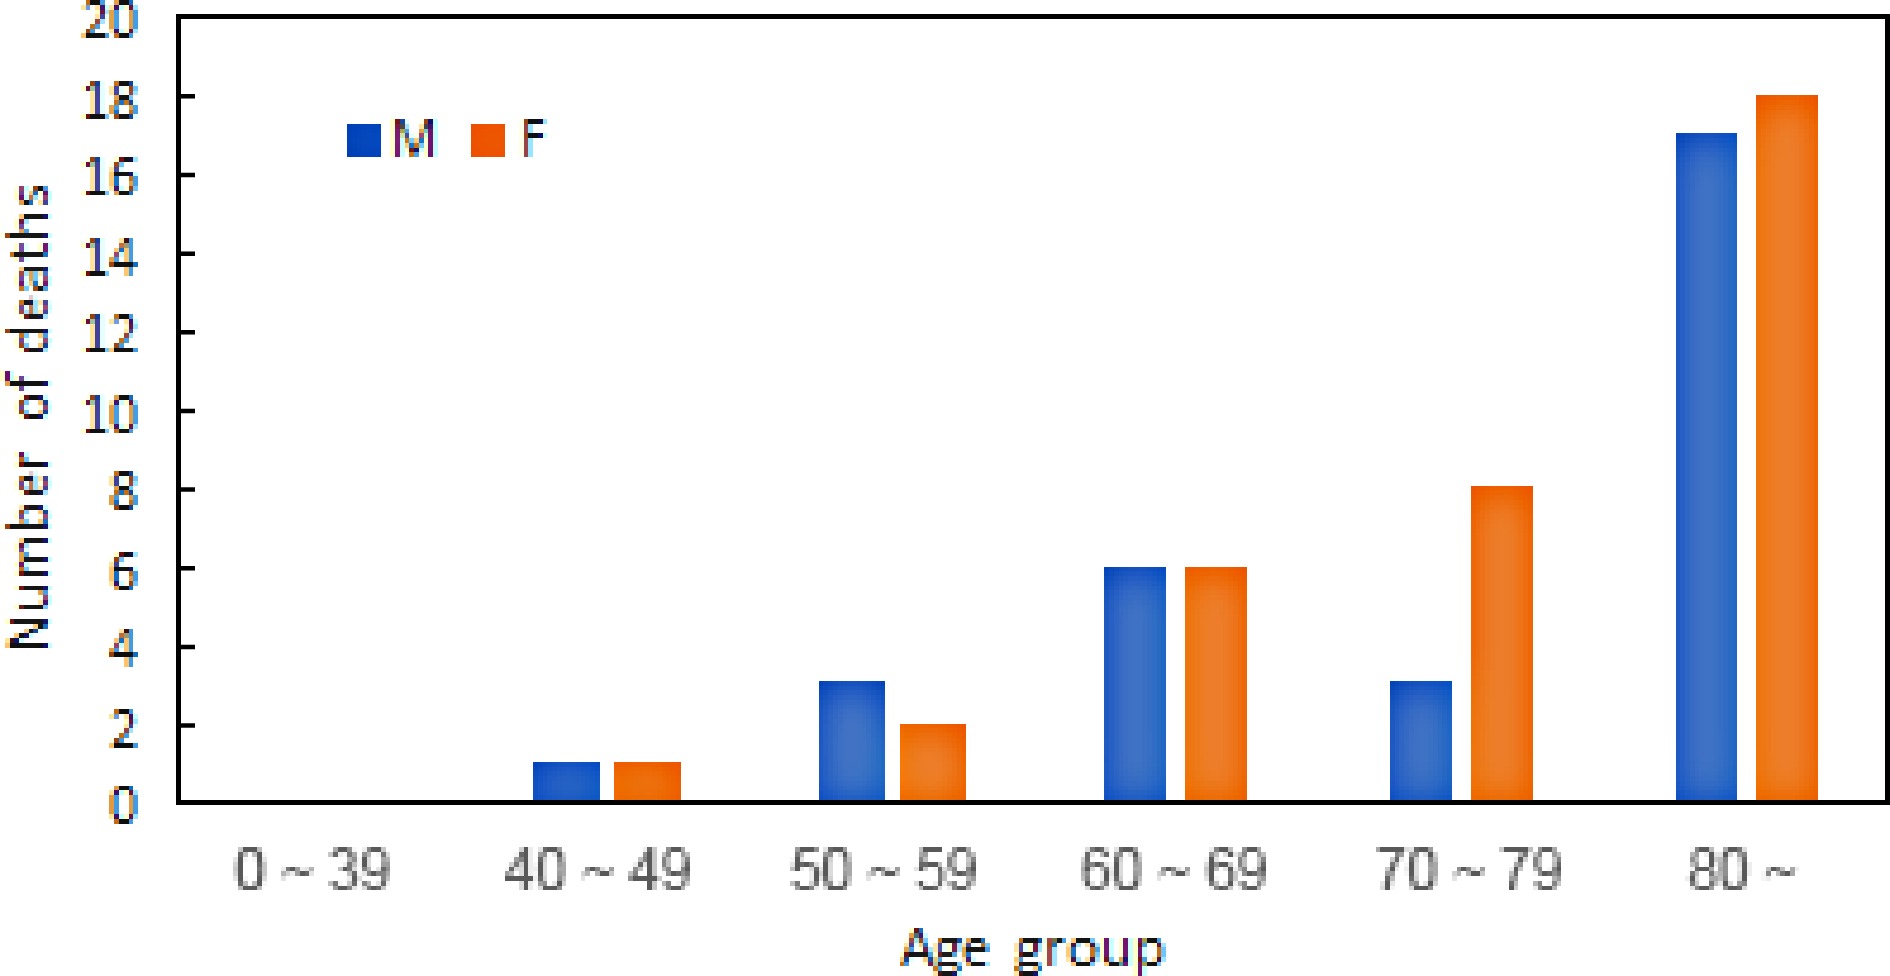
Figure 4.
Death toll in different age groups in the Kuma River flooding (Data source: e-Stat, Japan).
-
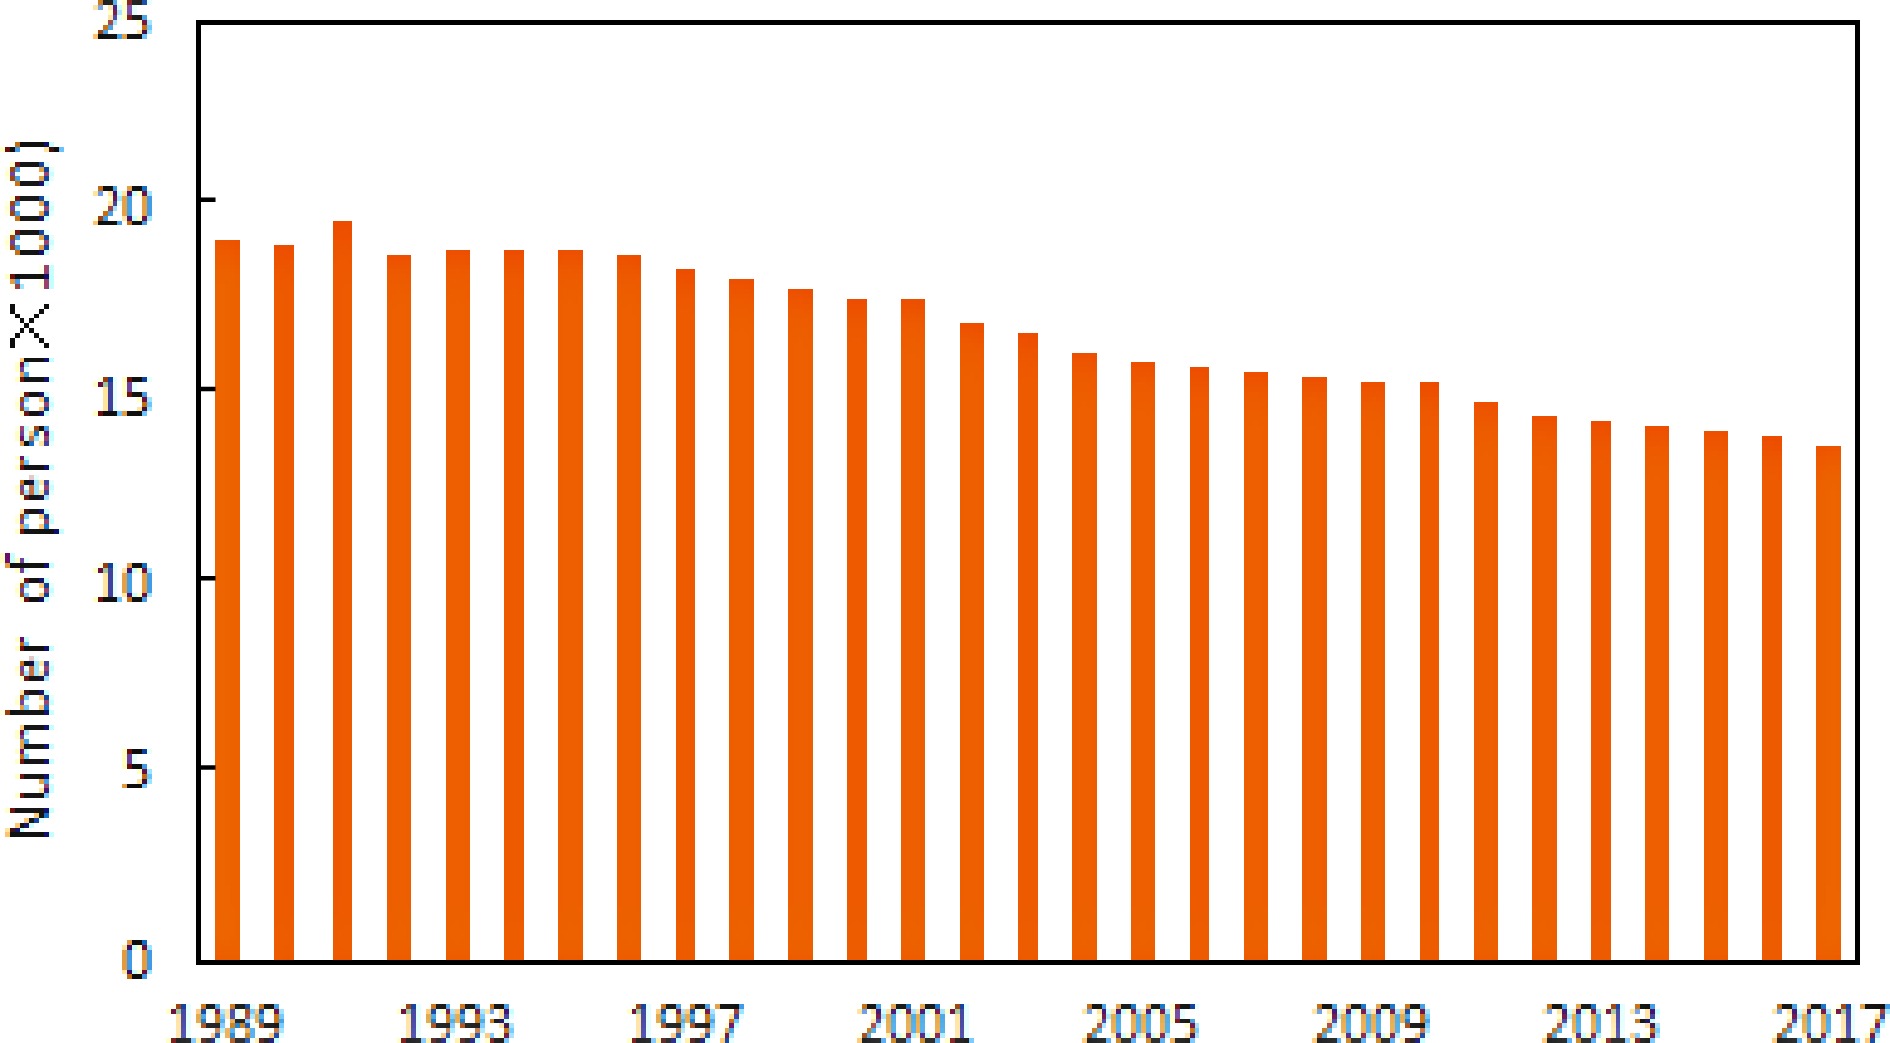
Figure 5.
Decline in the number of flood control personnel (Source: MLIT).
-
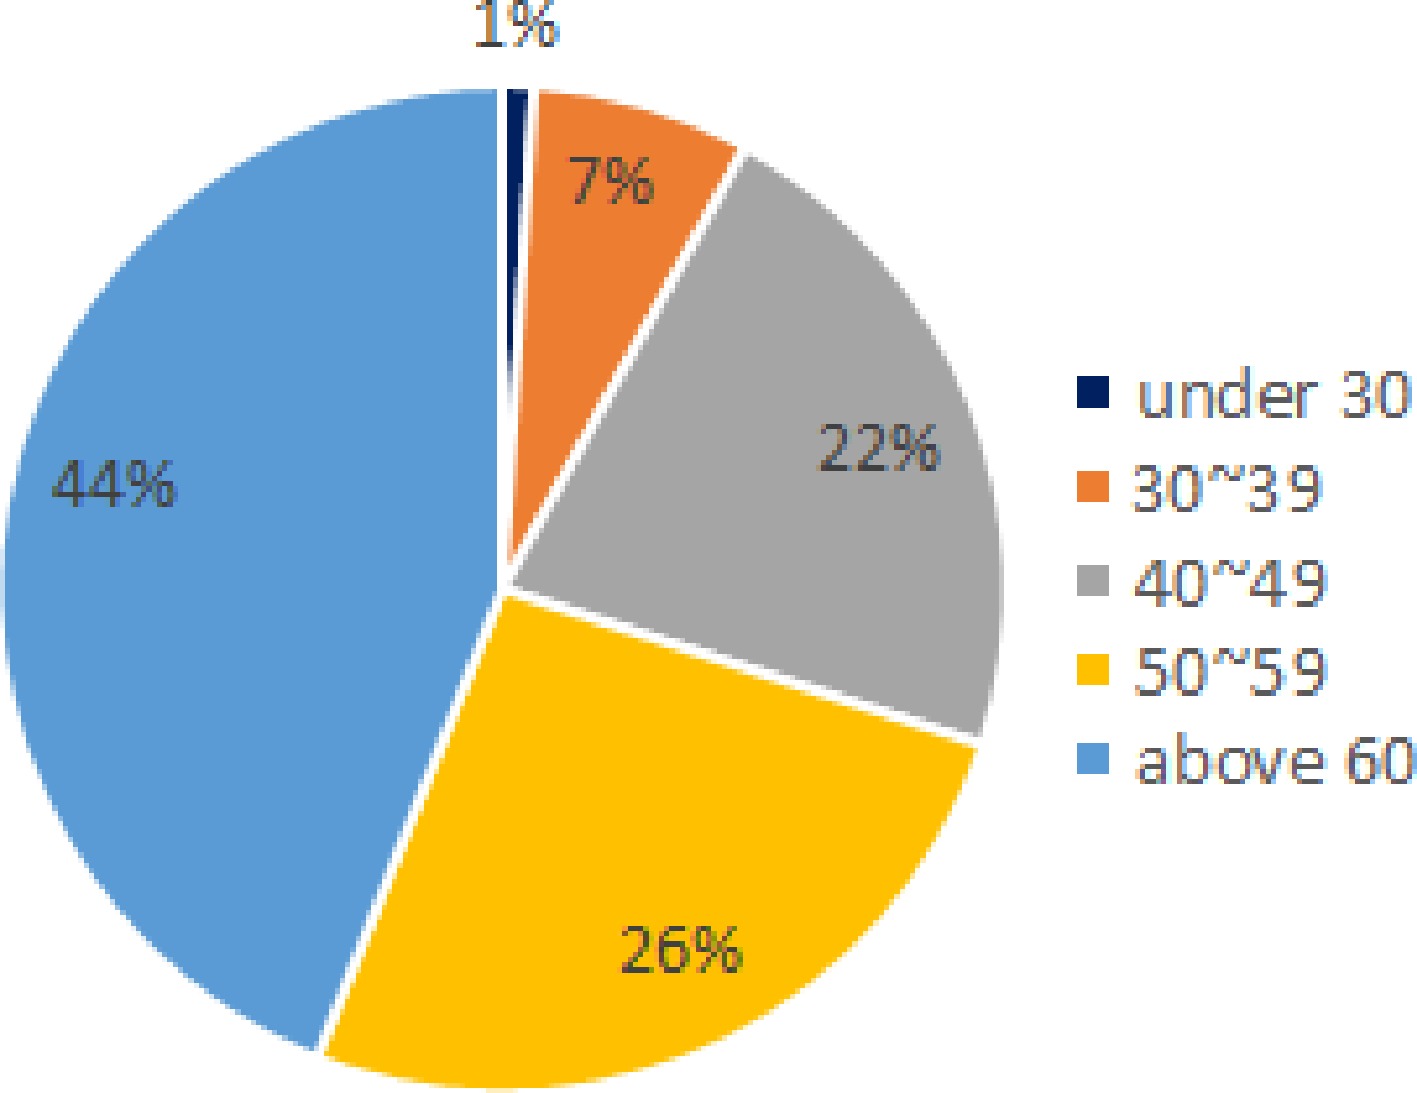
Figure 6.
Age distribution of flood control personnel (Source: MLIT).
-
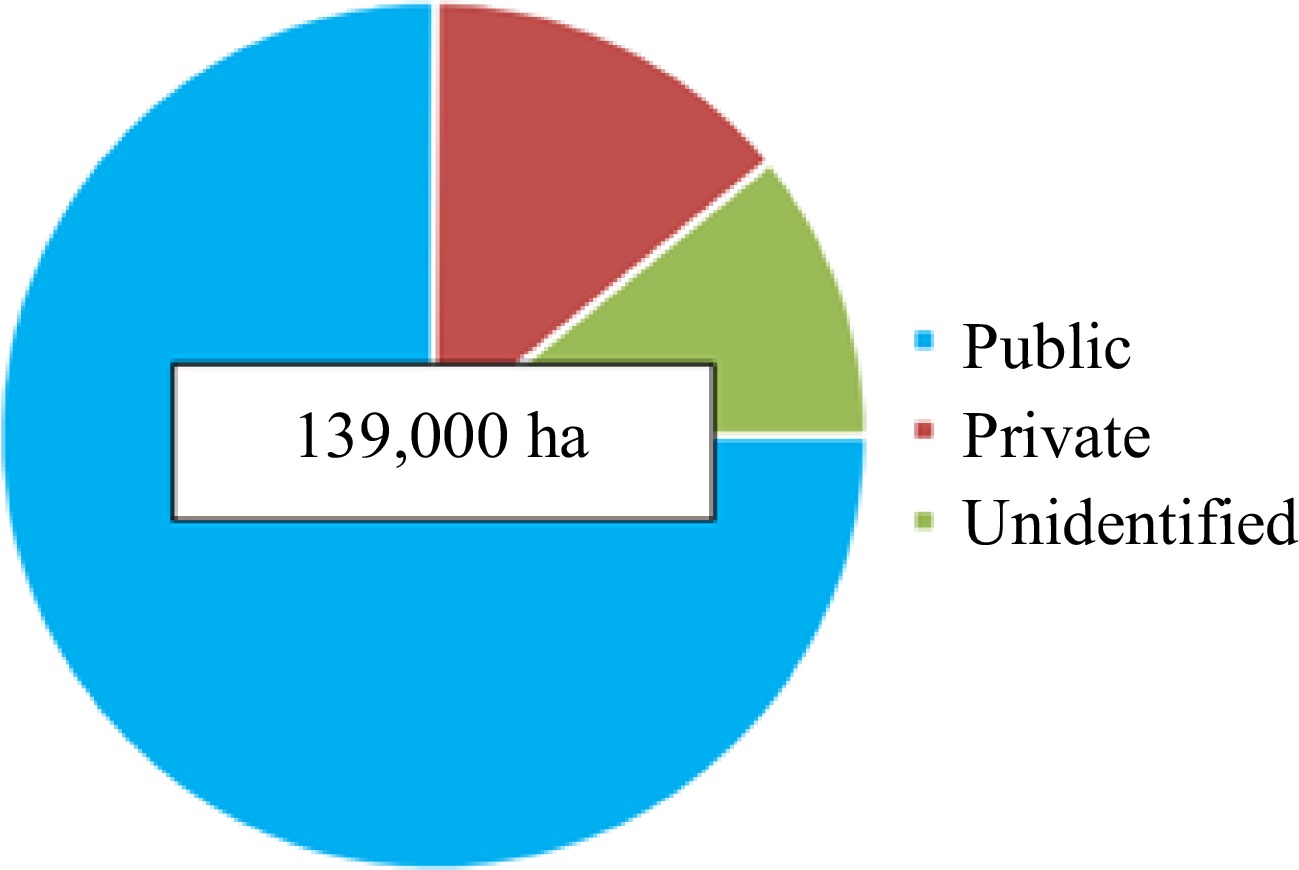
Figure 7.
Ownership of first-class river floodplains (Source: MLIT).
-
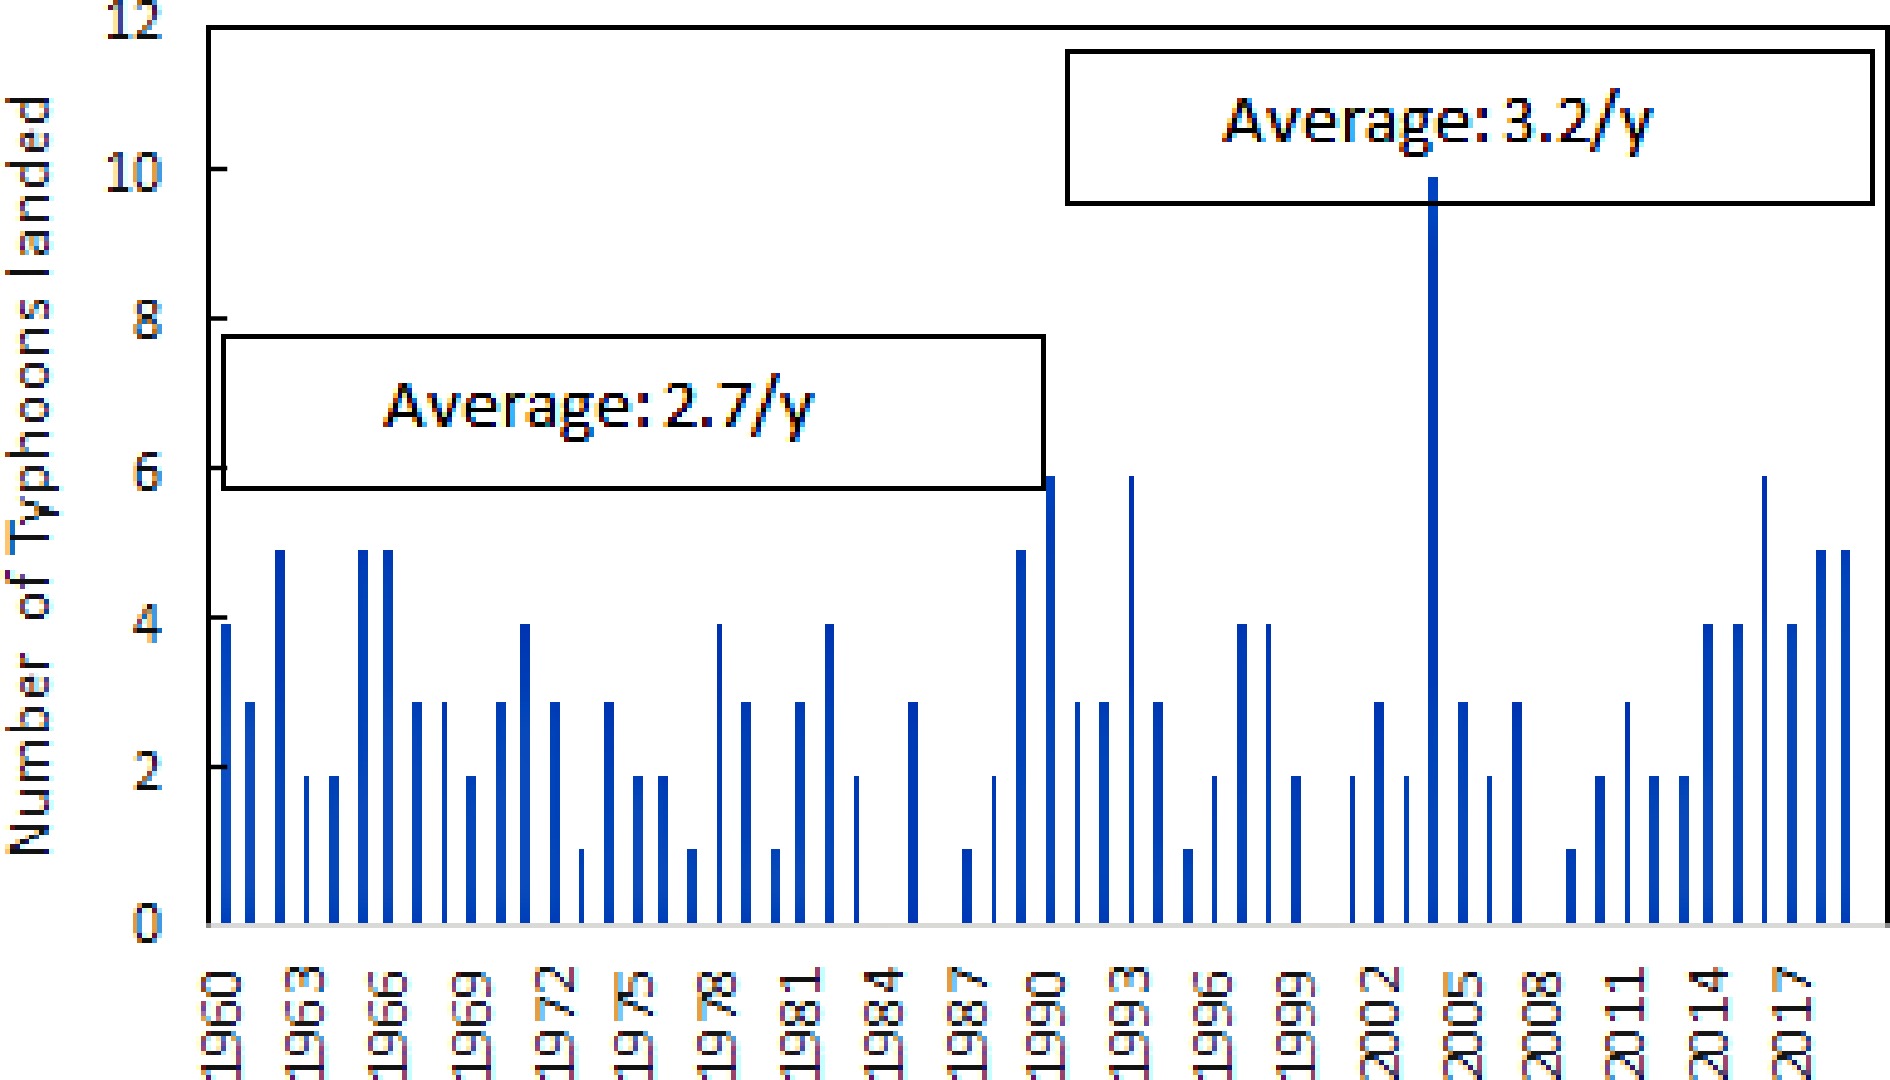
Figure 8.
Number of typhoons landed from 1960 to 2019 (Source: Japan Meteorological Agency).
-

Figure 9.
Number of flood-caused death and injured from 2000 to 2019 (Source: MLIT).
-
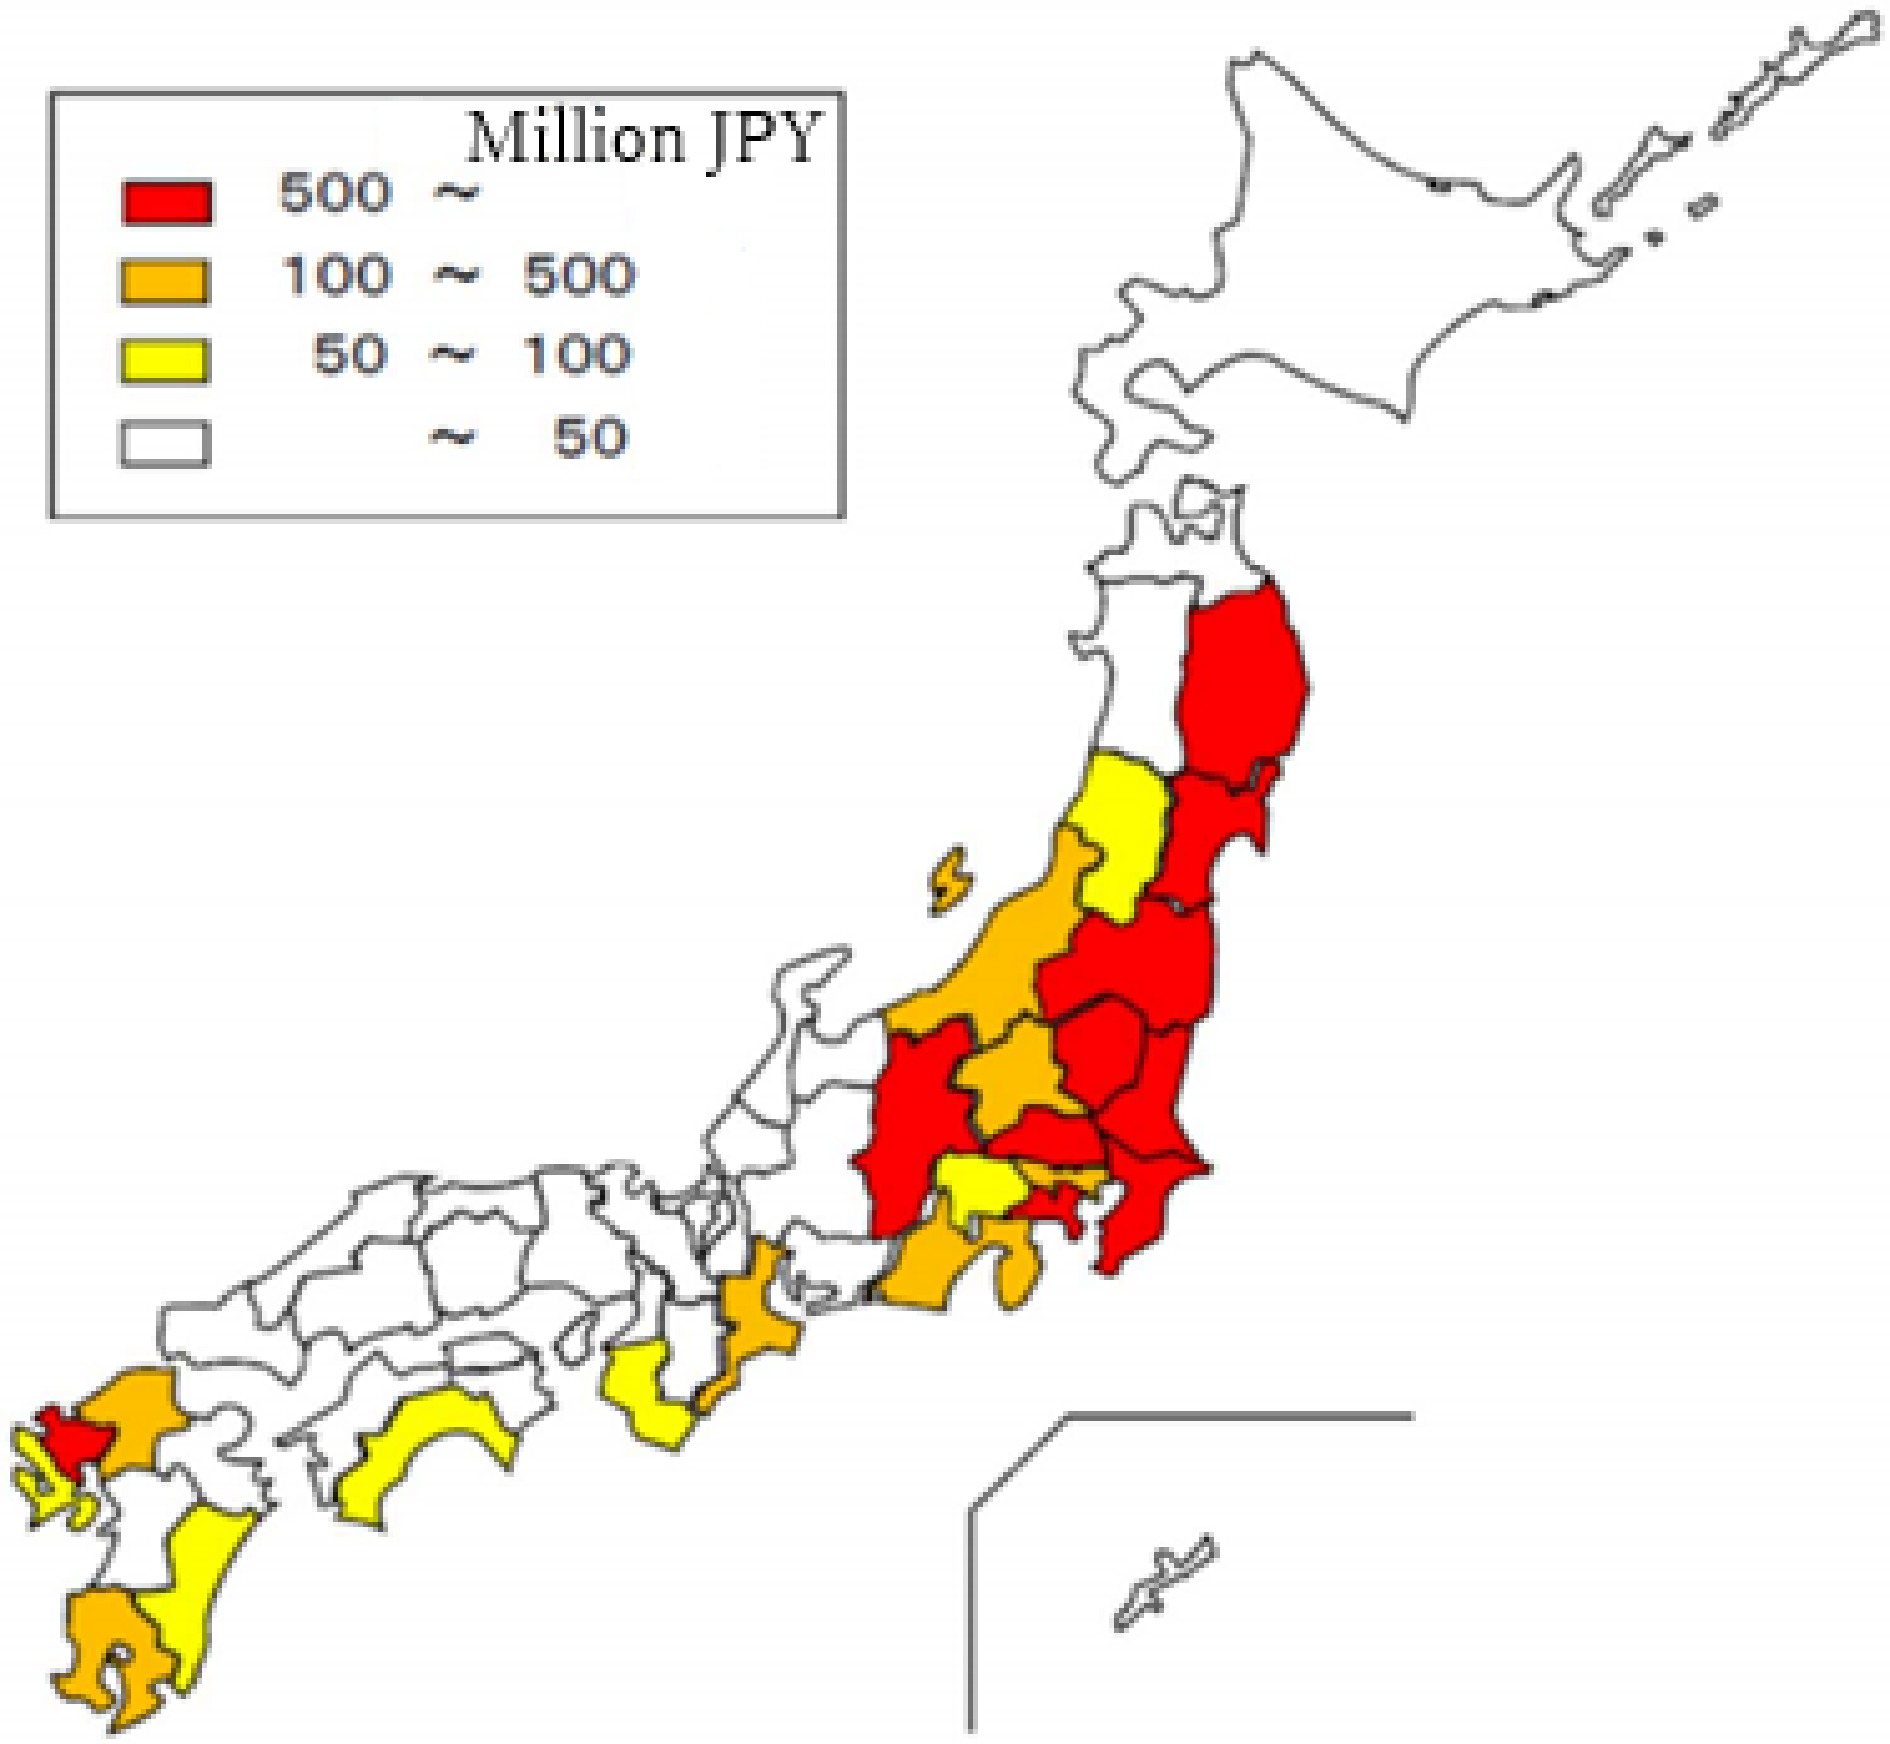
Figure 10.
Flood-caused economic loss by region in 2019 (Source: MLIT).
-

Figure 11.
Water resistant architecture in flood damage prevention zones.
-
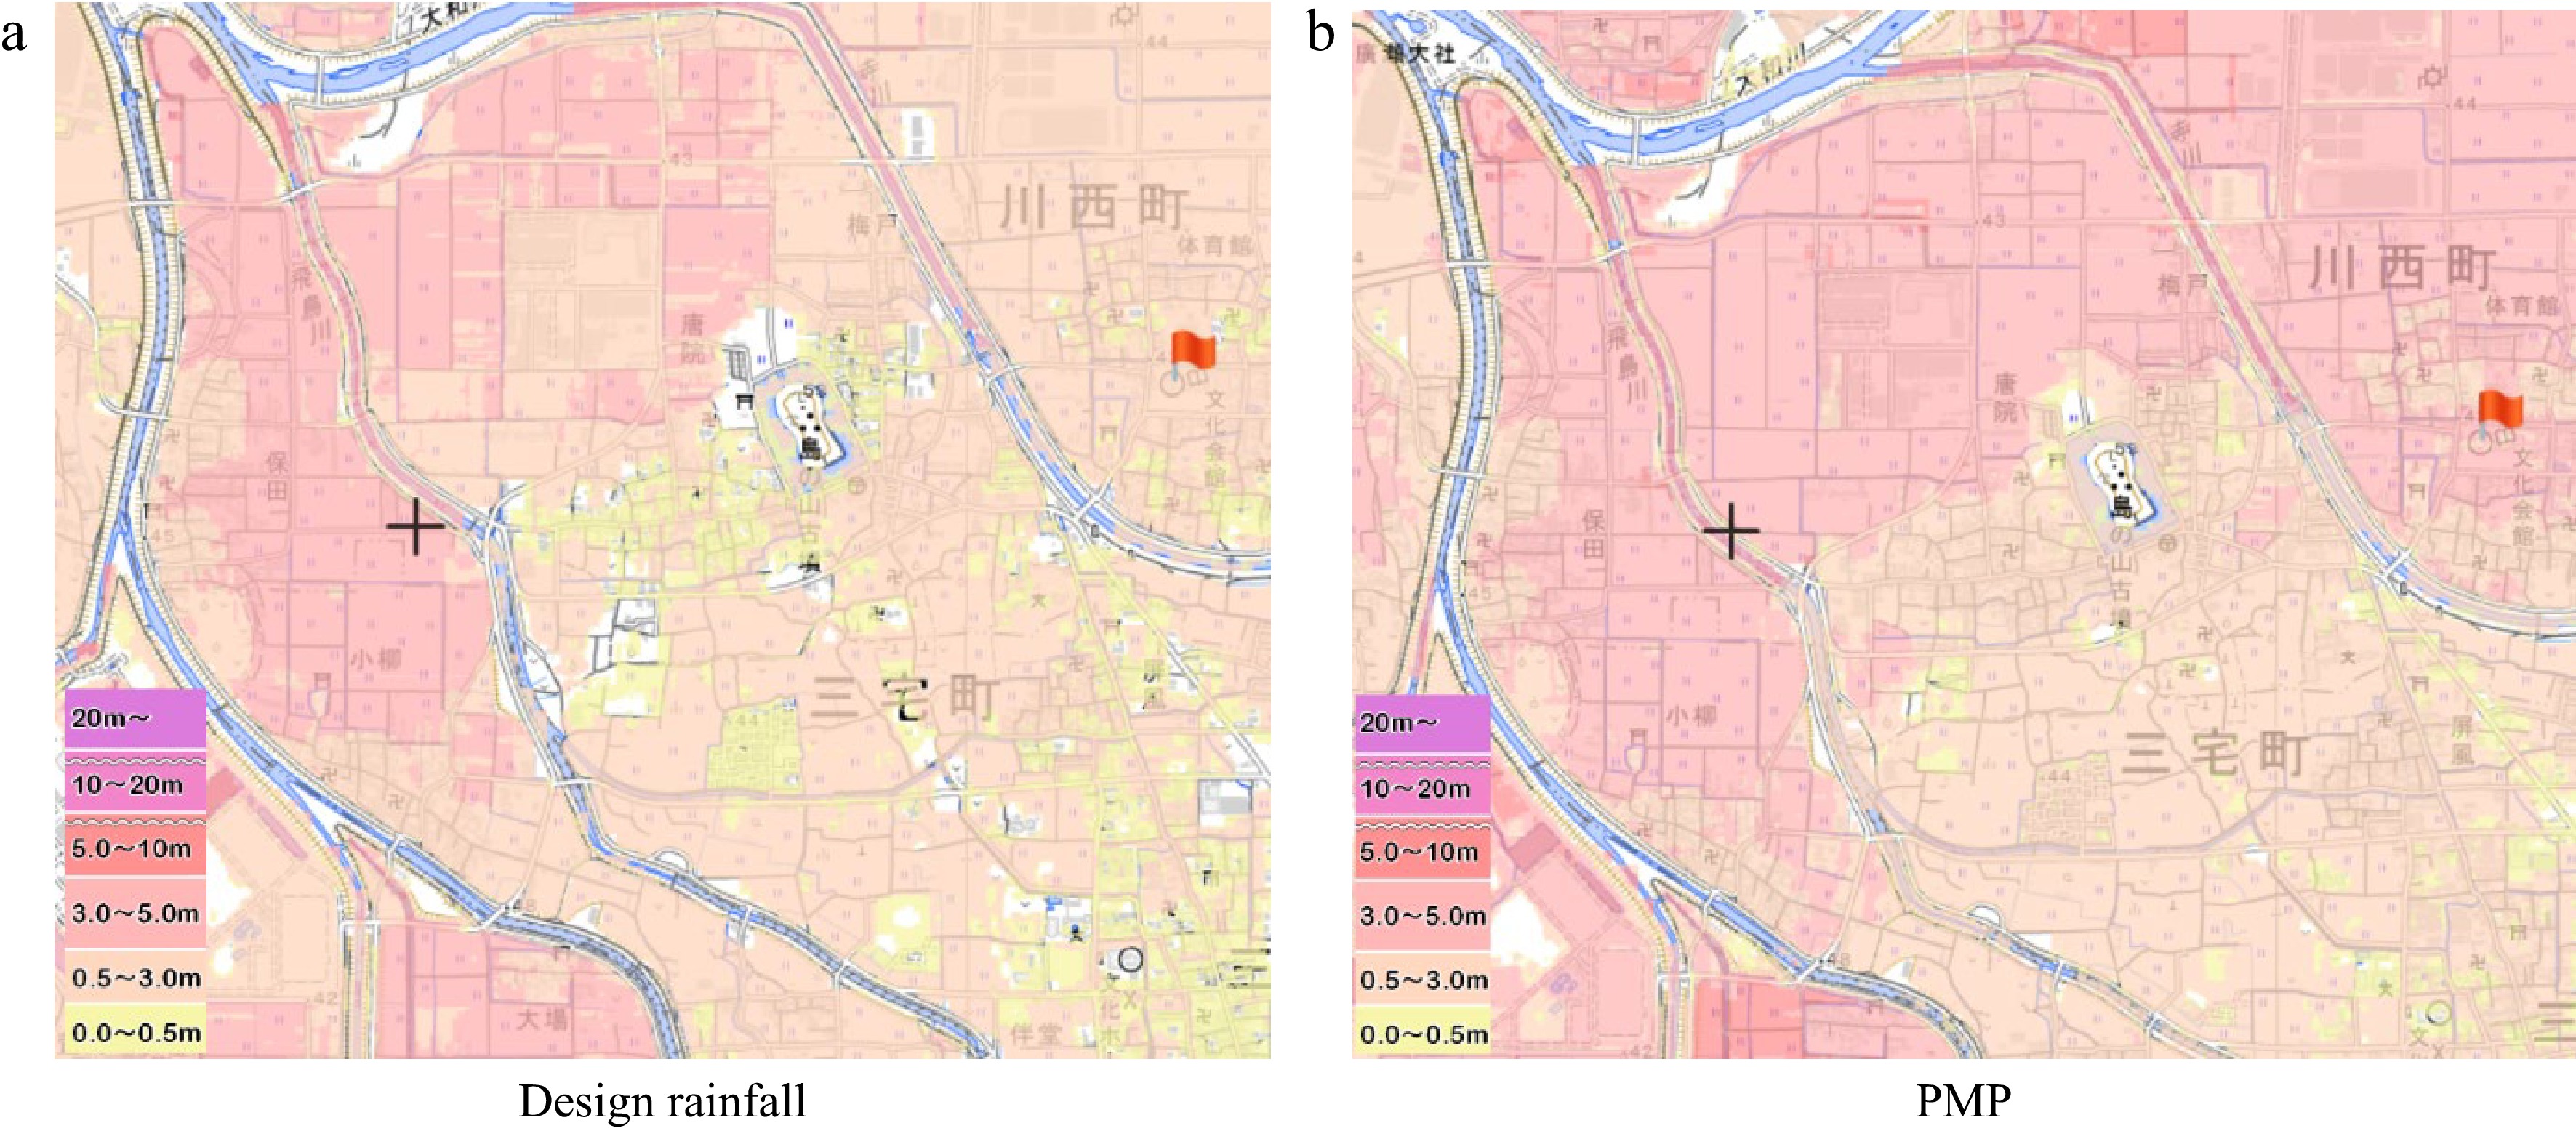
Figure 12.
Flood hazard map for Kawanishicho corresponding to two types of rainfall (Source: MLIT).
Figures
(12)
Tables
(0)