-
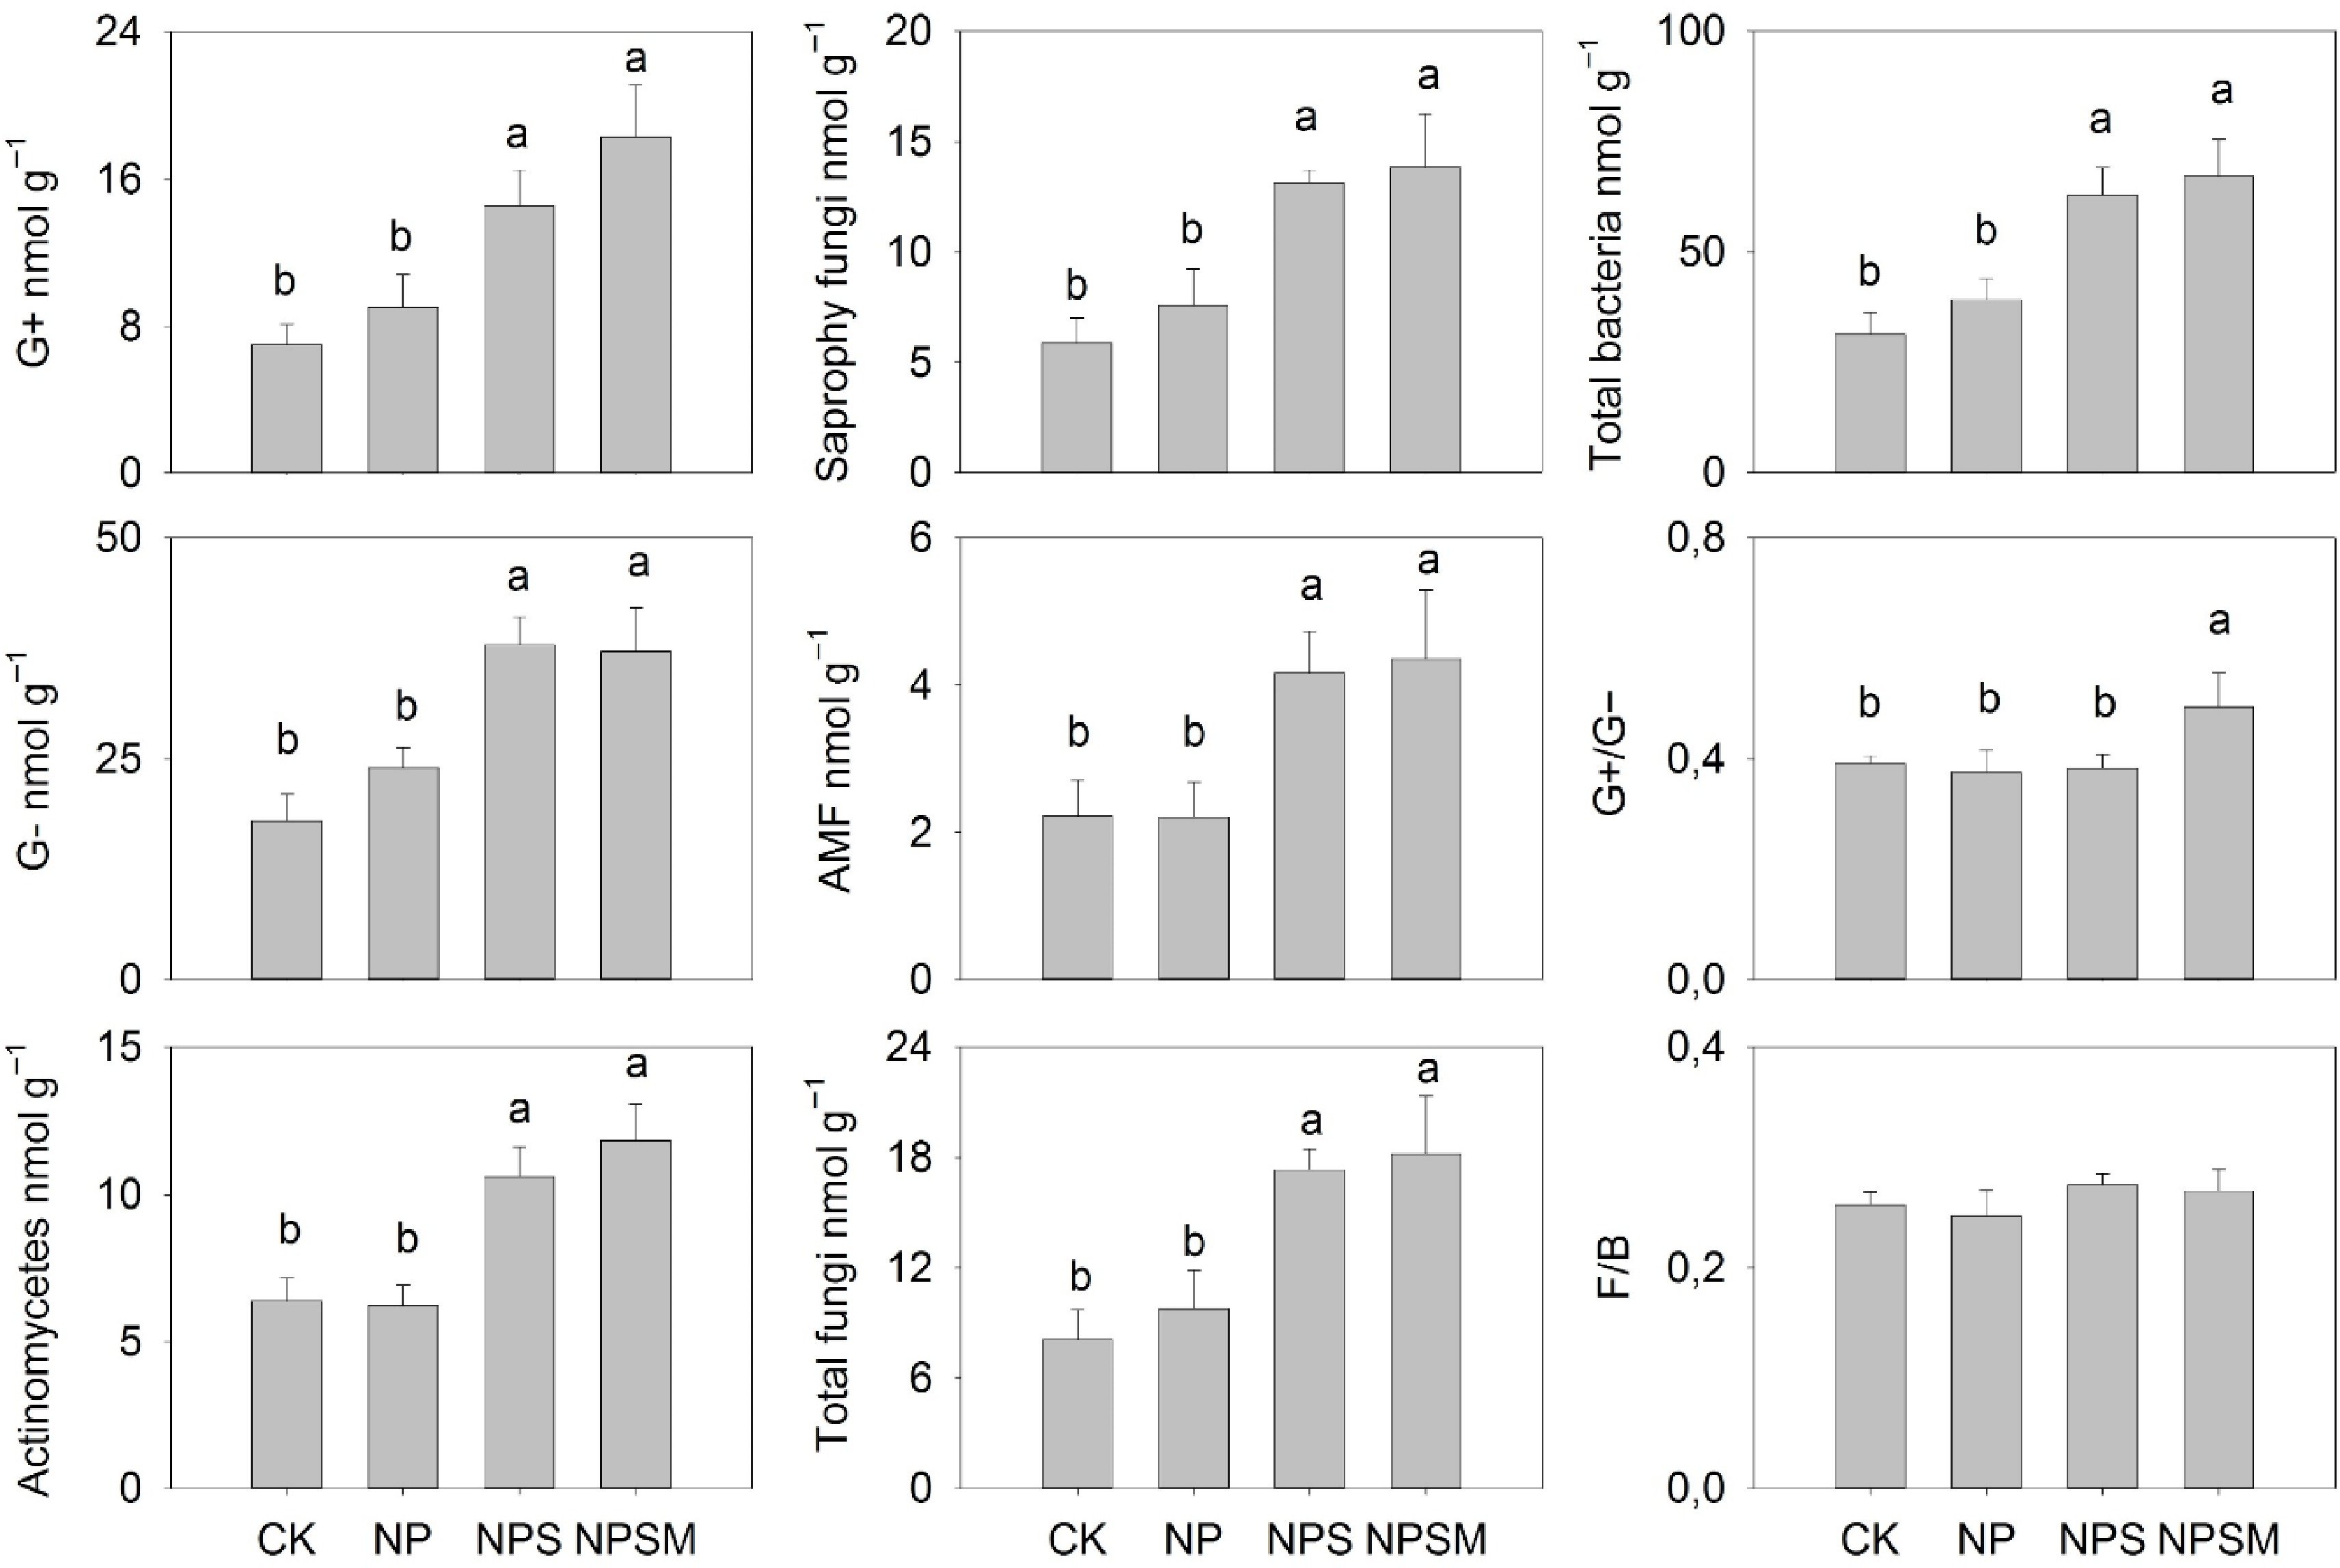
Figure 1.
Impact of different fertilization regimes on abundance of the microbial biomarker groups . Error bars represent the standard error of the means and different letters indicate significant differences at p < 0.05 among treatments. Source: Li et al.[60].
-
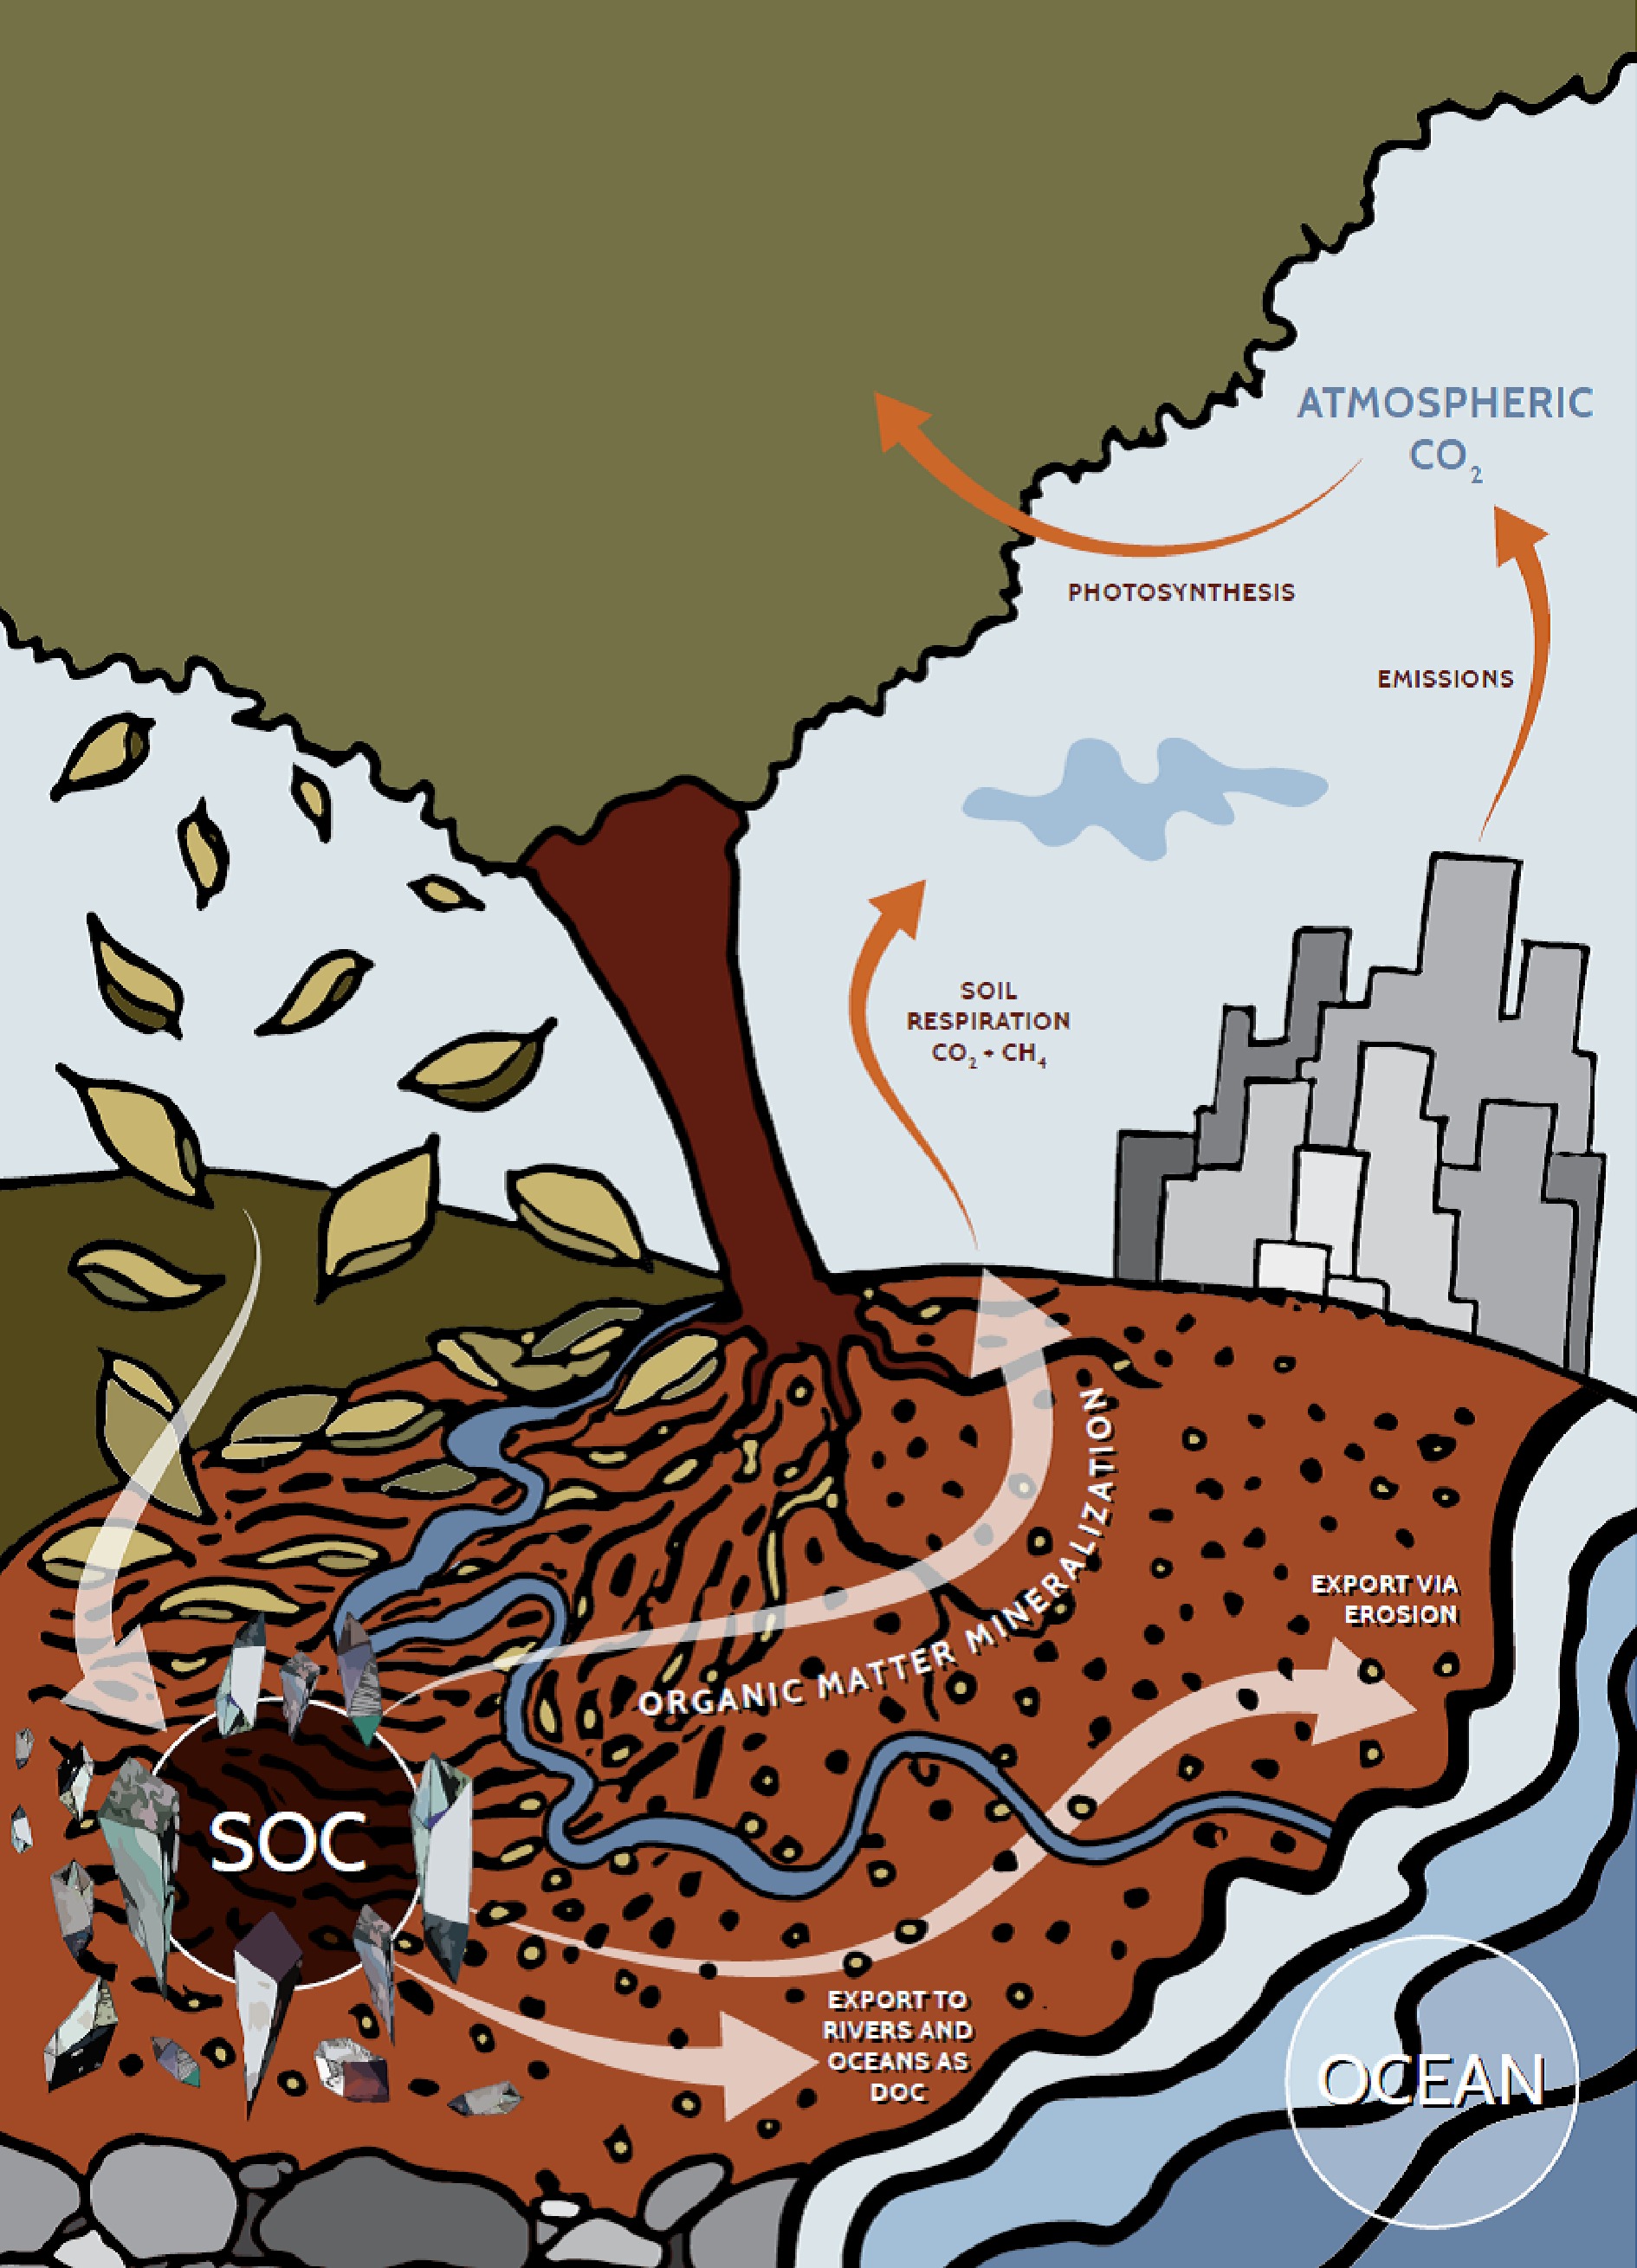
Figure 2.
Soil organic carbon (SOC) dynamics in the global carbon cycle.
-
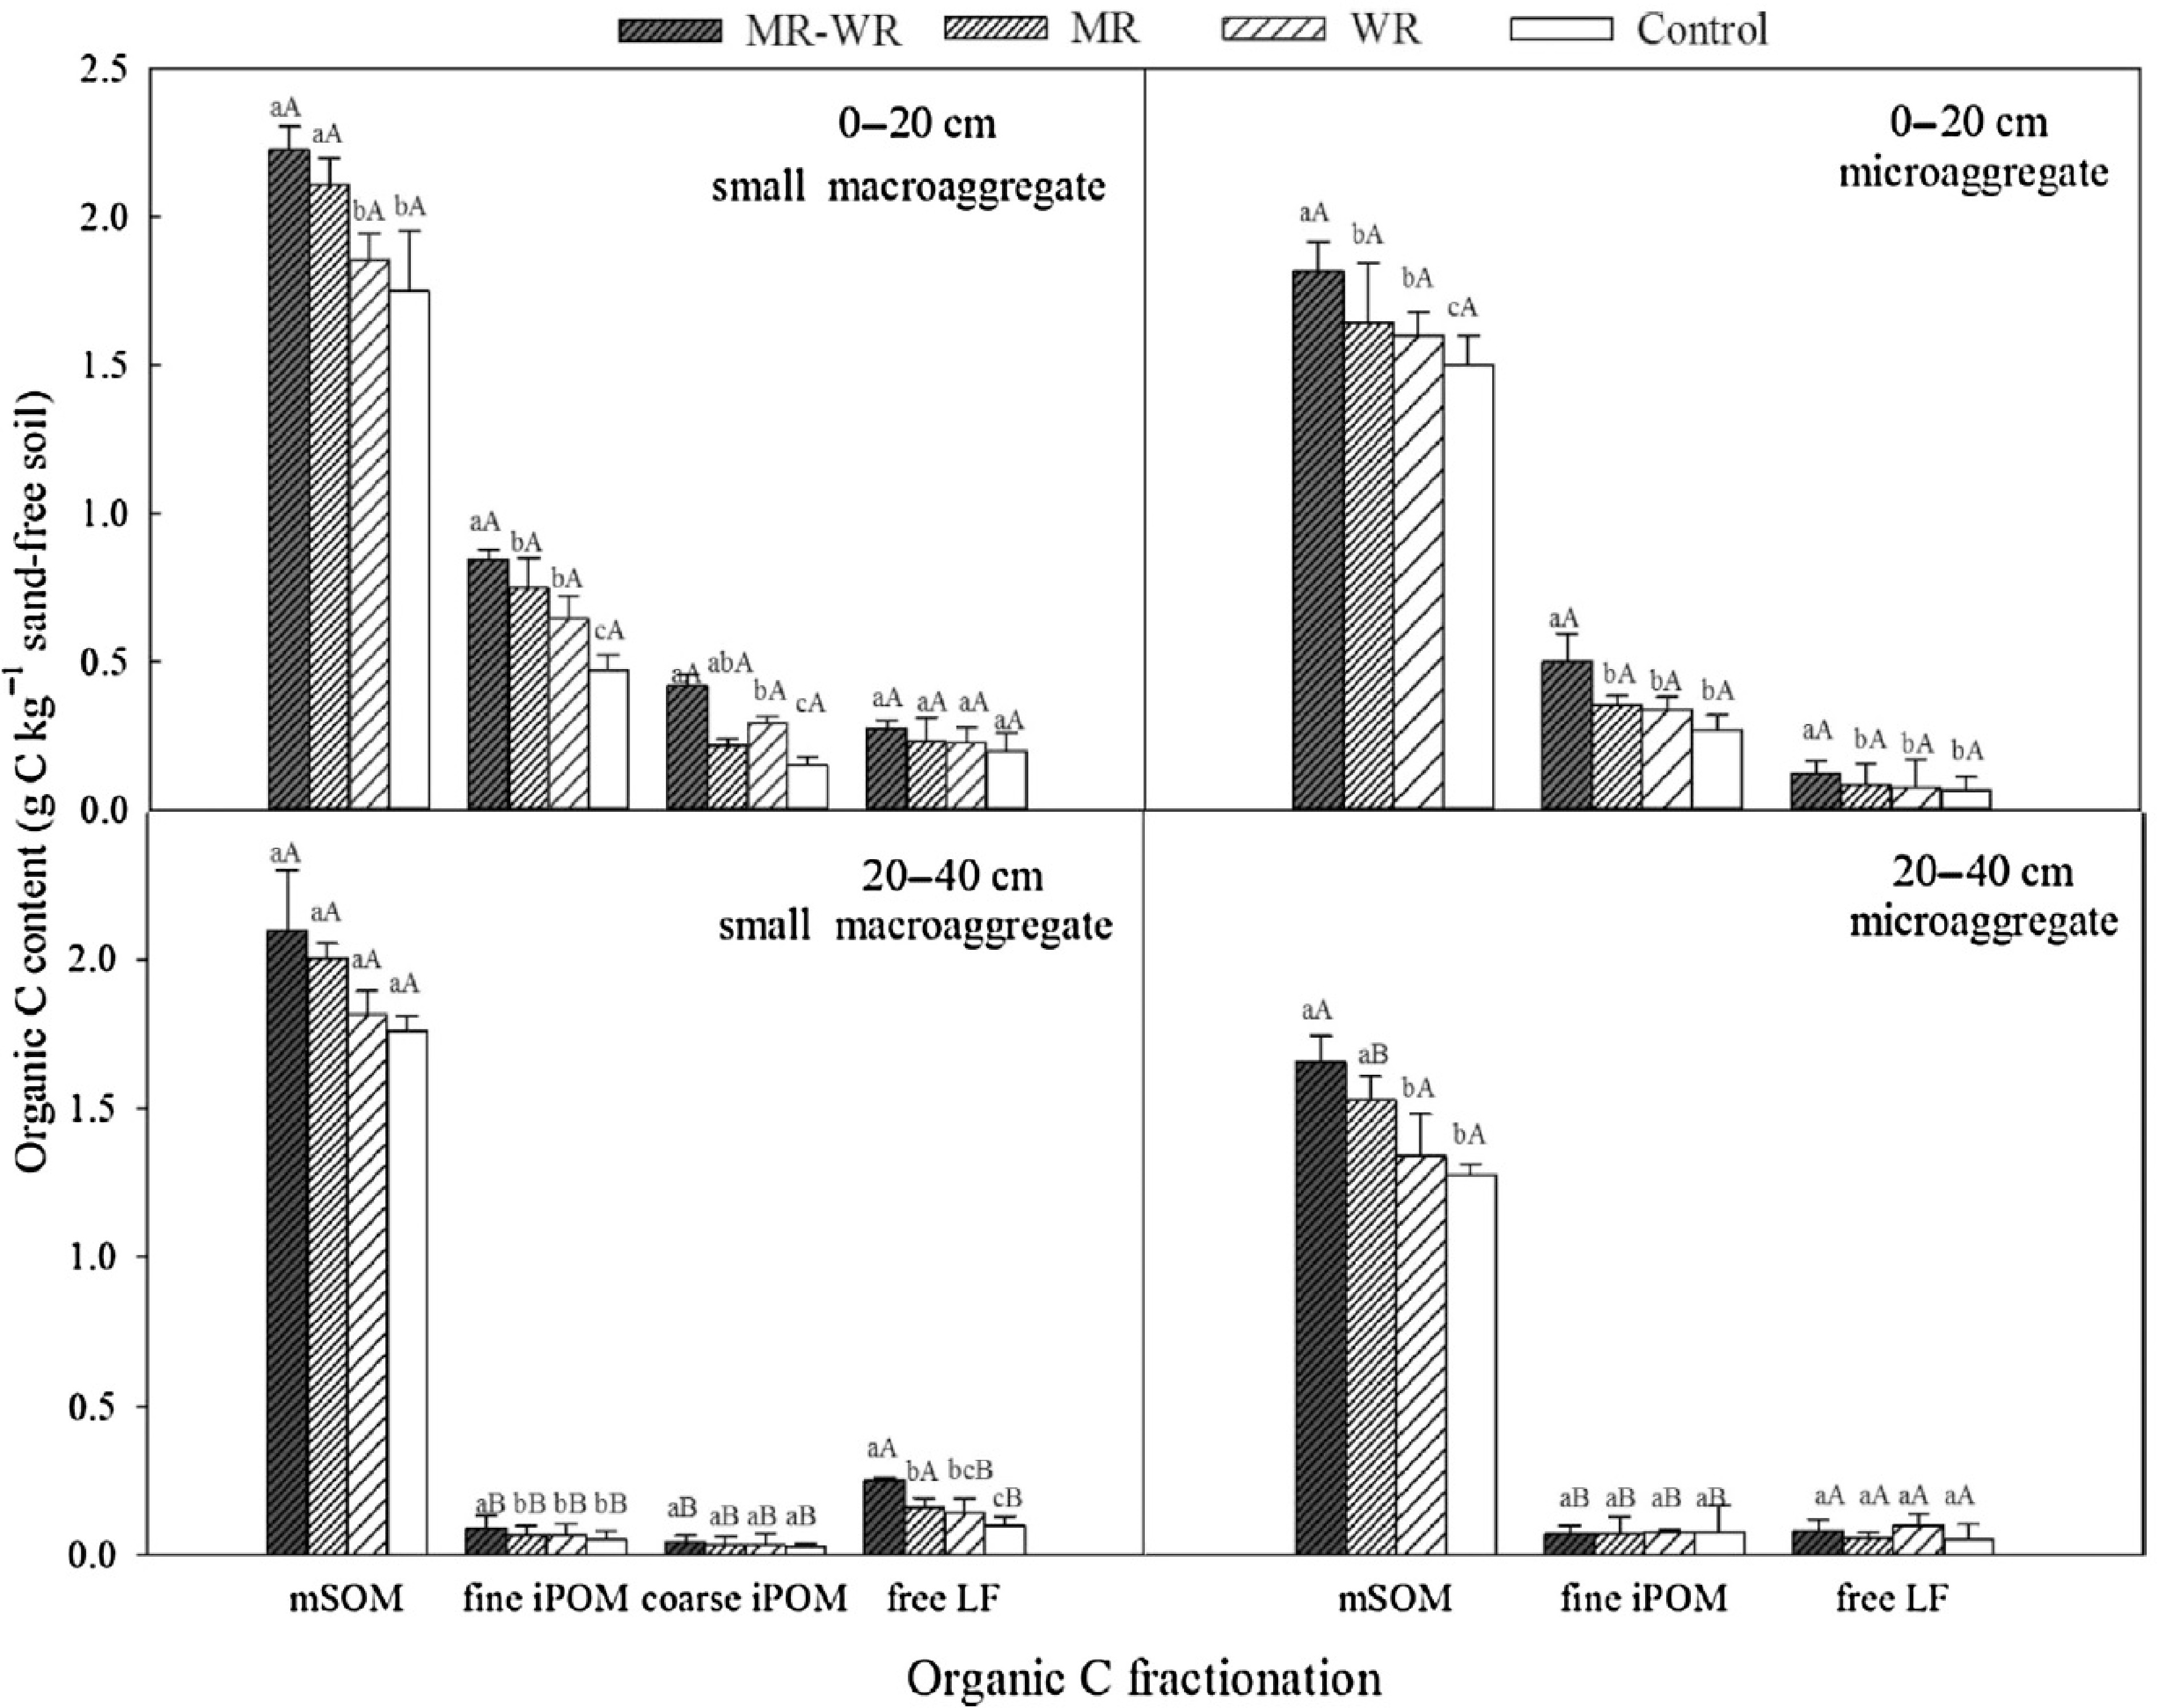
Figure 3.
Distribution of OC in coarse iPOM (intra-aggregate particulate organic matter) fine iPOM, mSOM (mineral-associated matter), and free LF (free light fraction) of small macro-aggregates and micro-aggregates in the 0–20 cm and 20–40 cm soil layers under MR-WR (return of both maize and wheat straw), MR (maize straw return), WR (wheat straw return). Different lowercase and uppercase letters indicate significant differences at p < 0.05 among treatments and depths respectively[104].
-
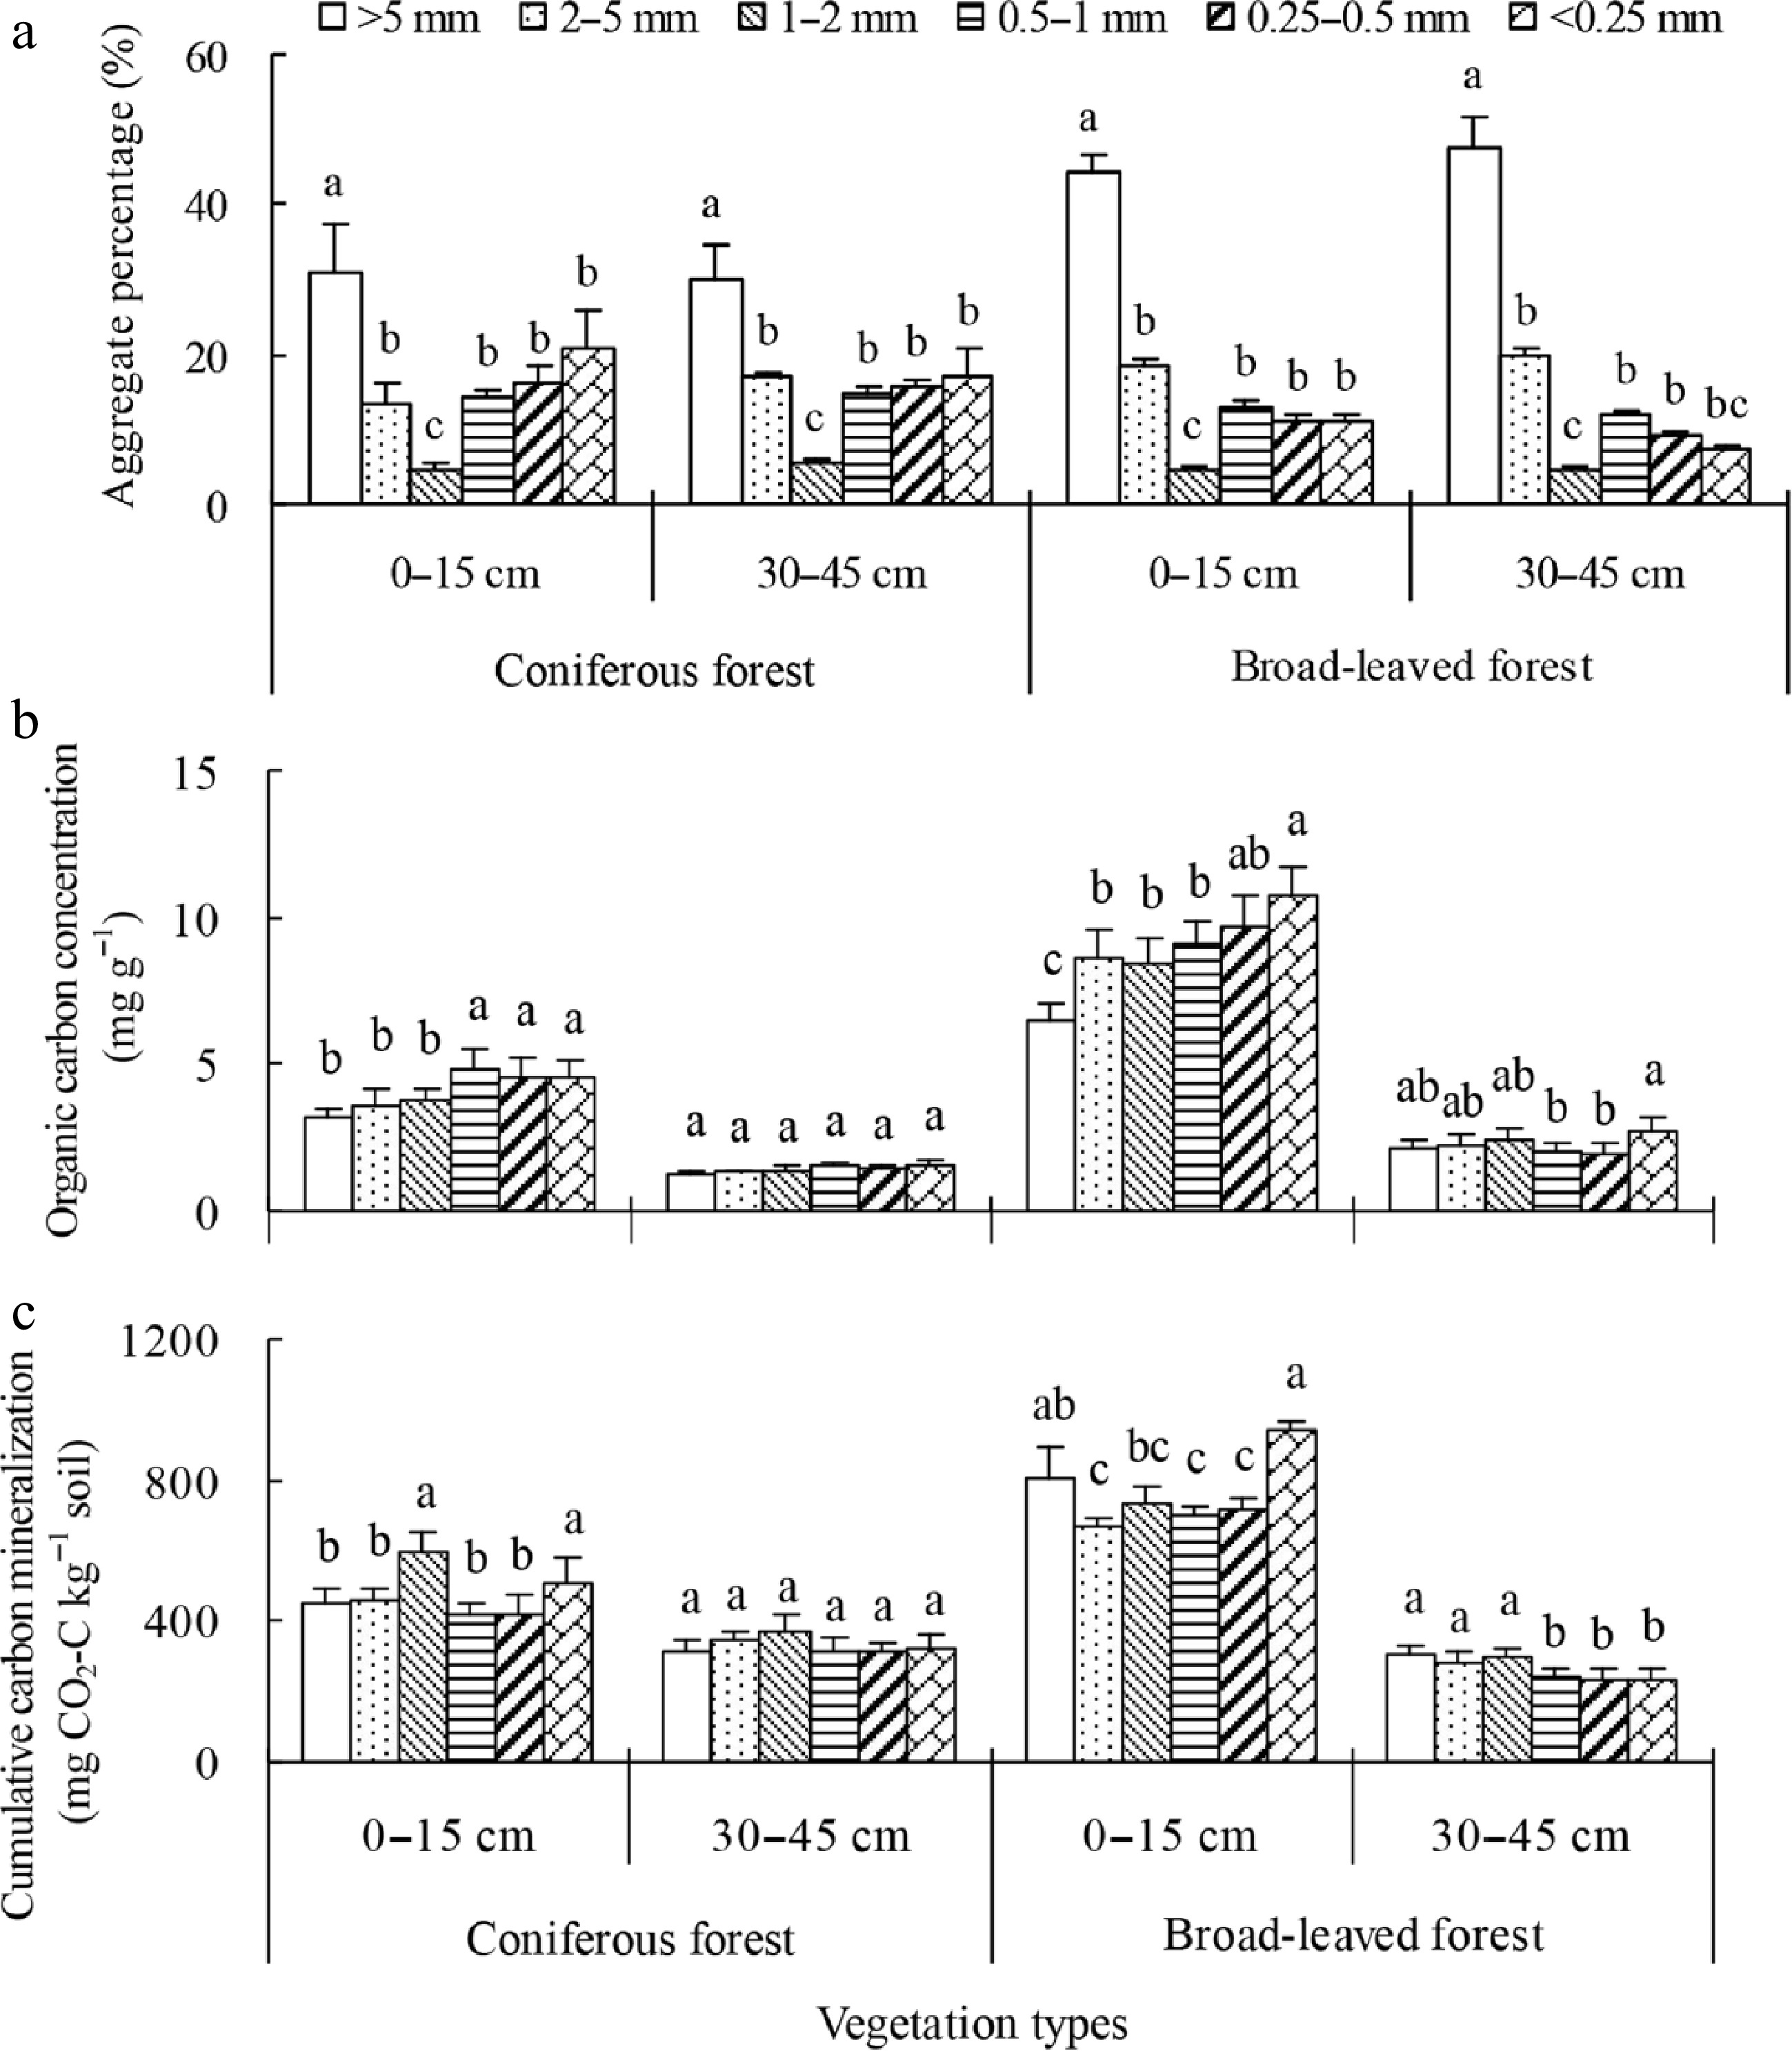
Figure 4.
(a) Soil aggregate fractions of two depths in two restored plantations of subtropical China, (b) organic carbon and (c) its mineralization from various soil aggregates within 71 d at various soil depths in two restored plantations of subtropical China. Error bars show the standard error of the mean. The different letters represent significant differences among the different soil aggregate fractions within a depth at p < 0.05[115].
-
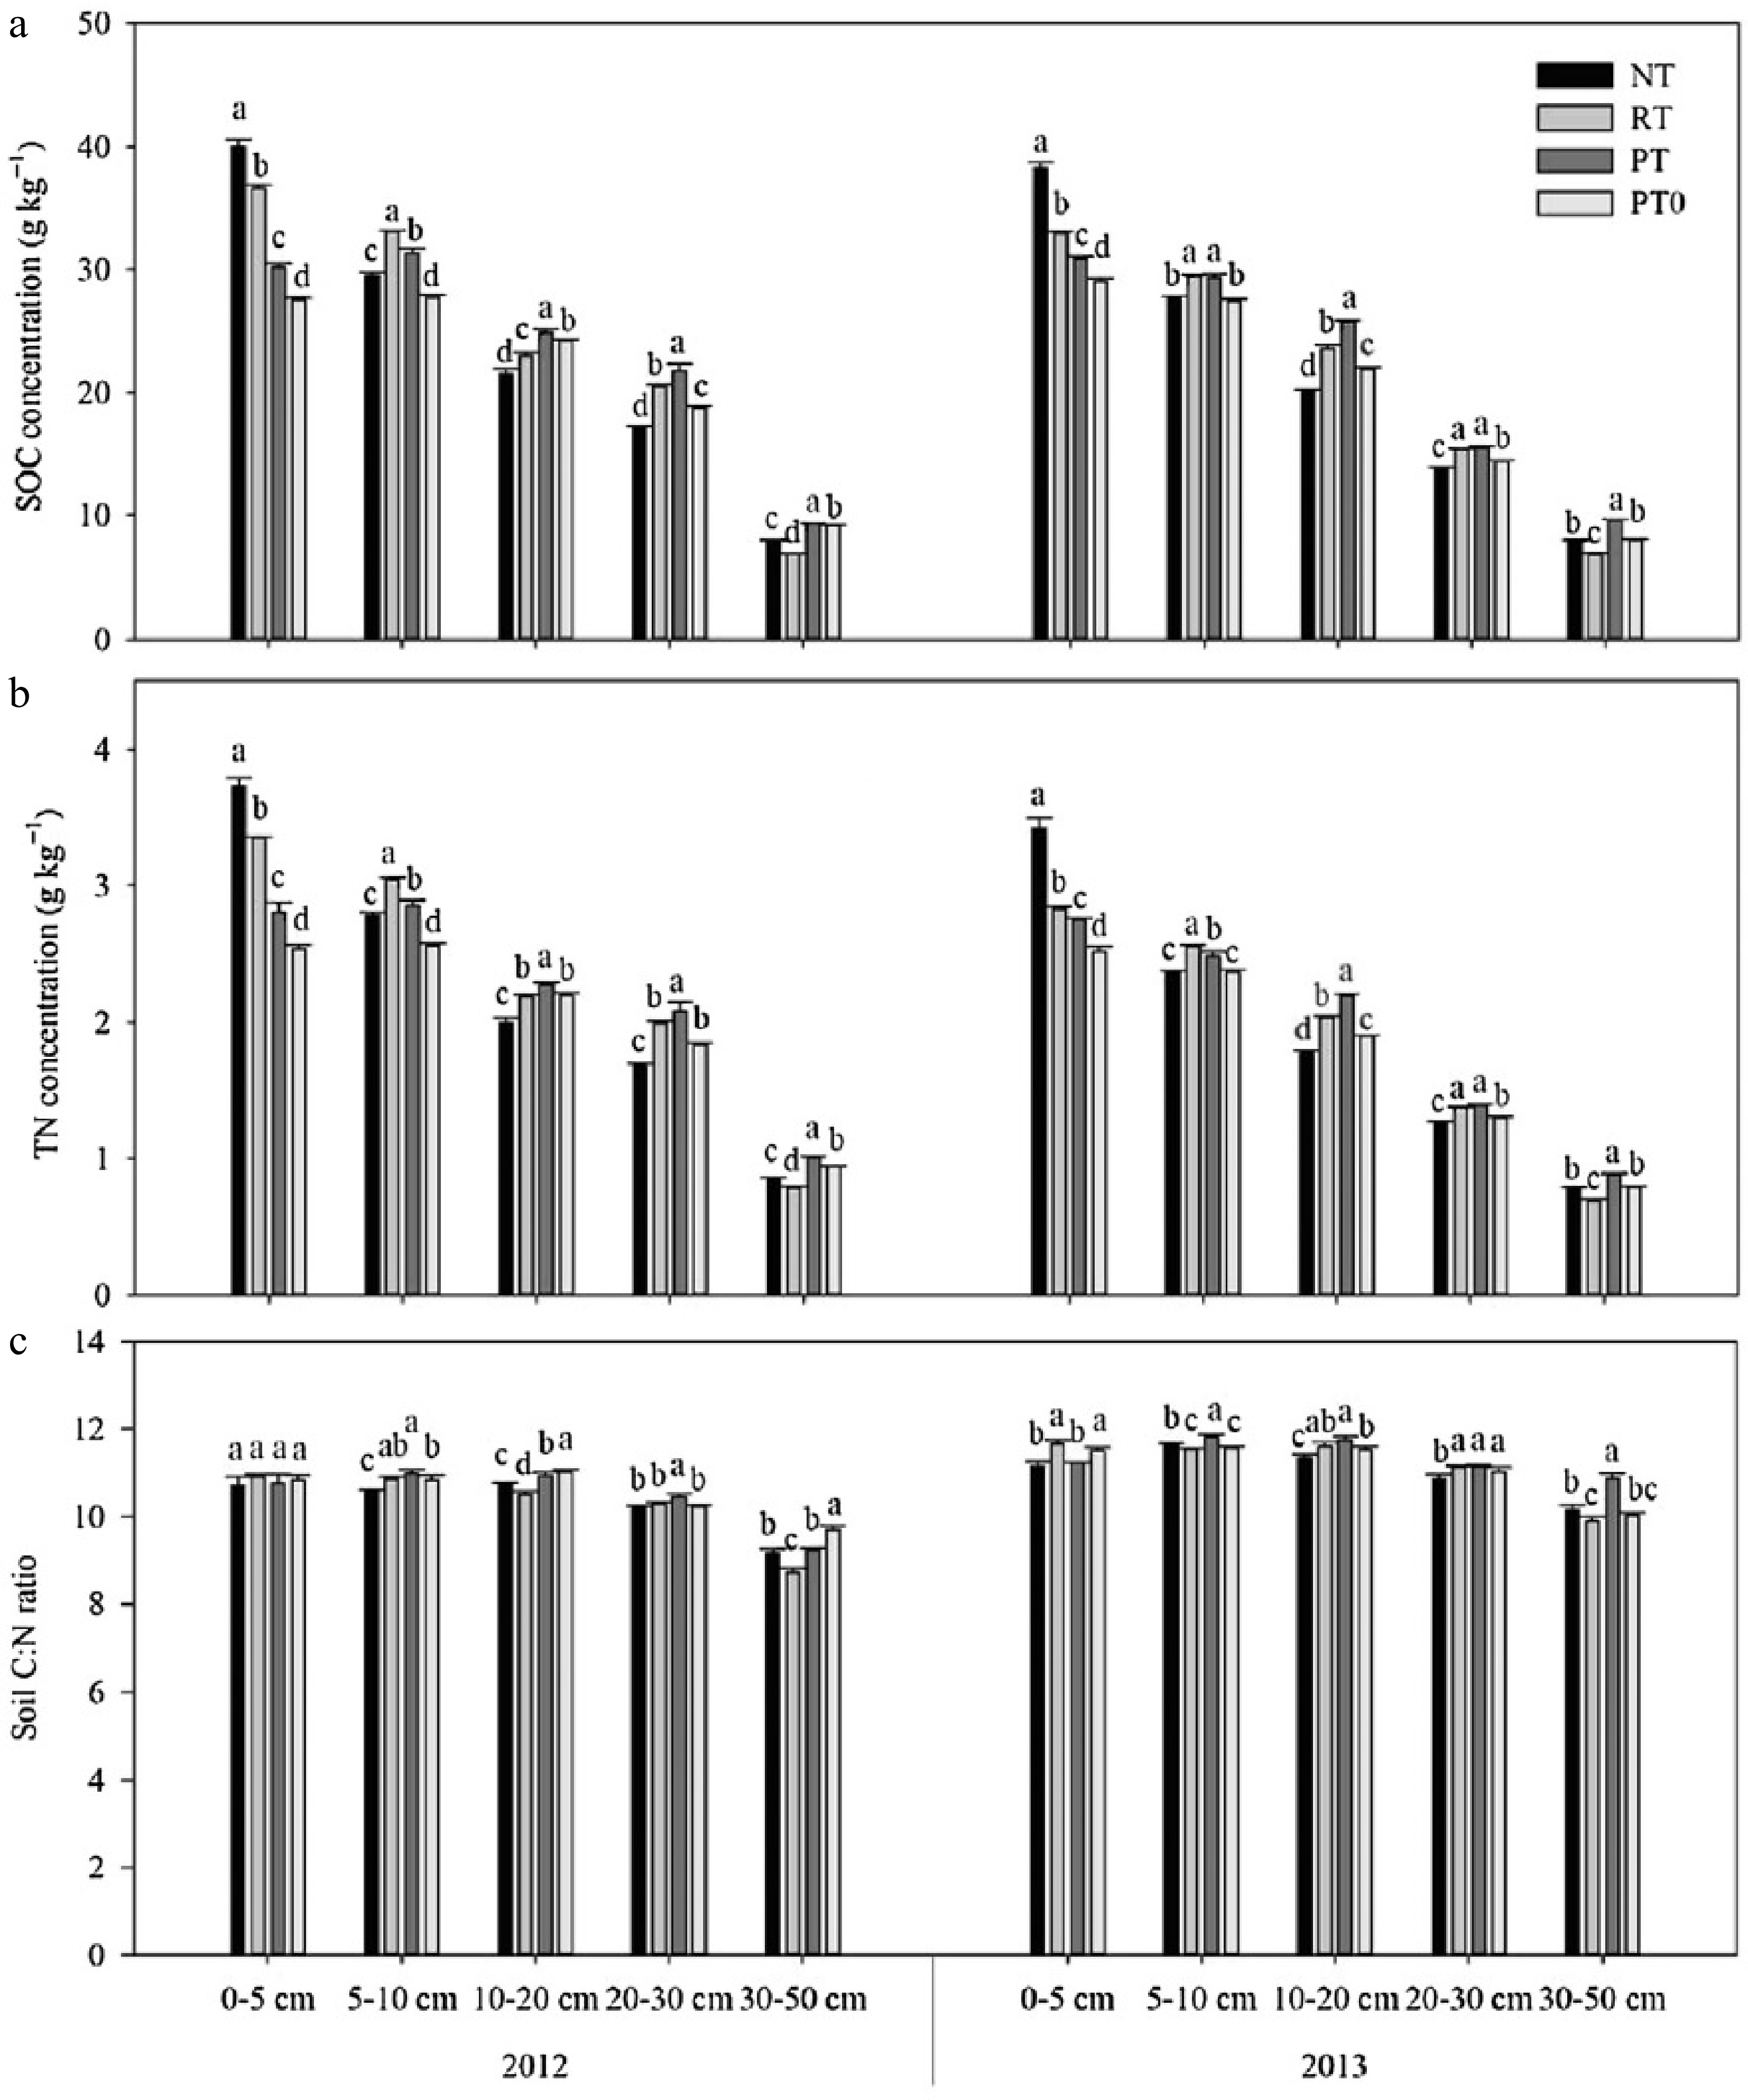
Figure 5.
The concentrations of (a) SOC, (b) total nitrogen (TN), and (c) soil C:N ratio for 0–50 cm profile under different tillage treatments in 2012 and 2013. NT = no-till with residue retention; RT = rotary tillage with residue incorporation; PT = plow tillage with residue incorporation; and PT0 = plow tillage with residue removed. The lowercase letters indicate statistical difference among treatments at p < 0.05[117].
-
Treatments PMN (mg kg−1) MBC (mg kg−1) MBN (mg kg−1) DOC (mg kg−1) Depths (cm) 0−15 15−30 0−15 15−30 0−15 15−30 0−15 15−30 Tillage practices ZTR 12.4 11.2 562.5 471.1 20.2 18.9 198.6 183.6 ZTWR 8.5 7.6 350.4 302.1 14.1 12.6 167.1 159.2 RTR 10.6 9.9 490.2 399.3 19.1 17.2 186.4 171.6 RTWR 7.6 6.6 318.1 299.8 14.4 13.7 159.5 148.7 CTR 9.3 8.5 402.9 354.4 18.2 16.6 175.9 168.9 CT 6.7 5.6 307.9 289.5 11.8 9.7 142.5 134.6 Nitrogen management Control 3.6 2.8 218.3 202.9 10.8 10.4 103.7 92.3 80 kg N ha−1 5.3 4.4 241.1 199.4 14.9 12.2 128.3 116.9 120 kg N ha−1 8.9 7.6 282.7 220.9 16.5 16.1 136.8 123.6 160 kg N ha−1 9.8 8.4 343.9 262.9 19.4 18.1 164.8 148.9 200 kg N ha−1 10.4 9.7 346.3 269.6 22.7 21.7 155.7 136.4 ZTR = Zero tillage with residue retention, ZTWR = Zero tillage without residue retention; RTR = Reduced tillage with residue retention, RTWR = Reduced tillage without residue retention, CTR = Conventional tillage with residue incorporation; CT = Conventional tillage without residue incorporation. Table 1.
Effect of different treatments on contents of various fractions of soil organic carbon[38].
-
Tillage and crop establishment methods Depths (m) 0–0.05 0.05–0.15 0.15–0.3 0.3–0.6 0–0.6 Total SOC (t/ha) CTR-CTW 3.5e 7.1c 8.7 7.0 26.2c CTR-ZTW 3.9d 7.6bc 8.8 6.5 26.7c ZTDSR-CTW 4.2d 7.5bc 9.2 6.3 27.3c ZTDSR-ZTW 4.9c 8.9ab 8.2 6.2 28.2bc ZTDSR-ZTW+R 6.1a 9.0ab 9.8 6.8 31.8a PBDSR-PBW+R 5.5b 9.3a 9.3 6.0 30.1ab MSD 0.4 1.7 2.0 1.4 2.49 Treatment effect
(p value)< 0.001 0.04 0.158 0.267 < 0.001 Initial SOC content 3.6 ±
0.158.1 ±
1.398.78 ±
1.076.7 ±
0.7327.1 ±
1.21Change in SOC over seven years (t/ha) CTR-CTW −0.16 −0.99 −0.04 0.28 −0.90 CTR-ZTW 0.28 −0.50 0.01 −0.20 −0.41 ZTDSR-CTW 0.62 −0.57 0.45 −0.34 0.16 ZTDSR-ZTW 1.34 0.84 −0.62 −0.46 1.09 ZTDSR-ZTW+R 2.49 0.96 1.04 0.16 4.66 PBDSR-PBW+R 1.89 1.22 0.51 −0.64 2.98 CTR-CTW = Conventionally tilled puddled transplanted rice followed by conventionally tilled wheat, CTR-ZTW = Conventionally tilled puddled transplanted rice followed by zero-tilled wheat, ZTDSR-CTW = Zero-tilled direct dry-seeded rice followed by conventionally tilled wheat, ZTDSR-ZTW = Zero-tilled direct dry-seeded rice followed by zero-tilled wheat, ZTDSR-ZTW+R = Zero-tilled direct dry-seeded rice followed by zero-tilled wheat with residue retention, PBDSR-PBW+R = Direct dry-seeded rice followed by direct drilling of wheat both on permanent beds with residue retention, MSD, minimum significant difference. Significant different letters indicate significant differences at p < 0.05. Table 2.
Influence of tillage and crop establishment methods on SOC stock and its temporal variation under rice–wheat system[120].
-
Treatment Depths (cm) 0−15 15−30 30−45 Total Very Labile C Control 3.6 ± 0.5c 1.4 ± 0.3b 1.3 ± 0.2a 6.3 ± 0.4b 50% NPK 4.6 ± 0.3bc 2.1 ± 0.7ab 1.5 ± 0.1a 8.1 ± 0.9a 100% NPK 4.4 ± 0.3bc 2.3 ± 0.2a 1.4 ± 0.5a 8.0 ± 0.7a 150% NPK 5.0 ± 0.2ab 2.6 ± 0.2a 1.5 ± 0.1a 9.0 ± 0.3a 100% NPK + FYM 4.8 ± 0.2ab 2.0 ± 0.2ab 1.3 ± 0.3a 8.1 ± 0.2a FYM 5.9 ± 1.3a 2.2 ± 0.2a 1.4 ± 0.3a 9.5 ± 1.6a Fallow 4.2 ± 0.7bc 1.5 ± 0.5b 0.7 ± 0.3b 6.3 ± 0.8b Lbile C Control 2.4 ± 0.3a 1.0 ± 0.2a 0.8 ± 0.4a 4.2 ± 0.6a 50% NPK 1.7 ± 0.4ab 0.9 ± 0.5a 0.7 ± 0.2a 3.3 ± 0.7a 100% NPK 1.8 ± 0.4ab 0.8 ± 0.5a 0.6 ± 0.3a 3.2 ± 0.8a 150% NPK 1.2 ± 0.3b 0.7 ± 0.2a 0.9 ± 0.2a 2.8 ± 0.4a 100% NPK + FYM 1.9 ± 0.3ab 0.7 ± 0.2a 0.7 ± 0.3a 3.4 ± 0.2a FYM 2.5 ± 0.9a 0.7 ± 0.3a 0.7 ± 0.2a 3.9 ± 0.9a Fallow 2.2 ± 1.0ab 1.0 ± 0.3a 1.0 ± 0.4a 4.1 ± 1.1a Less labile C Control 1.5 ± 0.3c 0.6 ± 0.4c 0.4 ± 0.0c 2.6 ± 0.7d 50% NPK 1.8 ± 0.1c 0.4 ± 0.1c 0.5 ± 0.2c 2.7 ± 0.1cd 100% NPK 2.5 ± 0.3ab 0.8 ± 0.1bc 1.1 ± 0.2ab 4.4 ± 0.1b 150% NPK 2.6 ± 0.2a 0.9 ± 0.1bc 0.4 ± 0.2c 3.9 ± 0.1b 100% NPK + FYM 2.7 ± 0.6a 1.5 ± 0.2a 1.4 ± 0.1a 5.6 ± 0.7a FYM 1.9 ± 0.7bc 1.7 ± 0.2a 1.0 ± 0.2b 4.5 ± 0.7ab Fallow 1.5 ± 0.3c 1.3 ± 0.7ab 0.9 ± 0.4b 3.8 ± 1.2bc Non labile C Control 1.2 ± 0.5b 1.2 ± 0.3a 0.2 ± 0.2b 2.6 ± 0.5b 50% NPK 1.2 ± 0.9b 1.7 ± 0.8a 0.7 ± 0.4ab 3.5 ± 1.8ab 100% NPK 1.3 ± 0.6b 1.5 ± 0.6a 0.5 ± 0.2ab 3.3 ± 1.0ab 150% NPK 1.4 ± 0.3b 1.5 ± 0.2a 0.8 ± 0.1a 3.7 ± 0.3ab 100% NPK + FYM 2.0 ± 0.8b 1.3 ± 0.1a 0.3 ± 0.3ab 3.5 ± 0.7ab FYM 3.7 ± 1.3a 1.0 ± 0.2a 0.5 ± 0.5ab 5.1 ± 1.9a Fallow 2.1 ± 0.2b 1.4 ± 0.7a 0.4 ± 0.2ab 3.9 ± 0.9ab Values in the same column followed by different letters are significantly different at p < 0.001, ± indicates the standard deviation values of the means. Table 3.
Oxidisable organic carbon fractions in soils (g kg−1) at different layers[126].
-
Treatments WSOC
(g kg−1)SOC
(g kg−1)OC
(g kg−1)BC
(g kg−1)POC
(mg kg−)PON
(mg kg−1)LFOC
(mg kg−1)LFON
(mg kg−1)Depths (cm) 0−15 15−30 0−15 15−30 0−15 15−30 0−15 15−30 0−15 15−30 0−15 15−30 0−15 15−30 0−15 15−30 Tillage practices ZTR 28.8 26.2 23.1 19.3 9.61 9.13 4.69 4.28 1342.8 967.9 119.5 108.1 194.7 154.8 14.8 12.3 ZTWR 25.3 24.6 18.4 14.8 7.87 7.21 3.76 3.19 981.1 667.4 94.6 86.5 120.5 104.7 11.8 10.3 RTR 27.0 25.9 22.4 18.2 8.68 8.17 4.13 3.87 1230.2 836.9 109.7 97.8 170.9 144.9 13.7 11.6 RTWR 23.7 21.8 18.1 14.2 7.66 7.07 3.12 2.96 869.4 604.4 82.6 76.6 107.1 97.3 9.7 8.6 CTR 26.1 24.4 21.8 17.4 8.49 7.96 3.82 3.48 1099.1 779.4 98.4 89.3 143.8 115.9 12.8 10.9 CT 21.8 20.9 16.1 13.1 6.21 5.64 2.89 2.63 617.5 481.8 69.2 57.6 90.8 73.6 9.6 7.9 Nitrogen management Control 21.1 14.9 16.1 13.1 6.13 5.48 1.58 1.07 709.7 658.6 31.7 26.3 123.9 104.3 6.4 5.8 80 kg N ha−1 28.3 21.2 17.8 14.7 6.46 6.16 2.46 1.75 860.7 785.6 68.4 56.2 132.8 116.1 7.6 6.9 120 kg N ha−1 29.5 22.1 19.1 16.1 7.25 6.71 3.26 2.18 952.2 808.9 89.5 78.5 150.6 127.6 9.7 8.6 160 kg N ha−1 30.2 23.1 20.8 18.2 7.75 7.28 3.82 2.66 1099.5 823.8 96.8 83.4 168.5 145.7 10.2 9.8 200 kg N ha−1 31.1 25.4 21.3 18.7 7.93 7.48 4.15 3.42 1153.1 898.4 103.9 97.3 176.2 152.9 11.7 10.6 WSOC = Water soluble organic carbon, SOC = Total soil organic carbon, OC = Oxidizable organic carbon, BC =Black carbon, POC = particulate organic carbon, PON = particulate organic nitrogen, LFOC = labile fraction organic carbon, and LFON = labile fraction organic nitrogen. ZTR = Zero tillage with residue retention, ZTWR = Zero tillage without residue retention; RTR = Reduced tillage with residue retention, RTWR = Reduced tillage without residue retention, CTR = Conventional tillage with residue incorporation; CT = Conventional tillage without residue incorporation. Table 4.
Influence of tillage and nitrogen management on distribution of carbon fractions in soil[83].
Figures
(5)
Tables
(4)