-
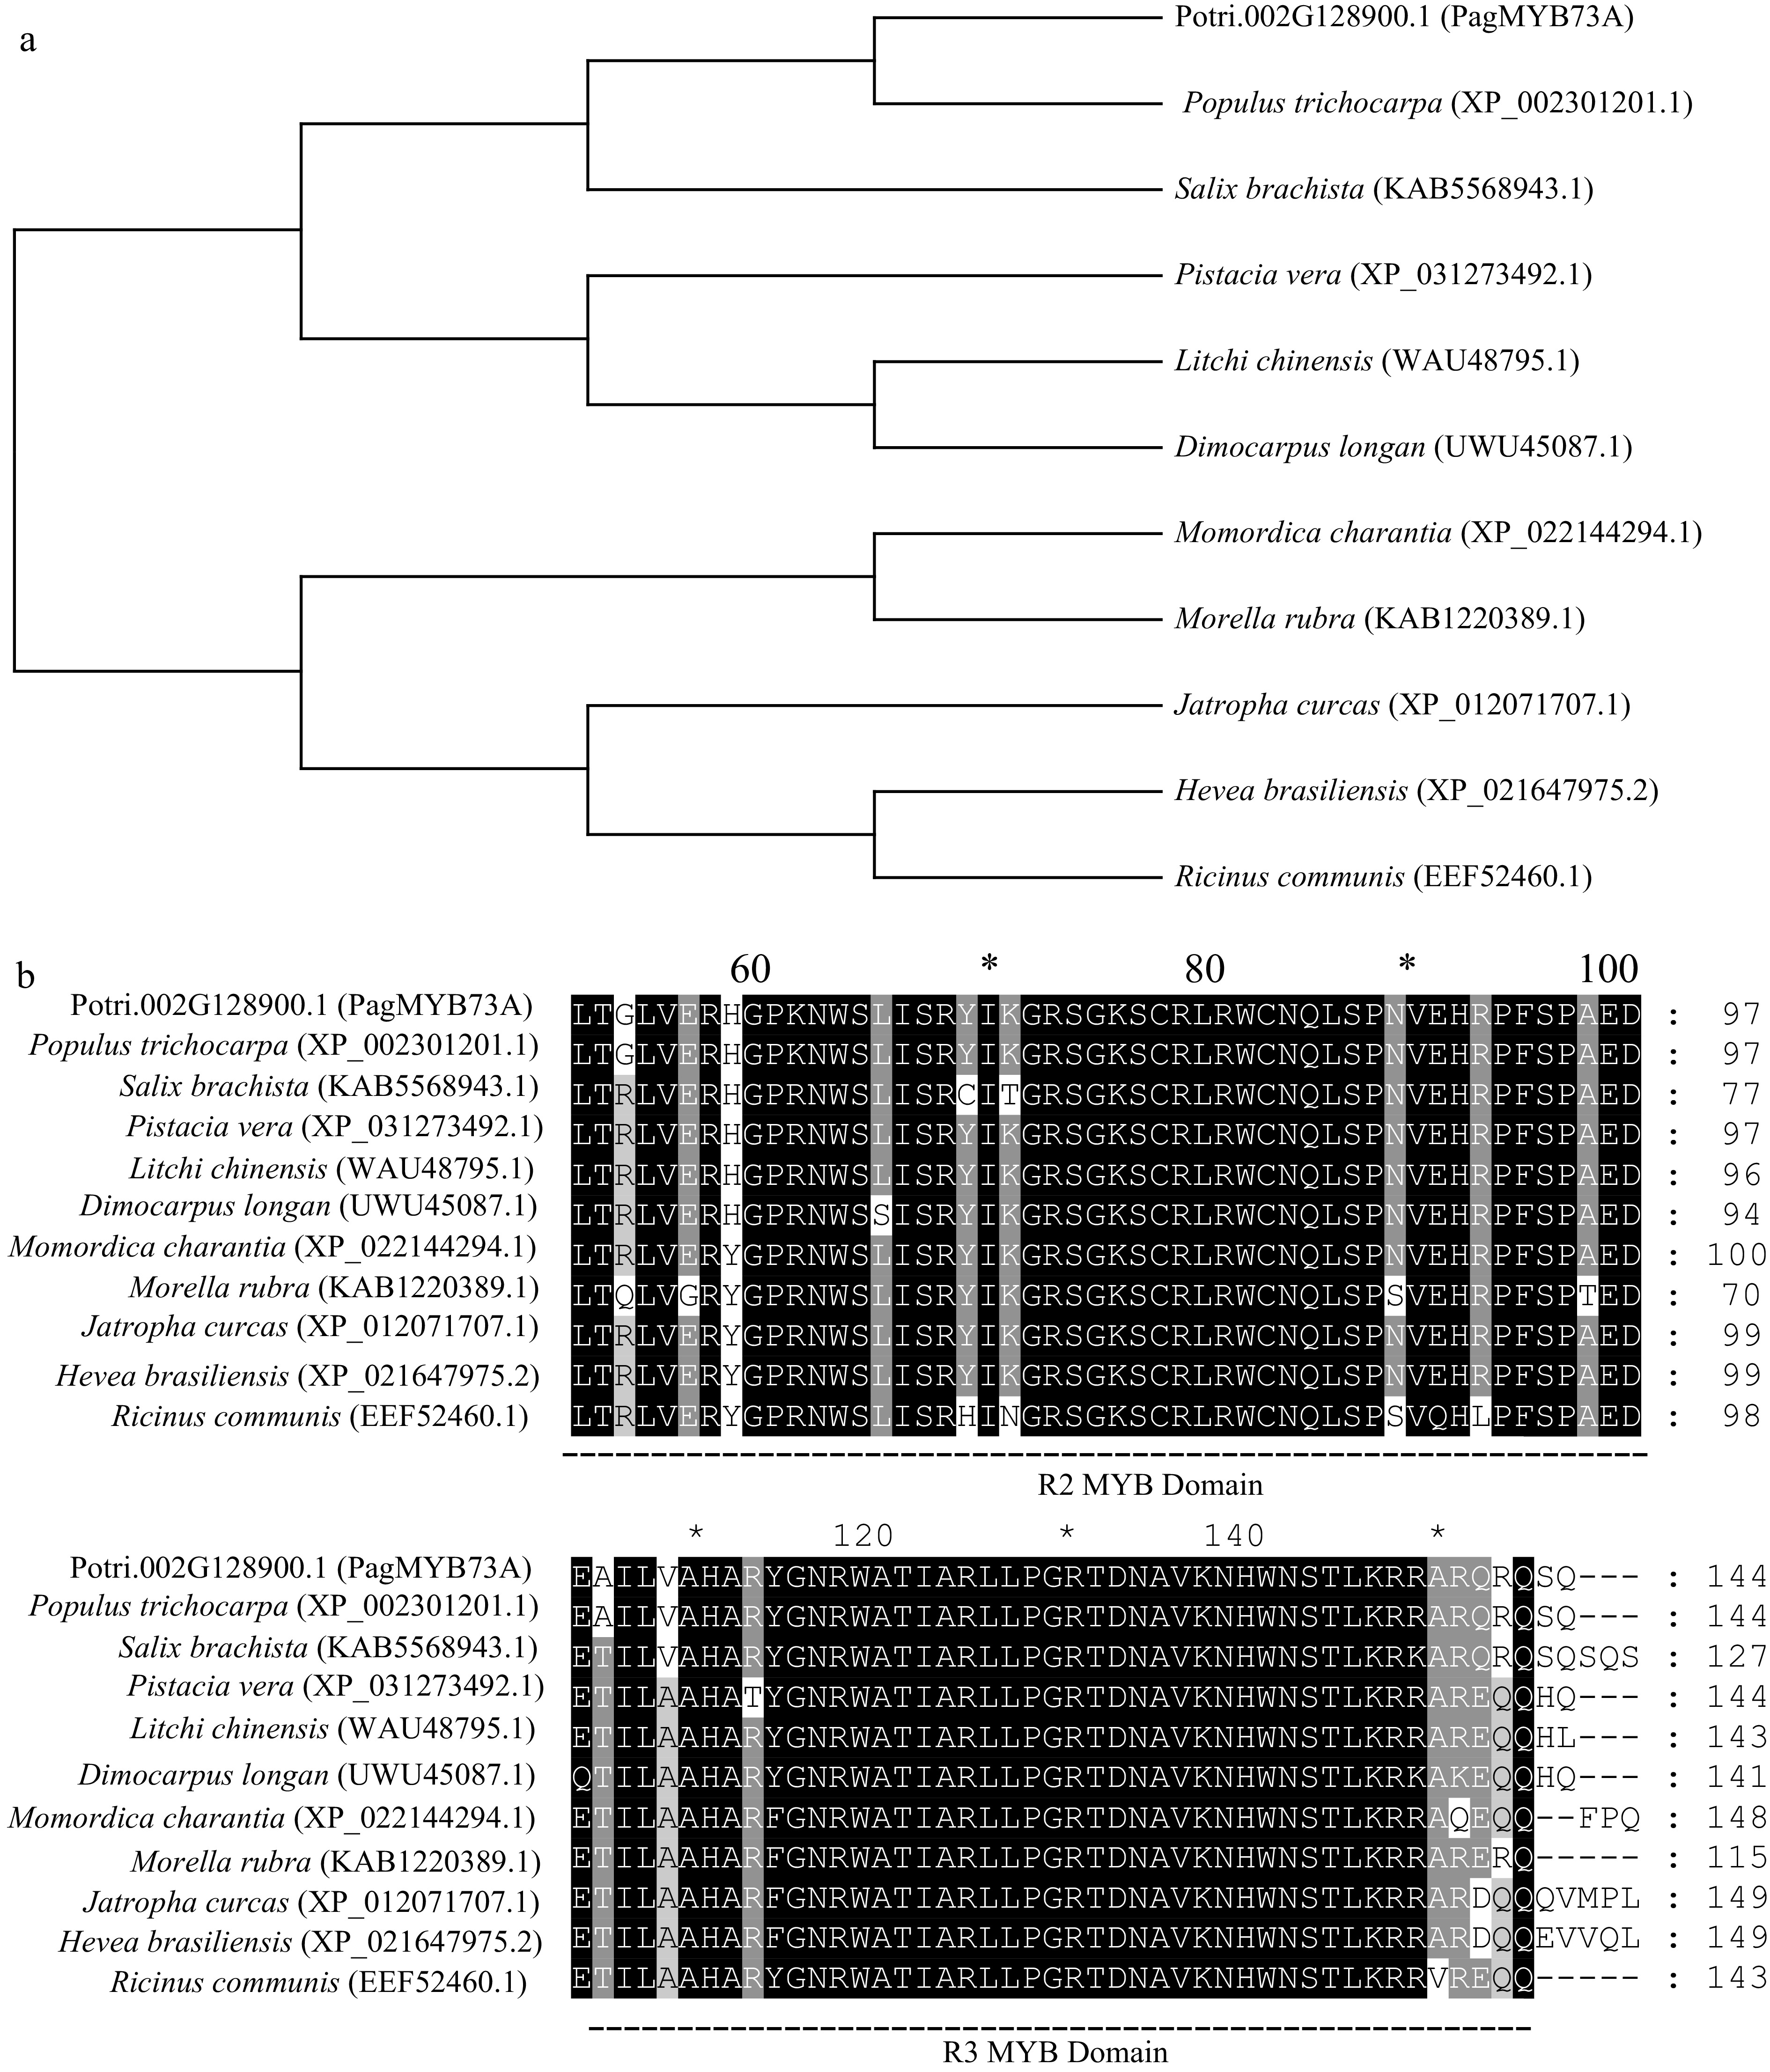
Figure 1.
Phylogenetic analysis and multiple sequence alignment of PagMYB73A and its homologous proteins. (a) Phylogenetic tree of MYB proteins constructed using the amino acid sequences. (b) Multiple sequence alignment of PagMYB73A and its homologues.
-

Figure 2.
Subcellular localization of PagMYB73A, Bar = 20 μm. 35S::GFP, control protein. 35S::PagMYB73A-GFP, the positive fusion protein. GFP, GFP fluorescence. Chloroplast, chloroplast autofluorescence. Bright: bright fields. Merged: combination of GFP fluorescence, chloroplast autofluorescence, and bright field.
-
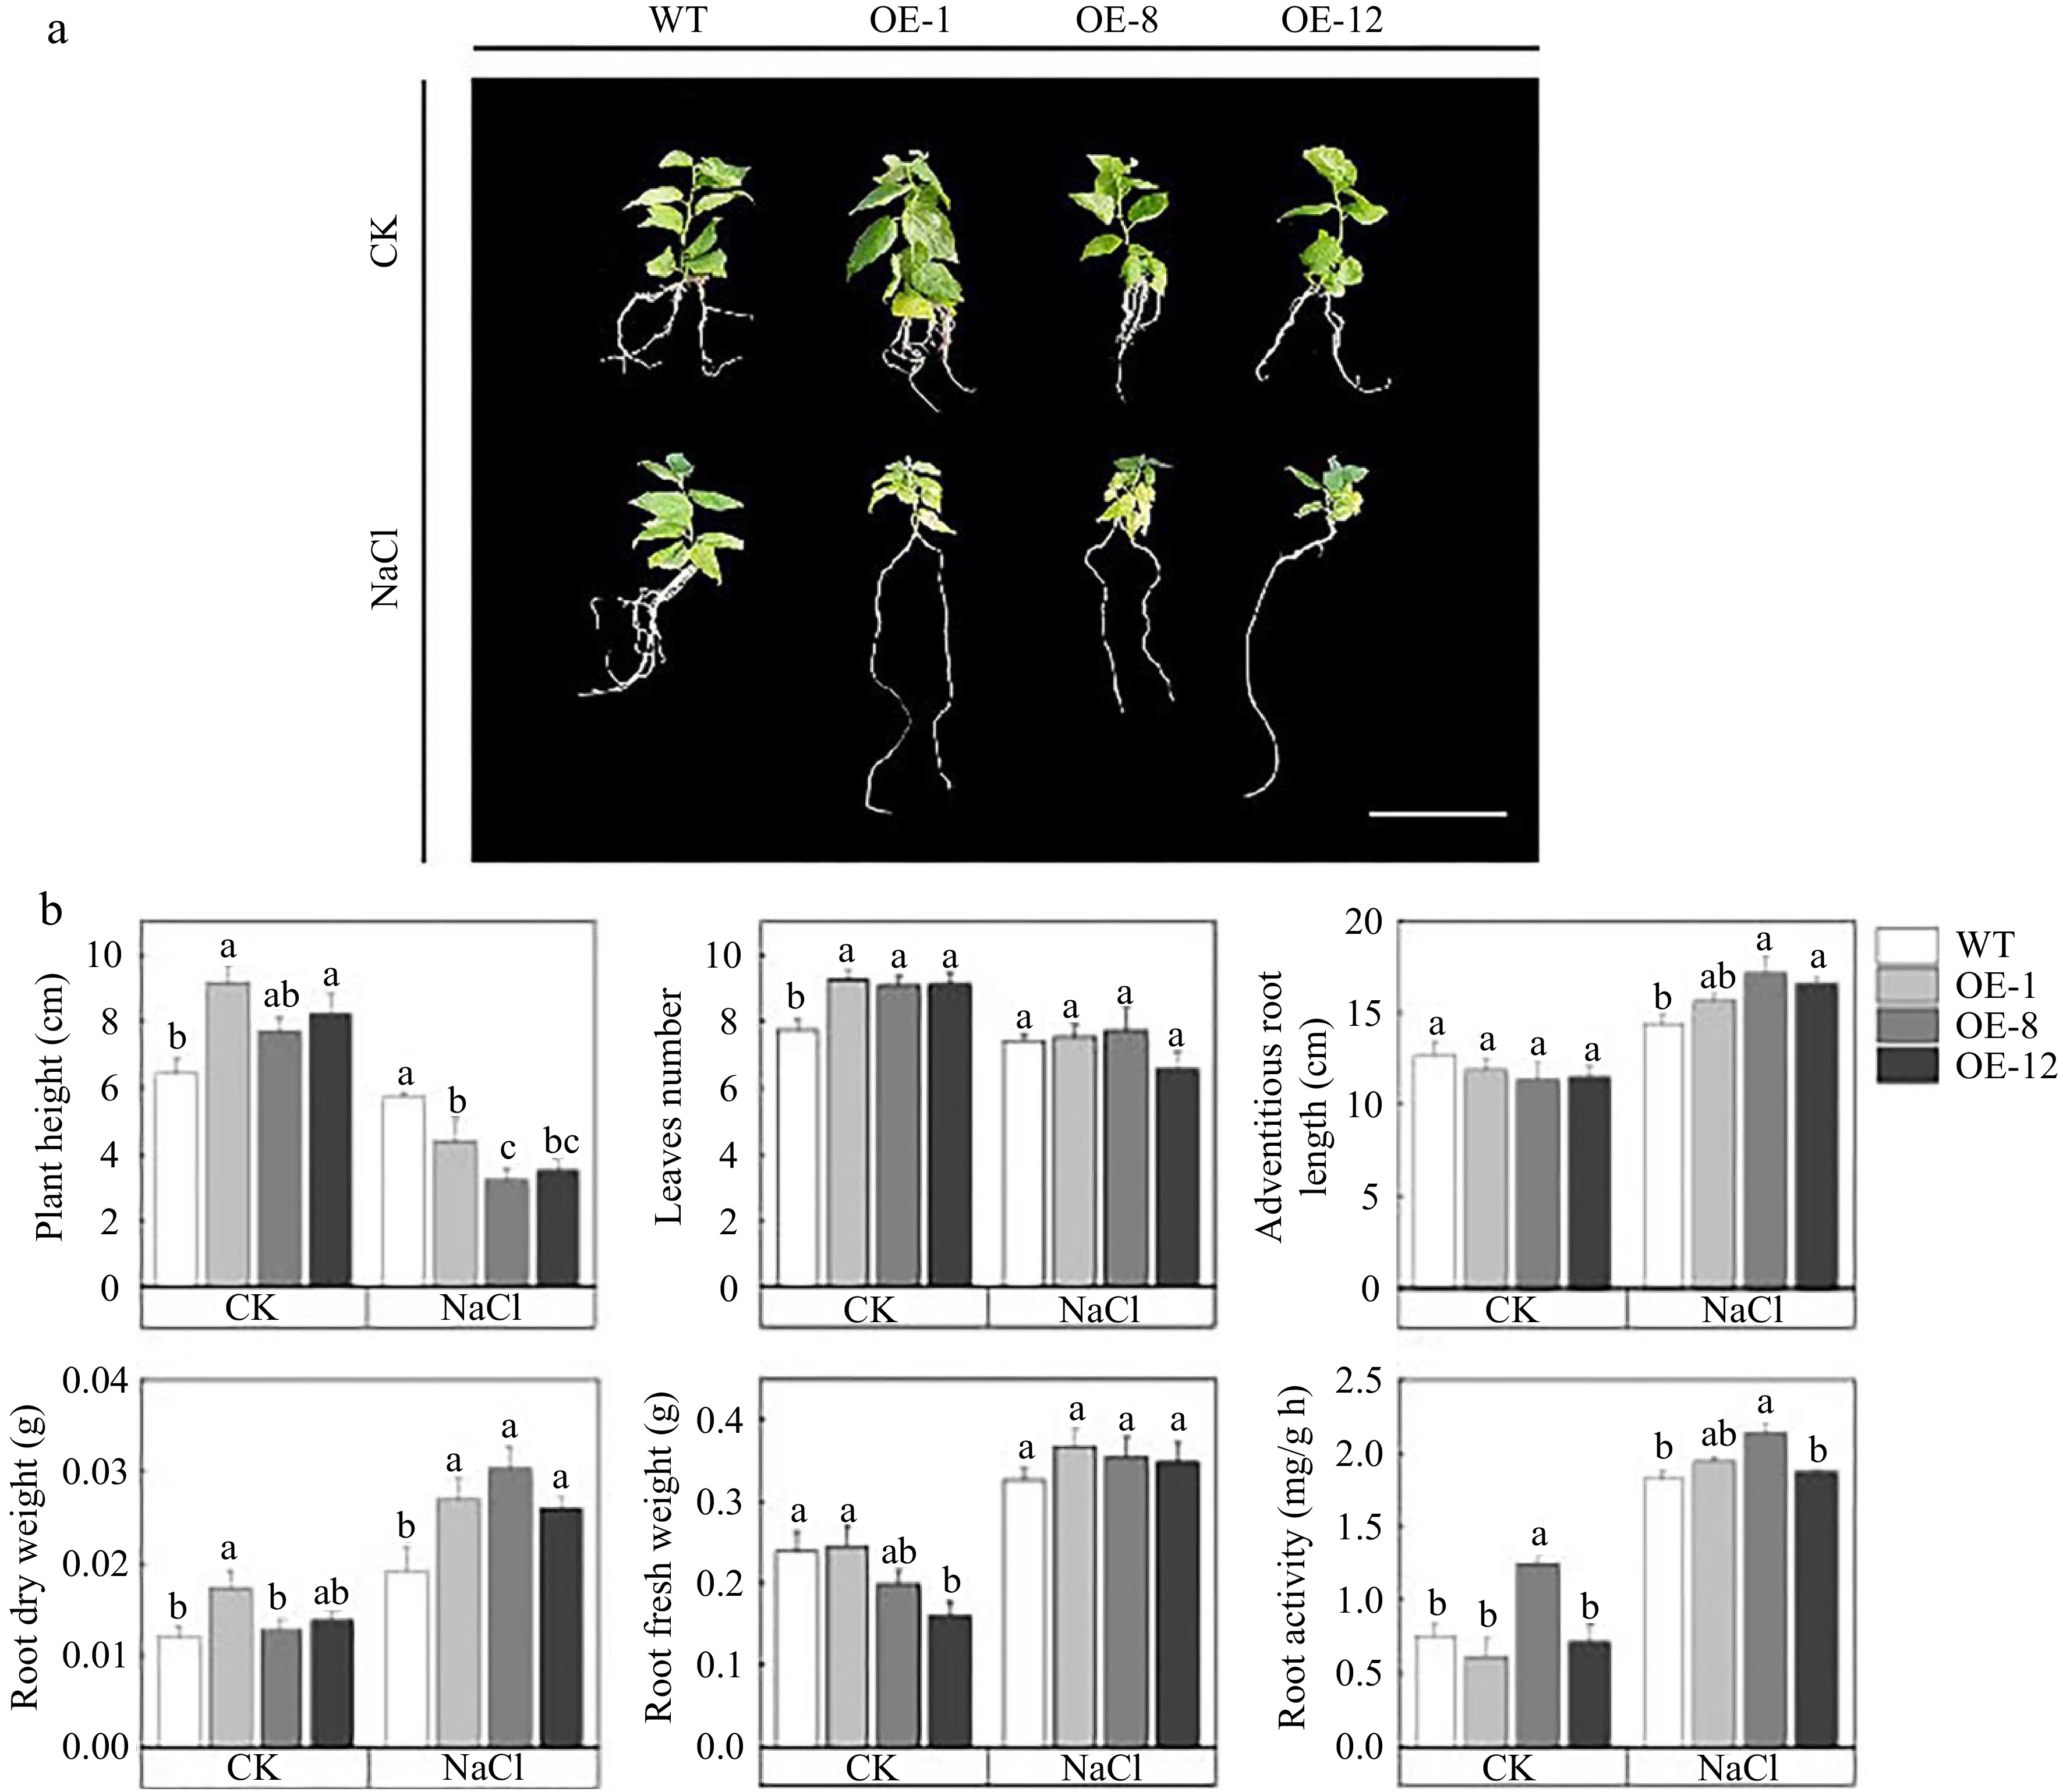
Figure 3.
PagMYB73A promoted adventitious root elongation under salt stress conditions. (a) The morphology of OE and WT, Bar = 2 cm. (b) Measurement of morphological parameters for OE and WT. The graph indicates the mean ± standard deviation of three plants per line. The different lowercase letters indicate significant differences among samples (p < 0.05).
-
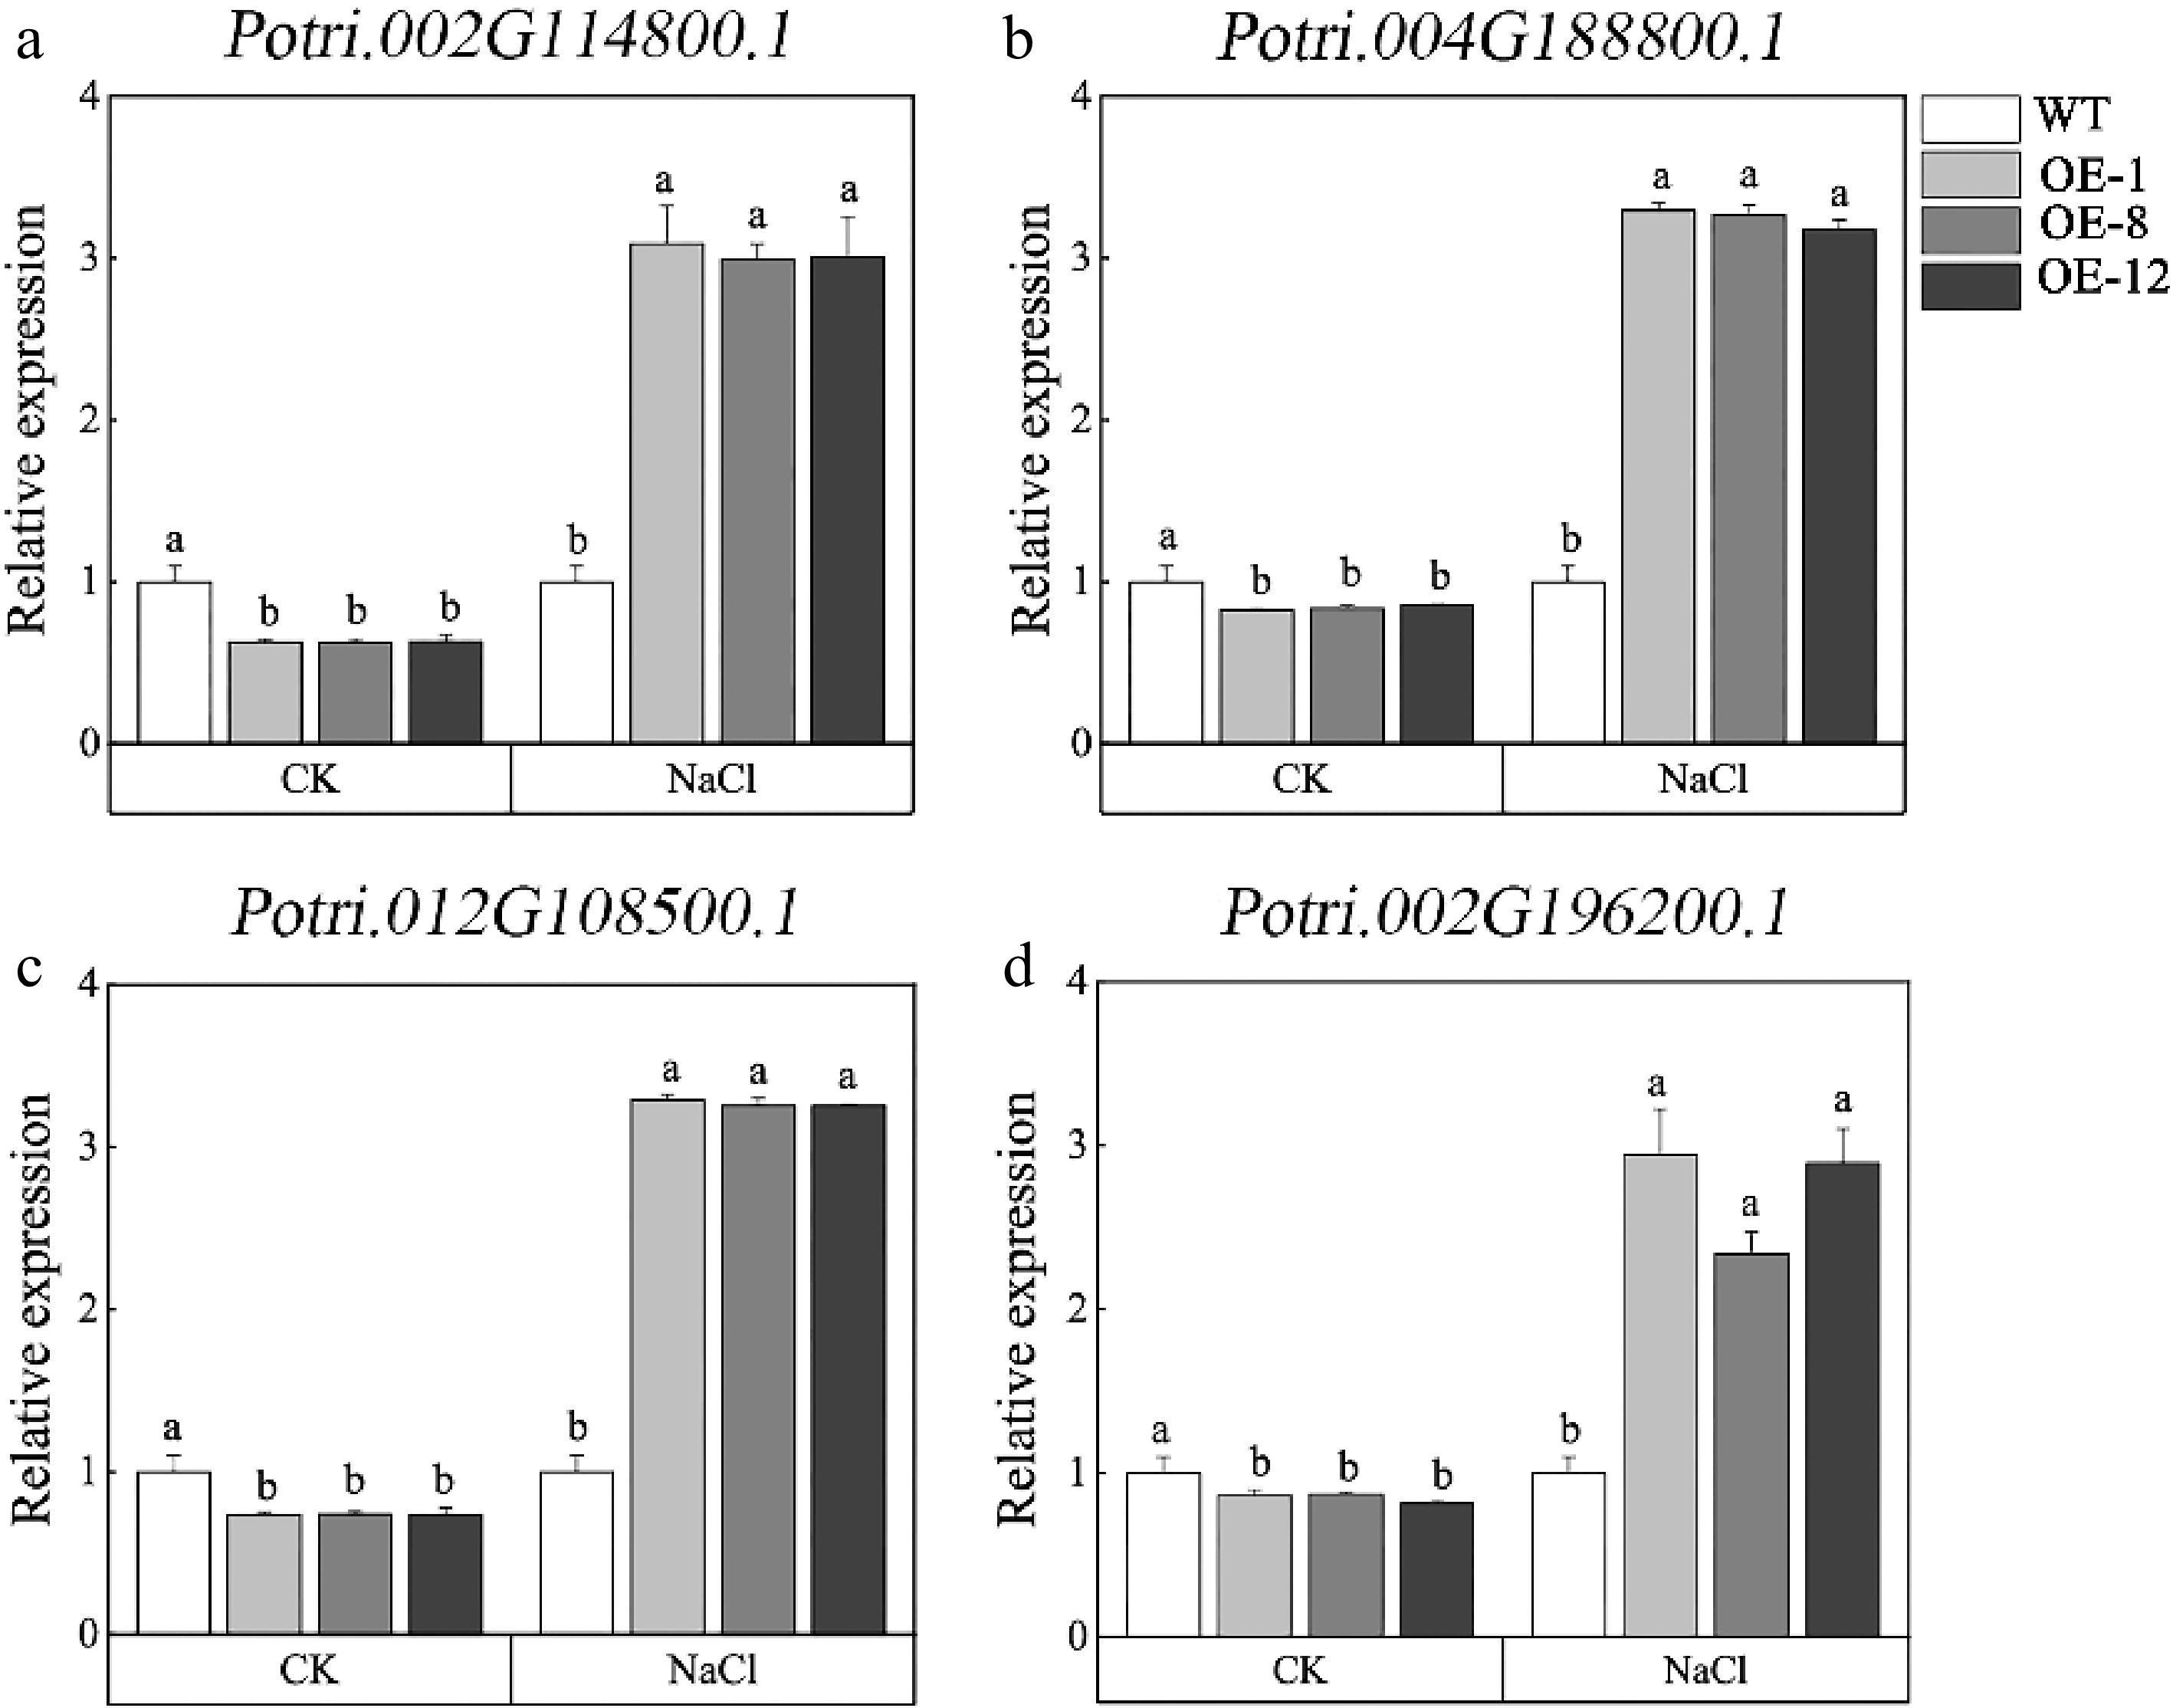
Figure 4.
Expression level of genes involved in adventitious root growth and development. The graph indicates the mean ± standard deviation of three repeats. The different lowercase letters indicate significant differences among samples (p < 0.05).
-

Figure 5.
PagMYB73A positively regulated roots growth. (a) Total root surface area, (b) total root length, (c) total root volume, (d) average root diameter, (e), (f) surface area and length of fine roots with diameter < 1.0 mm, respectively. The graph indicates the mean ± standard deviation of three plants per line. The different lowercase letters indicate significant differences among samples (p < 0.05).
-

Figure 6.
PagMYB73A maintains stomata density. (a) Stomata morphology of the 2nd mature leaf, Bar = 20 μm. (b), (c) Statistical analysis of stomatal density and width. The graph indicates the mean ± standard deviation of three plants per line. The different lowercase letters indicate significant differences among samples (p < 0.05).
-
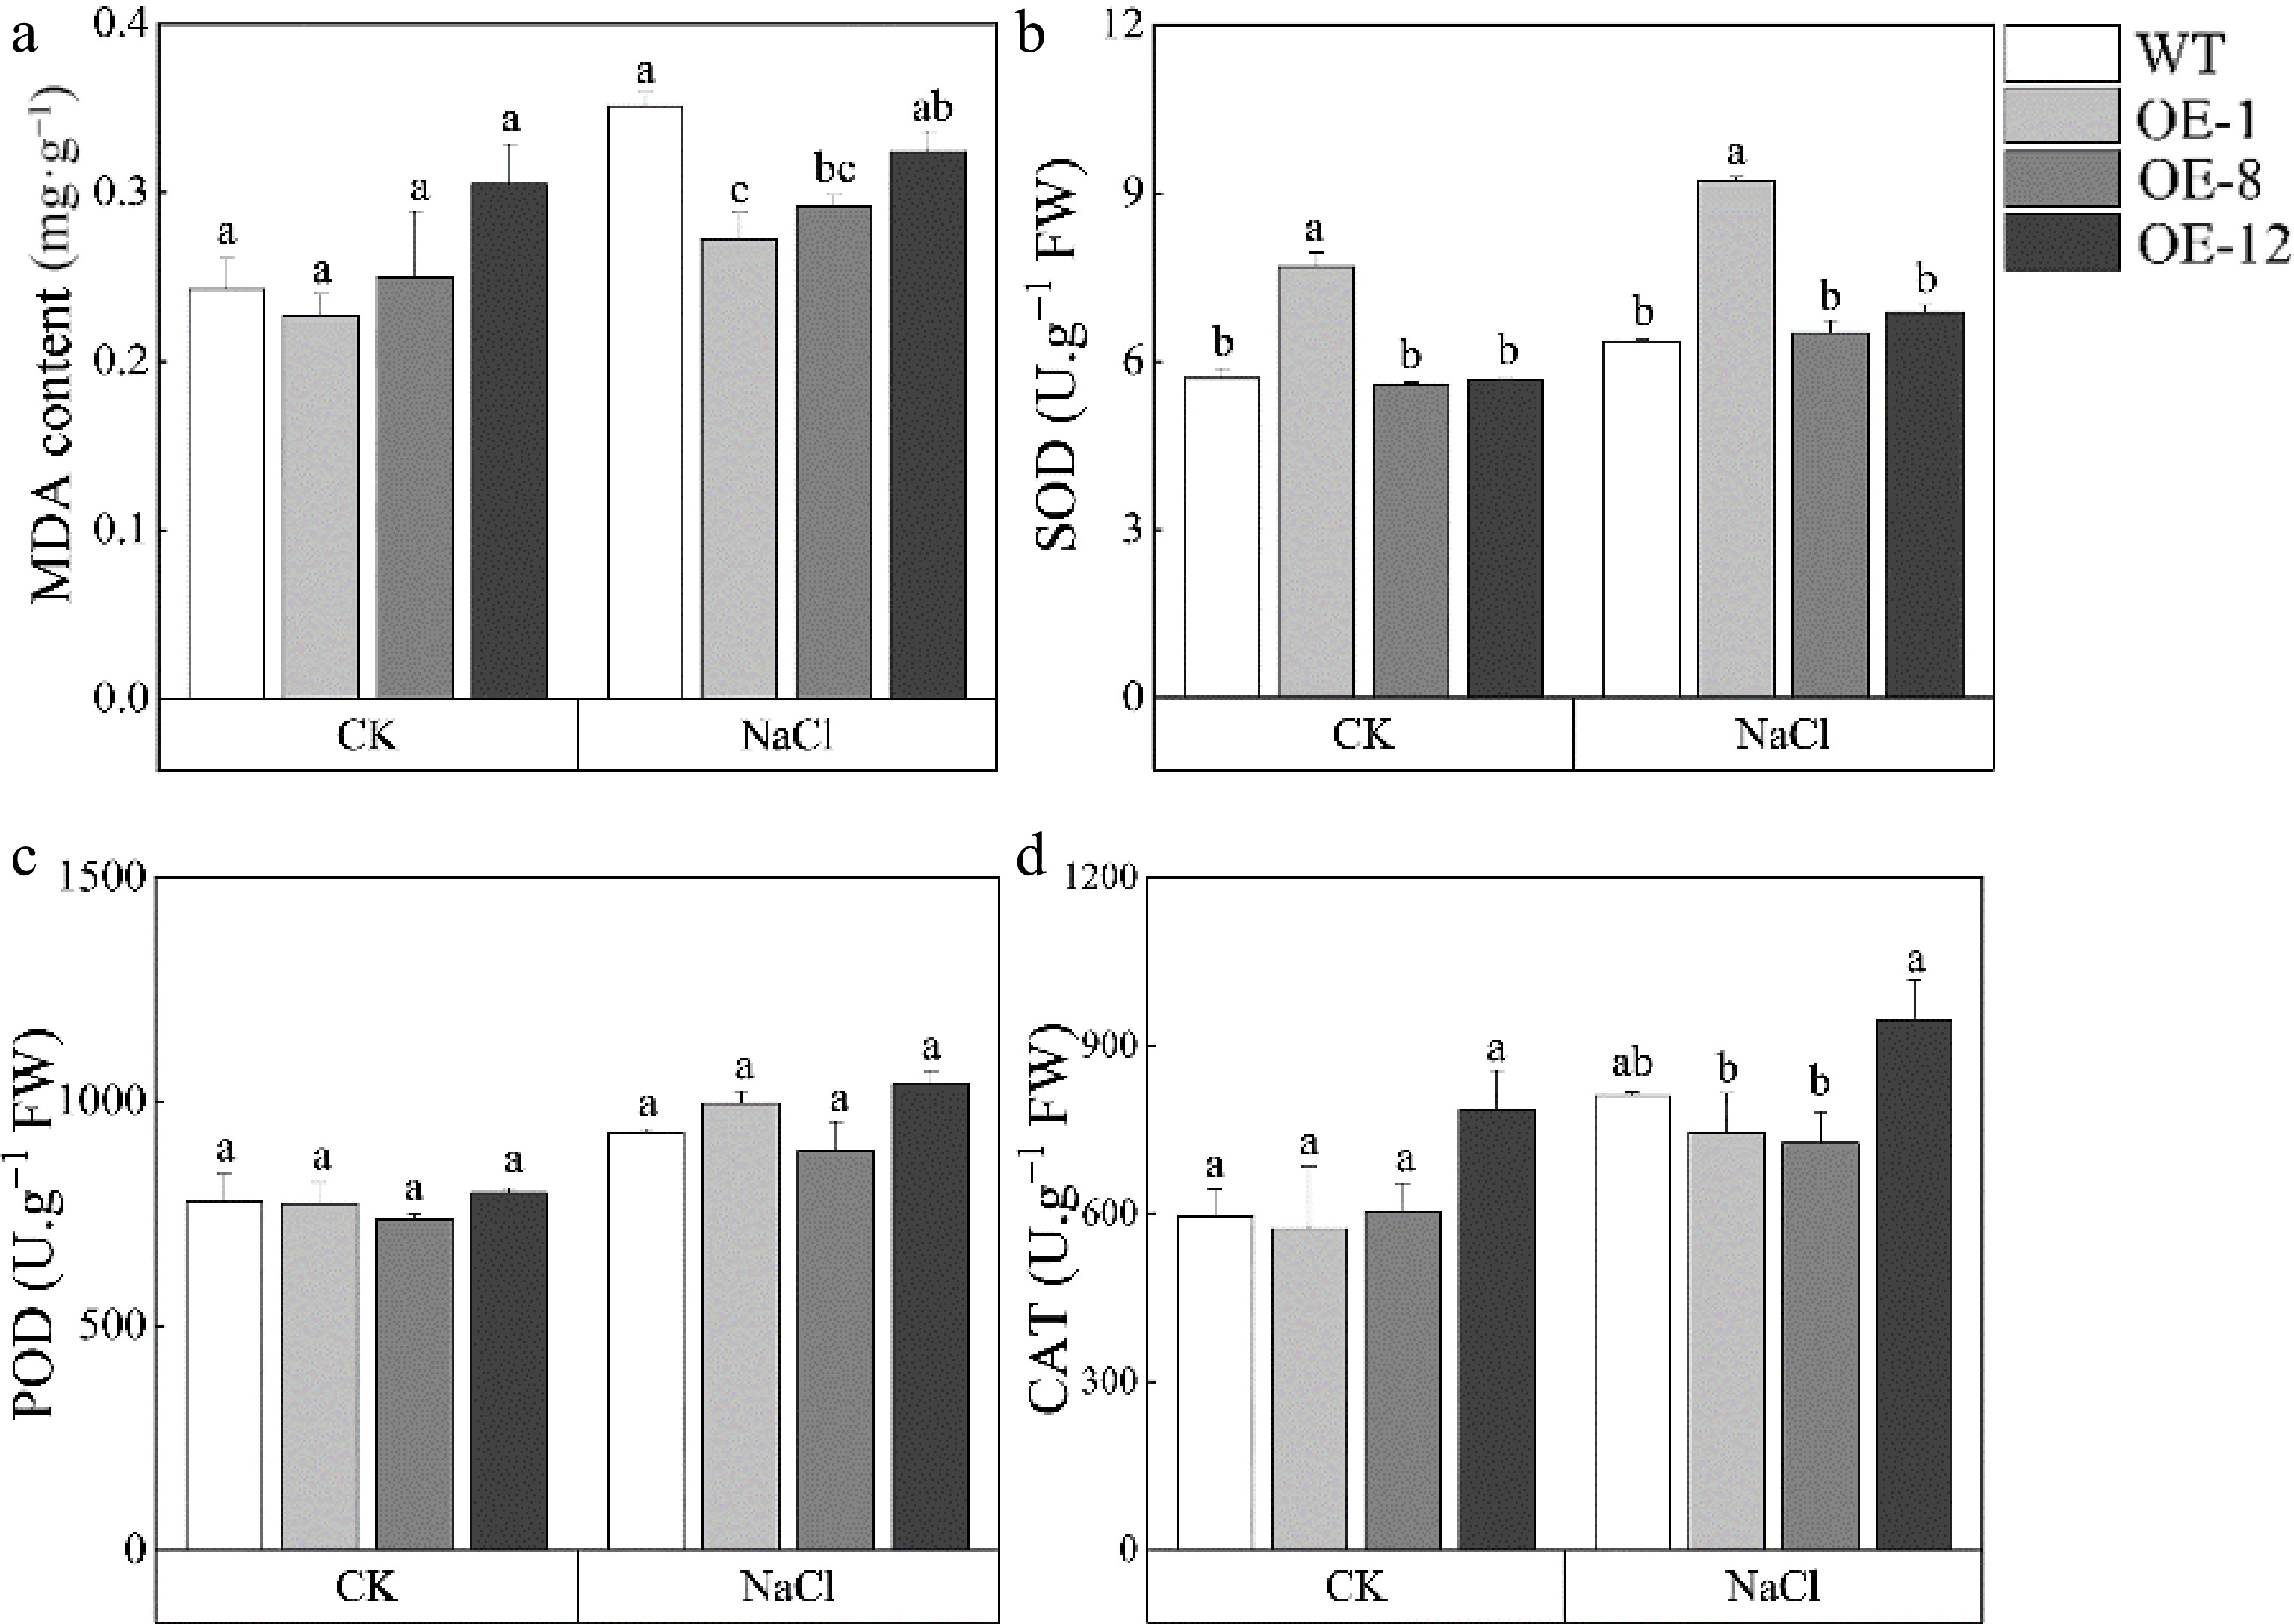
Figure 7.
MDA content and antioxidant enzyme activity of PagMYB73A overexpression transgenic poplar. The graph indicates the mean ± standard deviation of three repeats. The different lowercase letters indicate significant differences among samples (p < 0.05).
-

Figure 8.
Function model of PagMYB73A enhancing salt tolerance of 84K poplar. When subjected to salt stress, PagMYB73A promoted adventitious root growth at the expense of plant height and reduced the MDA content of the poplar as well as maintained stomatal density.
Figures
(8)
Tables
(0)