-
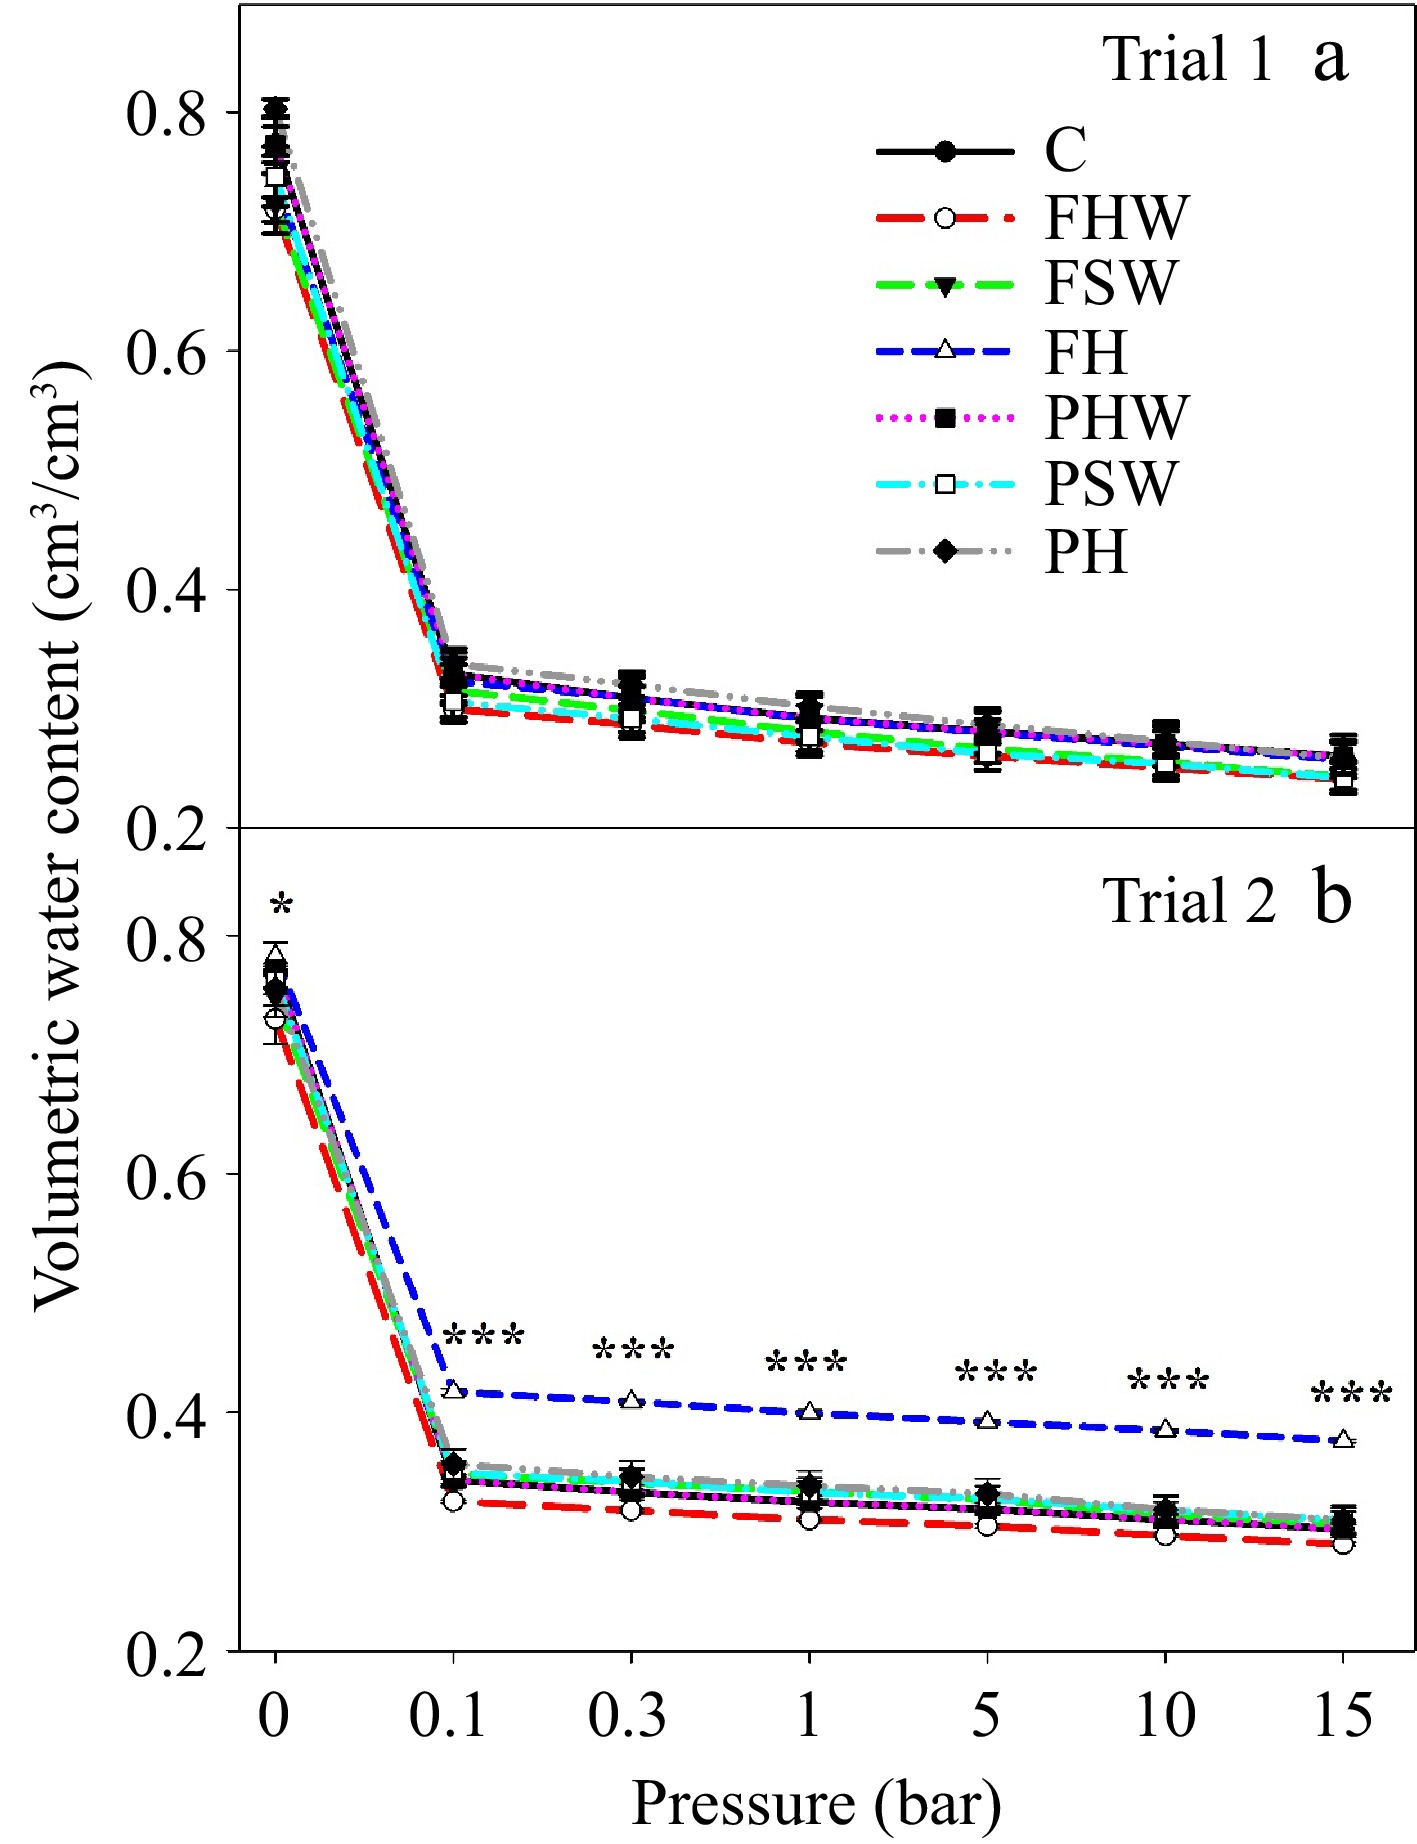
Figure 1.
Water retention curve of different media in (a) Trial 1 and (b) Trial 2. The pressures applied (-ve) were 0, 0.1, 0.3, 1, 5, 10, and 15 bar. Bars in the graph indicate the standard error. * and *** indicate significant differences at a p ≤ 0.05 and p ≤ 0.001 level of significance, respectively. C: Control, FHW: Full hardwood, FSW: Full softwood, FH: Full hemp, PHW: Partial hardwood, PSW: Partial softwood, PH: Partial hemp.
-
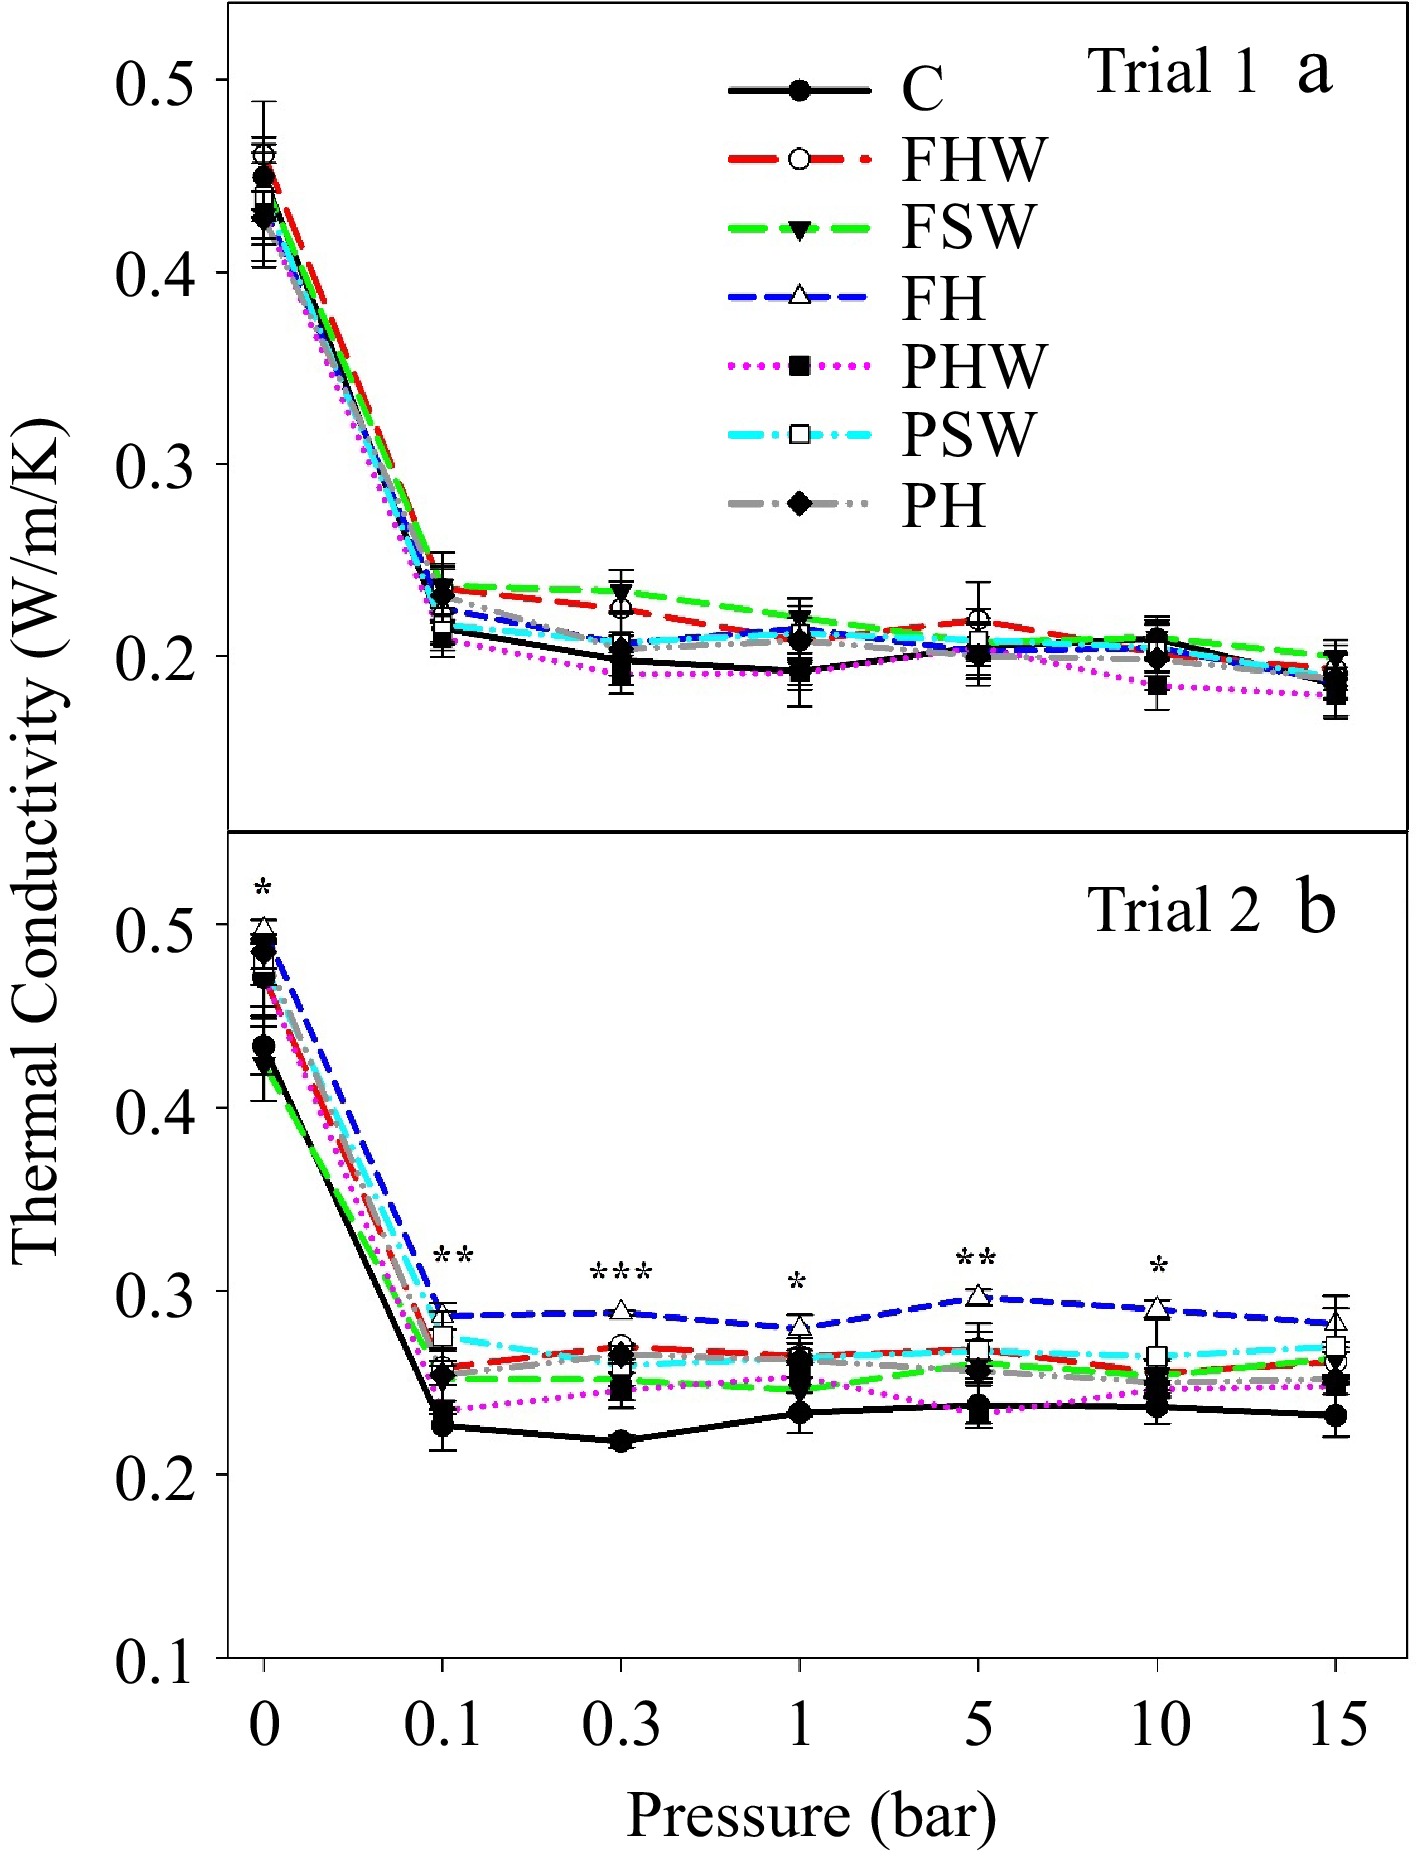
Figure 2.
Thermal conductivity (W/m/K) of different media in (a) Trial 1 and (b) Trial 2. The pressures applied (-ve) were 0, 0.1, 0.3, 1, 5, 10, and 15 bar. Bars in the graph indicate the standard error and *, **, *** indicate significant differences at a p ≤ 0.05, p ≤ 0.01, and p ≤ 0.001 level of significance, respectively. C: Control, FHW: Full hardwood, FSW: Full softwood, FH: Full hemp, PHW: Partial hardwood, PSW: Partial softwood, PH: Partial hemp.
-
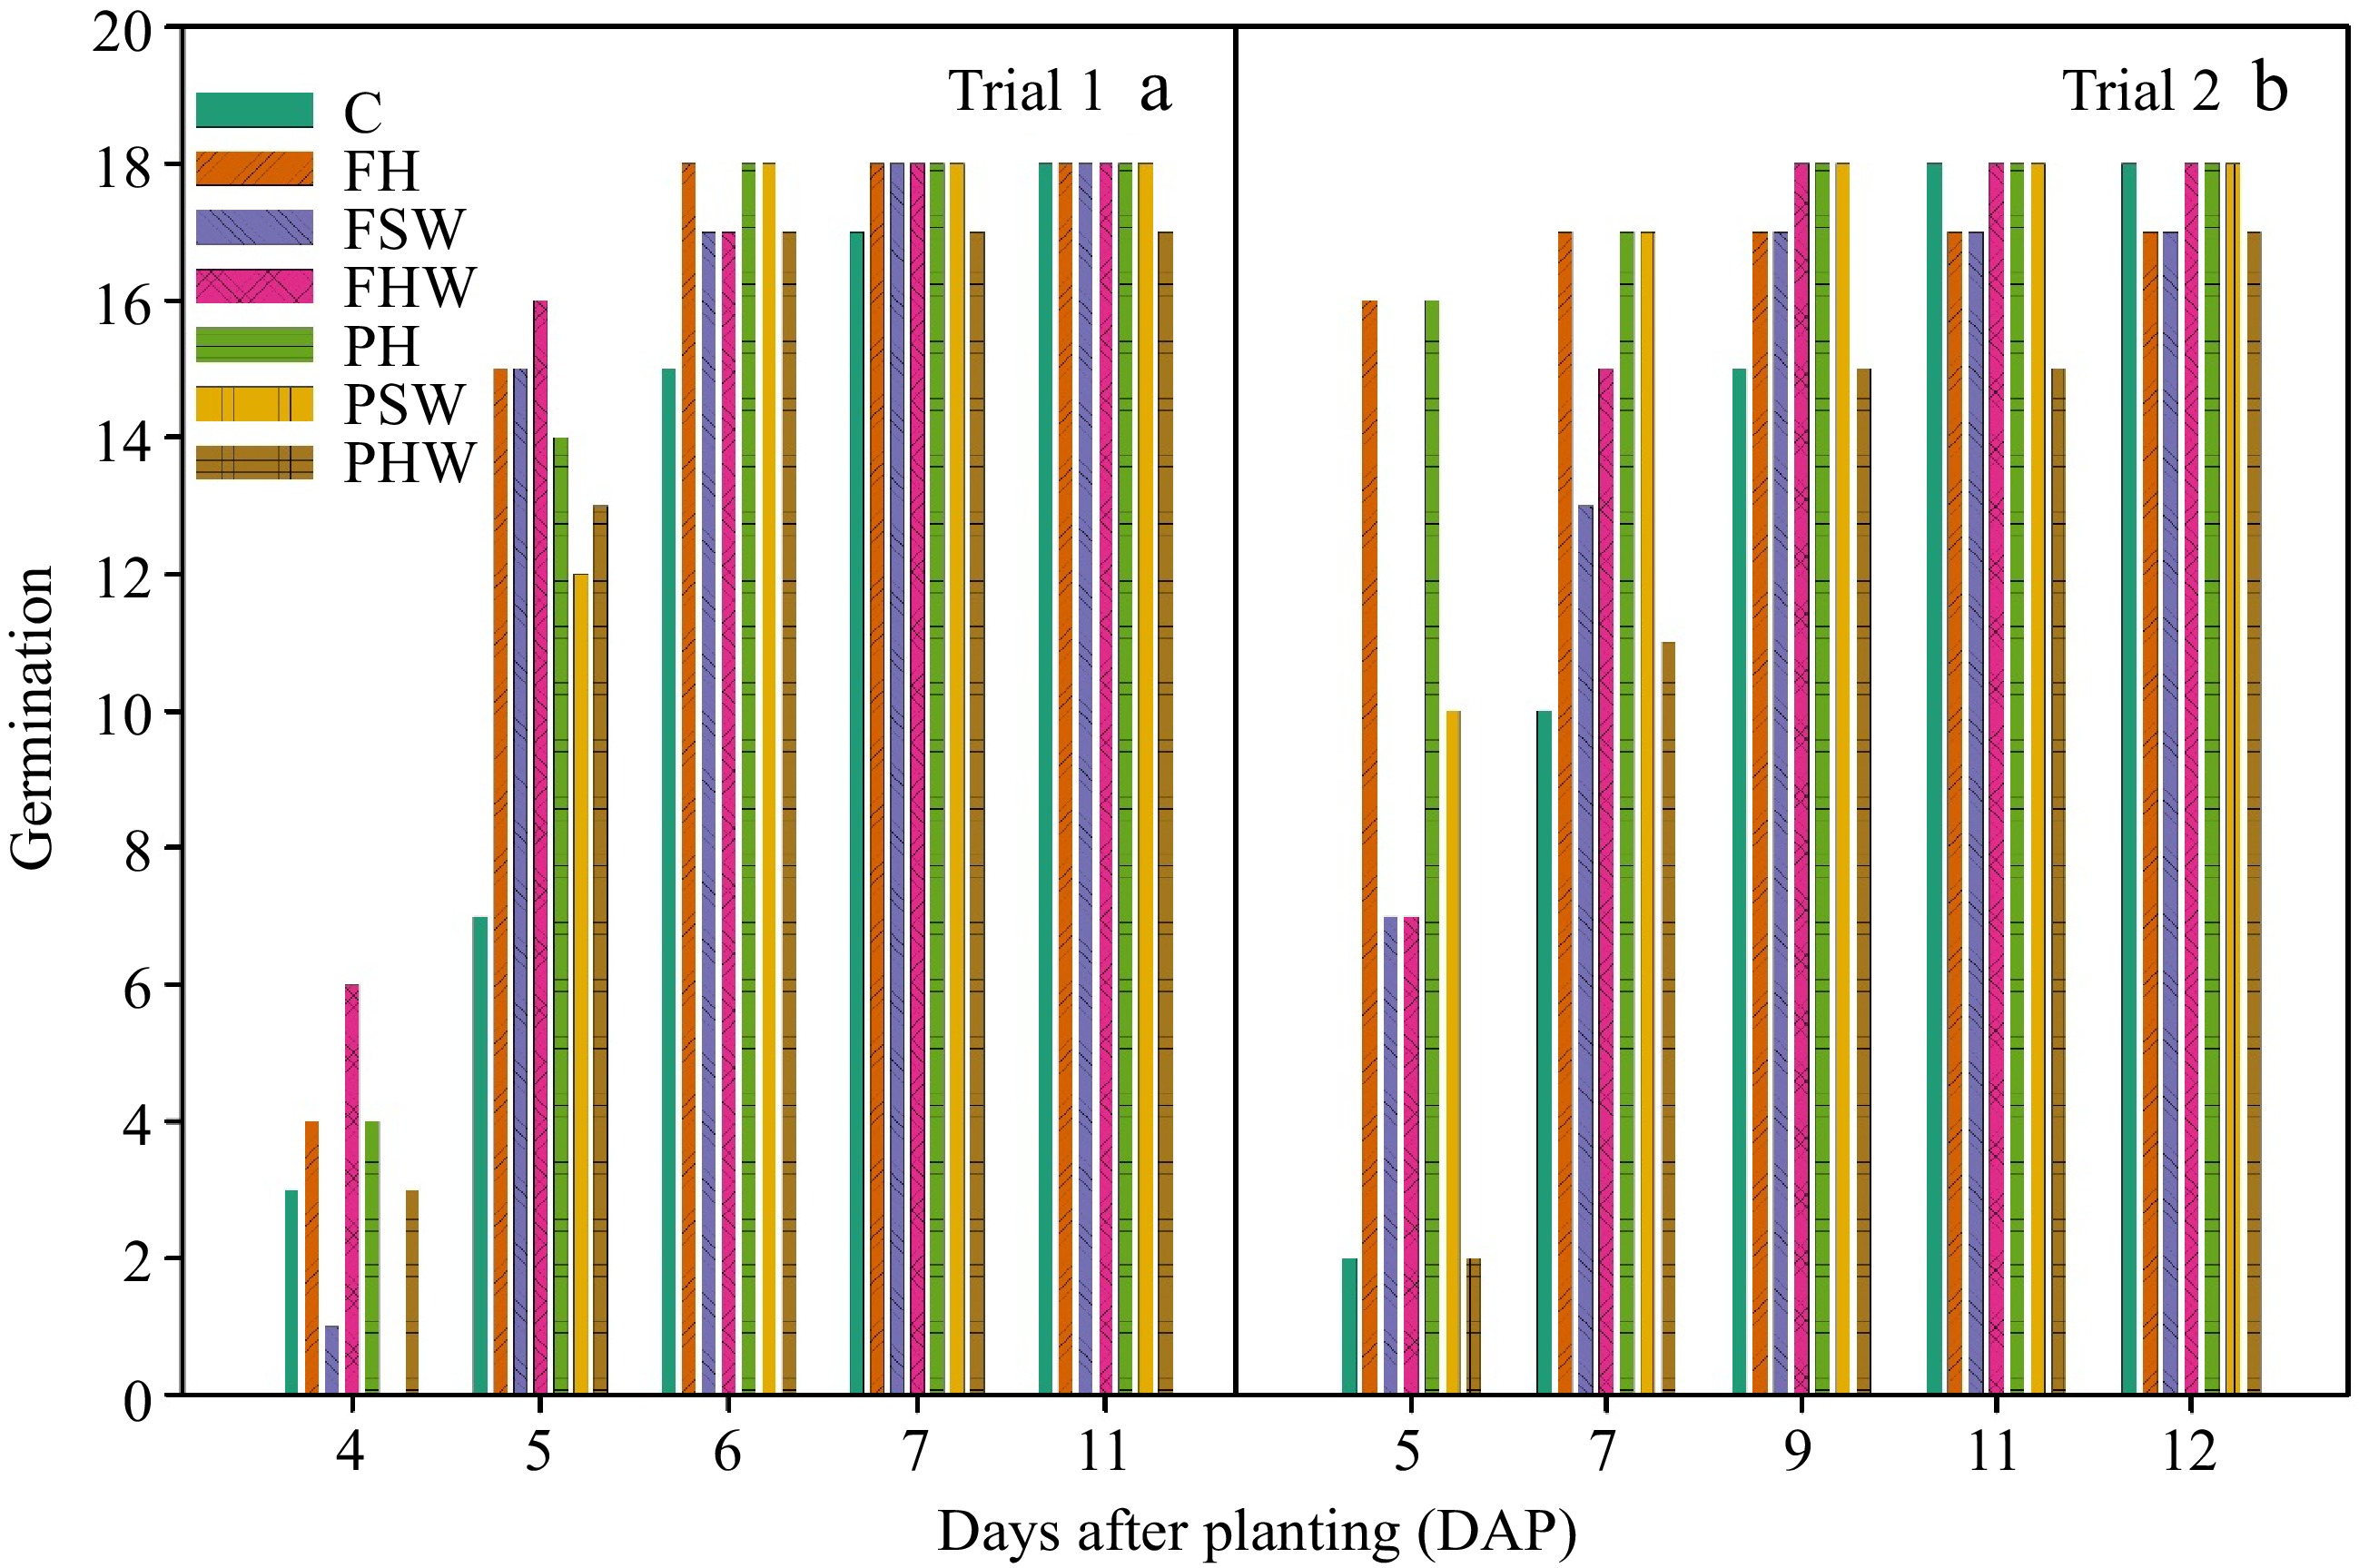
Figure 3.
Germination counts of cucumber seeds in (a) Trial 1 and (b) Trial 2. Germination count was recorded at 4, 5, 6, 7, and 11 DAP in Trial 1 and 5, 7, 9, 11, and 12 DAP in Trial 2. C: Control, FHW: Full hardwood, FSW: Full softwood, FH: Full hemp, PHW: Partial hardwood, PSW: Partial softwood, PH: Partial hemp.
-
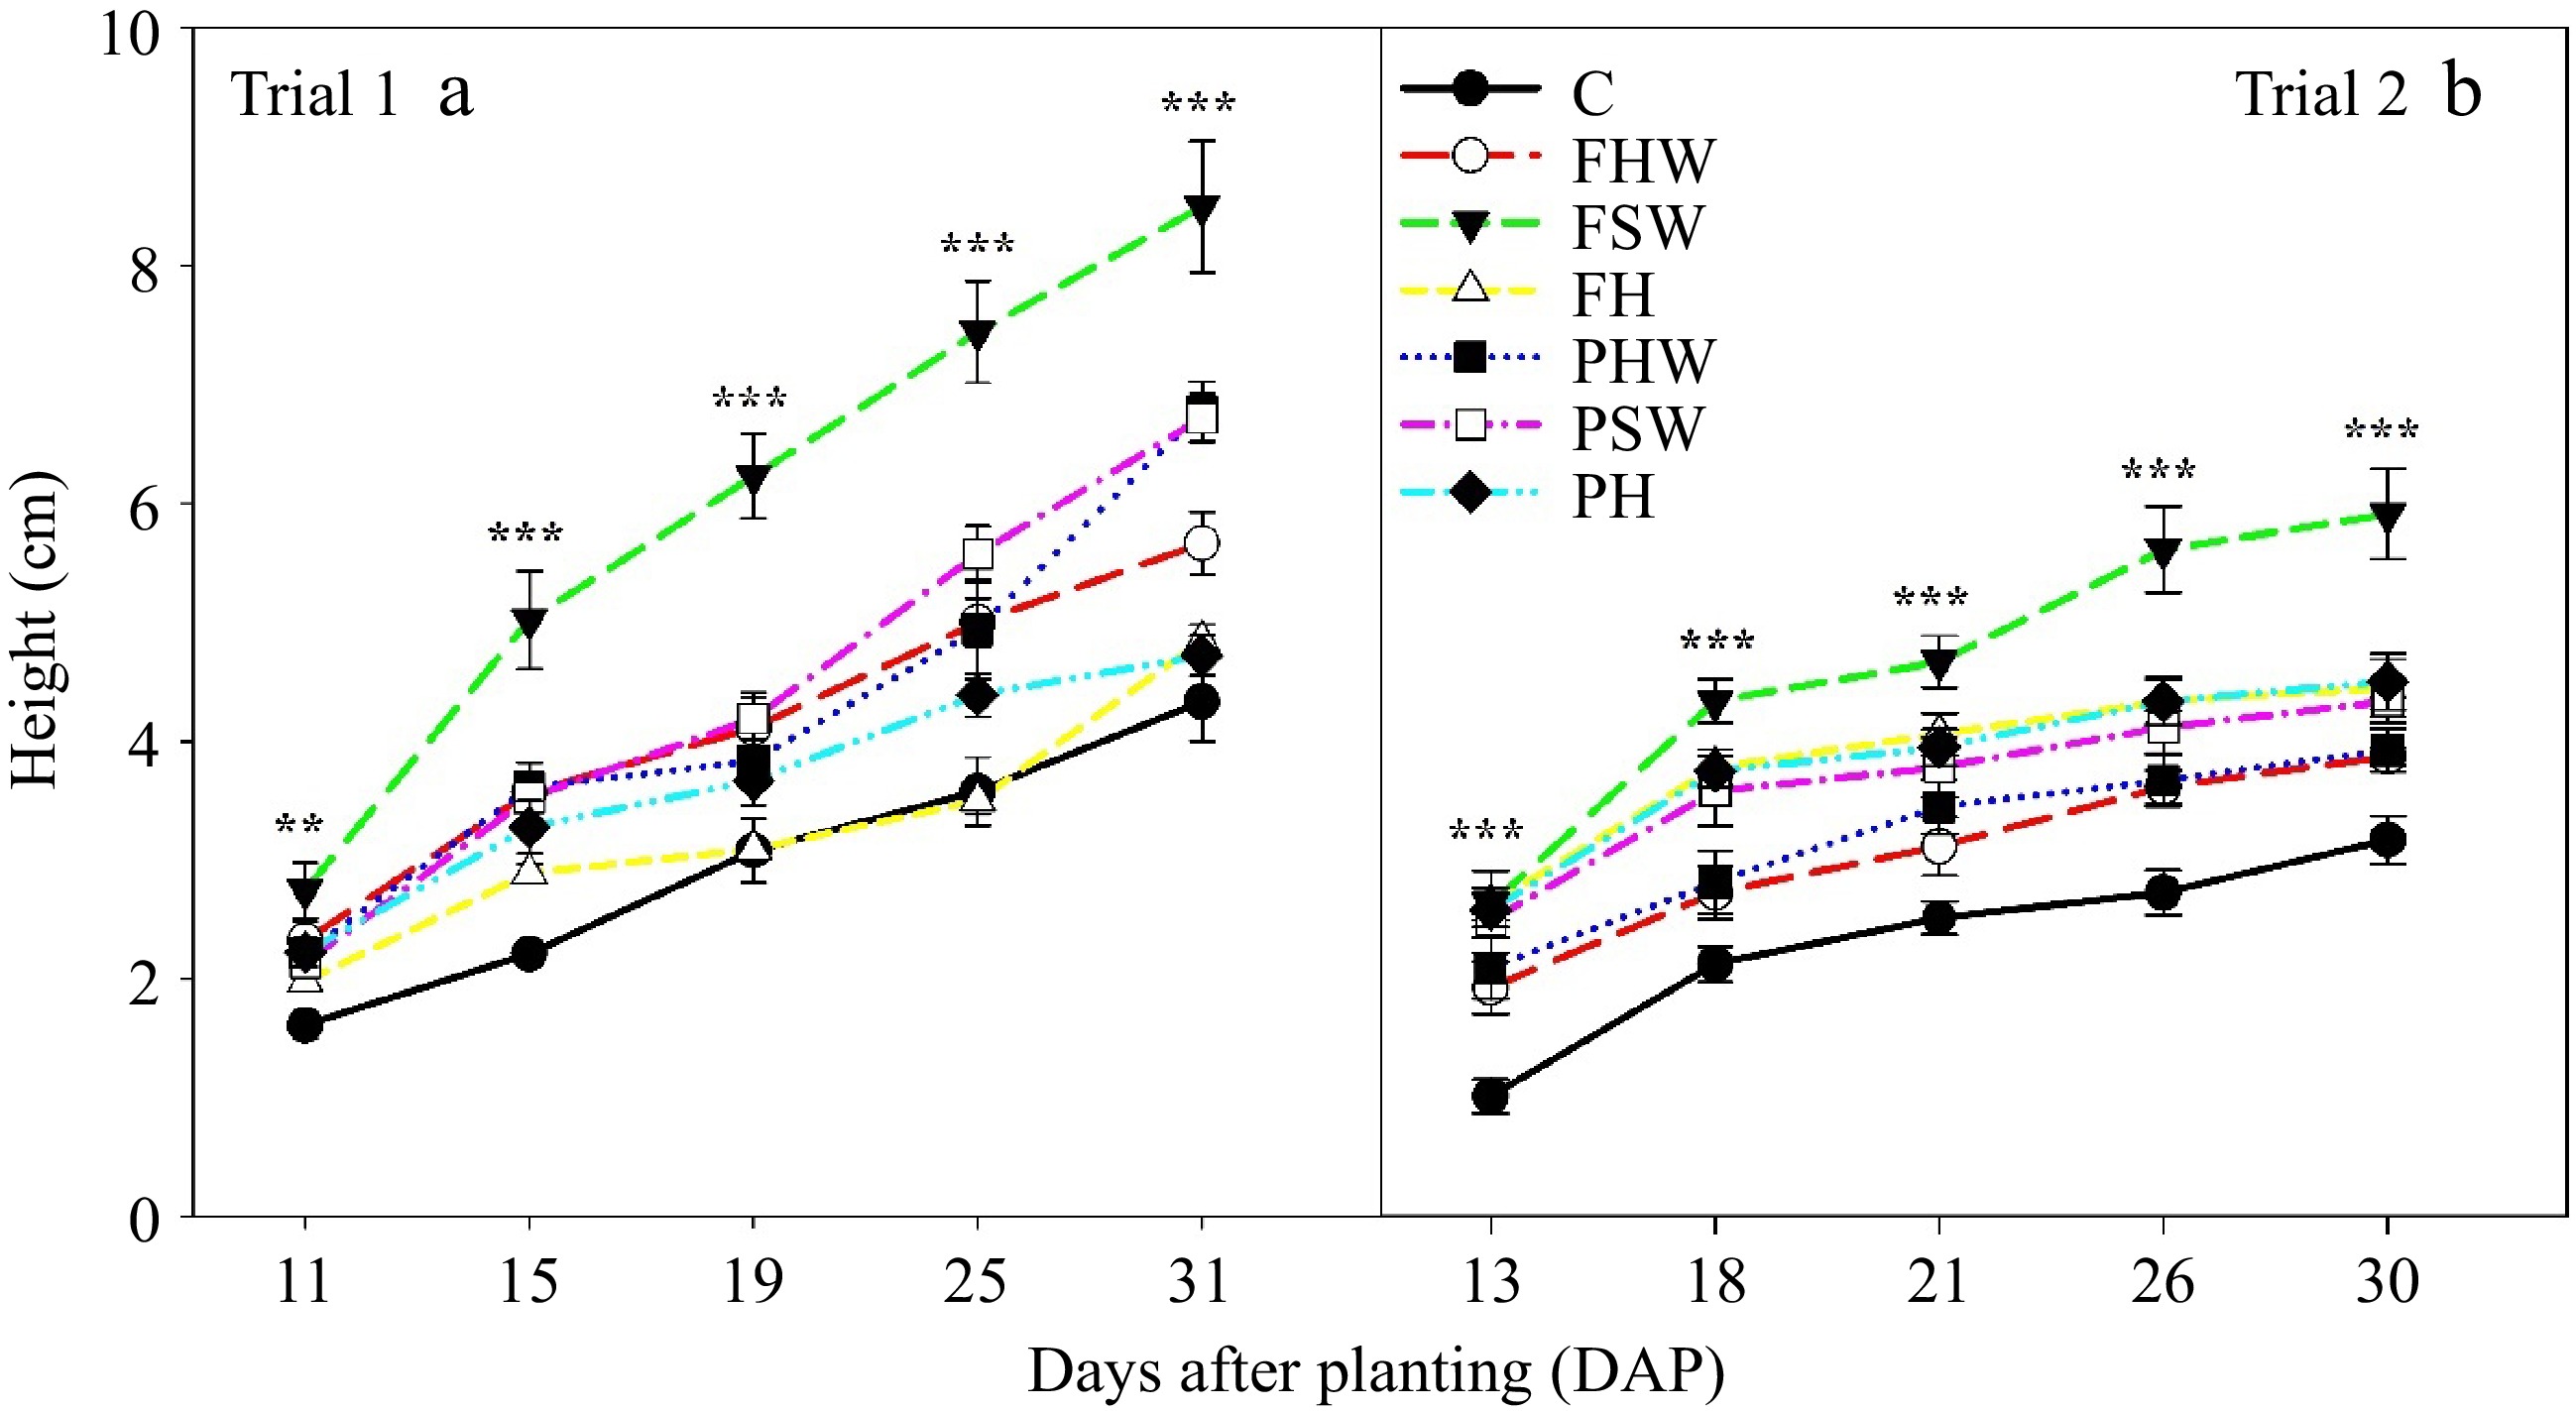
Figure 4.
Cucumber seedling height in (a) Trial 1 and (b) Trial 2. Bars in the graph indicate the standard error. ** and *** indicate significant differences at a p ≤ 0.01 and p ≤ 0.001 level of significance, respectively. C: Control, FHW: Full hardwood, FSW: Full softwood, FH: Full hemp, PHW: Partial hardwood, PSW: Partial softwood, PH: Partial hemp.
-
Soilless media type pH EC (dS/m) C 5.2 0.178 PHW 7.9 0.378 PSW 7.8 0.38 PH 8.7 0.74 FHW 9.0 0.592 FSW 8.3 0.612 FH 9.4 1.078 C: Control, FHW: Full hardwood, FSW: Full softwood, FH: Full hemp, PHW: Partial hardwood, PSW: Partial softwood, PH: Partial hemp. Table 1.
The pH and EC of different media treatments used in greenhouse cucumber experiments at Lubbock, TX, USA in 2022.
-
Trial Media Fresh shoot weight (g) No. of leaves Leaf area (cm2) Shoot:Root Trial 1 C 0.82c* 3.00d 11.88c 0.30c FHW 1.85bc 4.16ab 23.26bc 0.41bc FSW 4.77a 4.66a 69.07a 0.55a FH 1.54bc 3.66bc 17.97bc 0.35c PHW 1.68bc 4.00b 22.48bc 0.48ab PSW 2.15b 4.00b 30.29b 0.39bc PH 1.38bc 3.16cd 16.70bc 0.37bc Trial 2 C 0.56b 3.00b 8.36b 0.19d FHW 1.26b 3.00b 16.07b 0.30bc FSW 3.52a 4.33a 54.60a 0.36ab FH 1.55b 3.16b 17.08b 0.41a PHW 1.16b 3.00b 16.77b 0.26cd PSW 1.40b 3.16b 22.02b 0.34abc PH 1.20b 2.83b 15.85b 0.33bc The values represent the mean value of individual treatment in each of the trials. * The different letters in a column and s indicate a significant difference at p ≤ 0.05. C: Control, FHW: Full hardwood, FSW: Full softwood, FH: Full hemp, PHW: Partial hardwood, PSW: Partial softwood, PH: Partial hemp. Table 2.
Effect of different media types on fresh shoot weight (g), number of leaves, leaf area, and shoot:root ratio of cucumber seedlings in Trial 1 and Trial 2 in greenhouse experiment at Lubbock, TX, USA in 2022.
-
Trial Media RLD
(cm/
cm3)RSAD
(cm2/
cm3)Root classification category (% of total root length per diameter) 0.0−0.5
mm0.5−1.0
mm1−1.5
mm> 1.5
mmTrial 1 C 6.08c* 0.76c 77.22b 18.52ab 2.59d 1.66cd FHW 5.69c 0.74c 77.21b 17.47ab 2.43de 2.88ab FSW 9.69a 1.22ab 76.59bc 18.04ab 3.35bc 2.00c FH 9.88a 1.41a 73.87cd 18.20ab 4.38a 3.54a PHW 8.17ab 1.00b 78.09b 16.60b 3.13cd 2.16bc PSW 6.62bc 0.66c 84.82a 12.23c 1.73e 1.20d PH 5.38c 0.75c 73.35d 19.79a 3.98ab 2.86ab Trial 2 C 6.58bc 0.71d 83.57a 12.67d 2.05d 1.69ab FHW 6.04bc 0.88bcd 70.04cd 24.25a 3.83ab 1.86ab FSW 11.48a 1.58a 75.58b 18.04c 3.96ab 2.40a FH 5.21c 0.78cd 69.18d 24.07a 4.46a 2.28a PHW 6.80bc 0.92bcd 73.75bc 21.70ab 3.09bc 1.44b PSW 7.97b 1.09b 75.17b 19.91bc 3.24bc 1.65ab PH 7.65b 0.99bc 75.50b 20.46bc 2.72cd 1.30b The values represent the mean value of individual treatment in each of the trials. * The different letters in a column and s indicate a significant difference at p ≤ 0.05. C: Control, FHW: Full hardwood, FSW: Full softwood, FH: Full hemp, PHW: Partial hardwood, PSW: Partial softwood, PH: Partial hemp. Table 3.
Effect of different media types on root length density (RLD), root surface area density (RSAD), and root classification categories (0.0−0.5 mm, 0.5−1.0 mm, 1.0−1.5 mm, > 1.5 mm) of cucumber seedlings in Trial 1 and Trial 2 in greenhouse experiment at Lubbock, TX, USA in 2022.
Figures
(4)
Tables
(3)