-
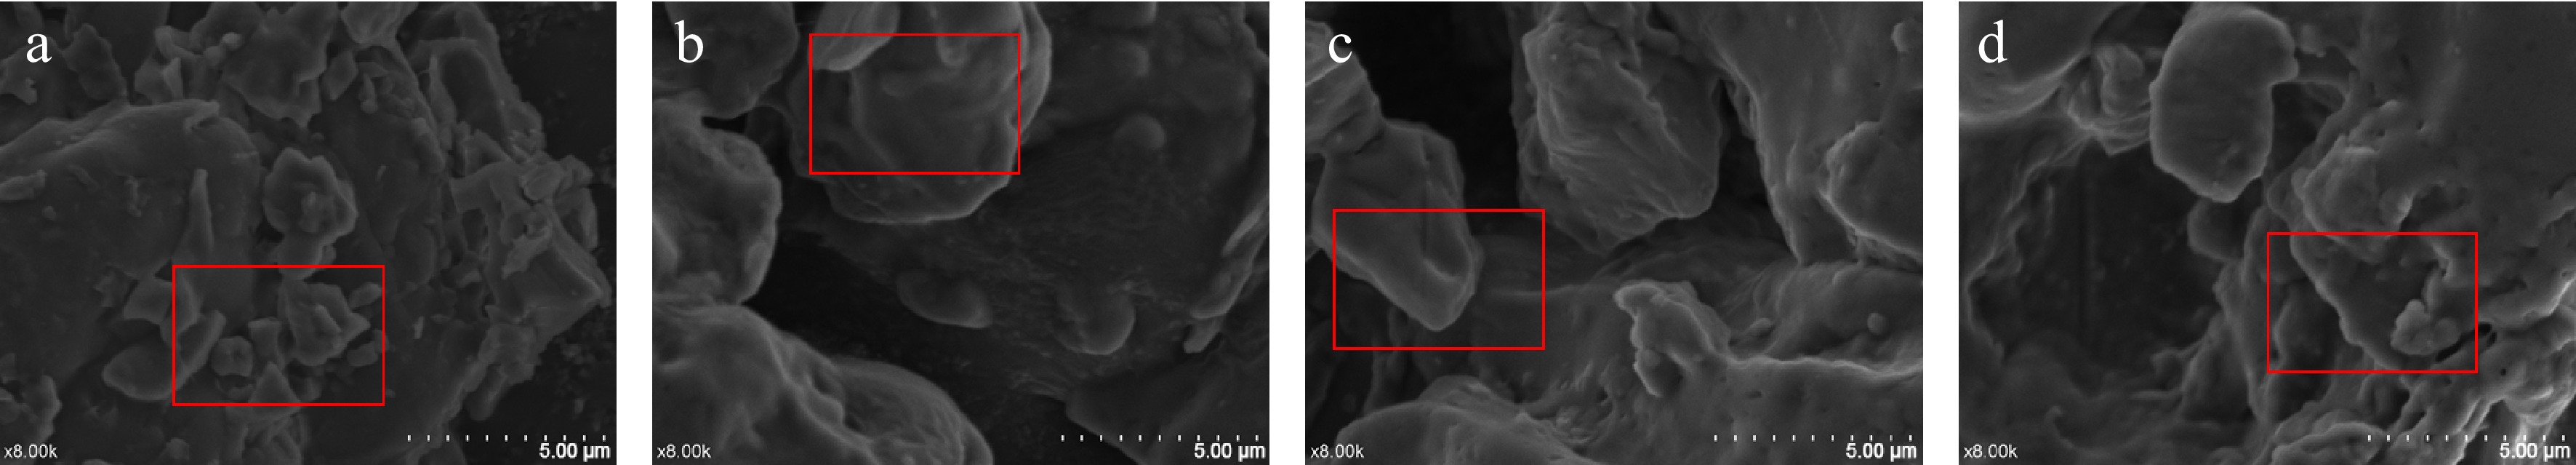
Figure 1.
Electron microscopic observation: (a) represents CK, (b) represents SPI 2%, (c) represents SPI 3%, and (d) represents SPI 4%.
-
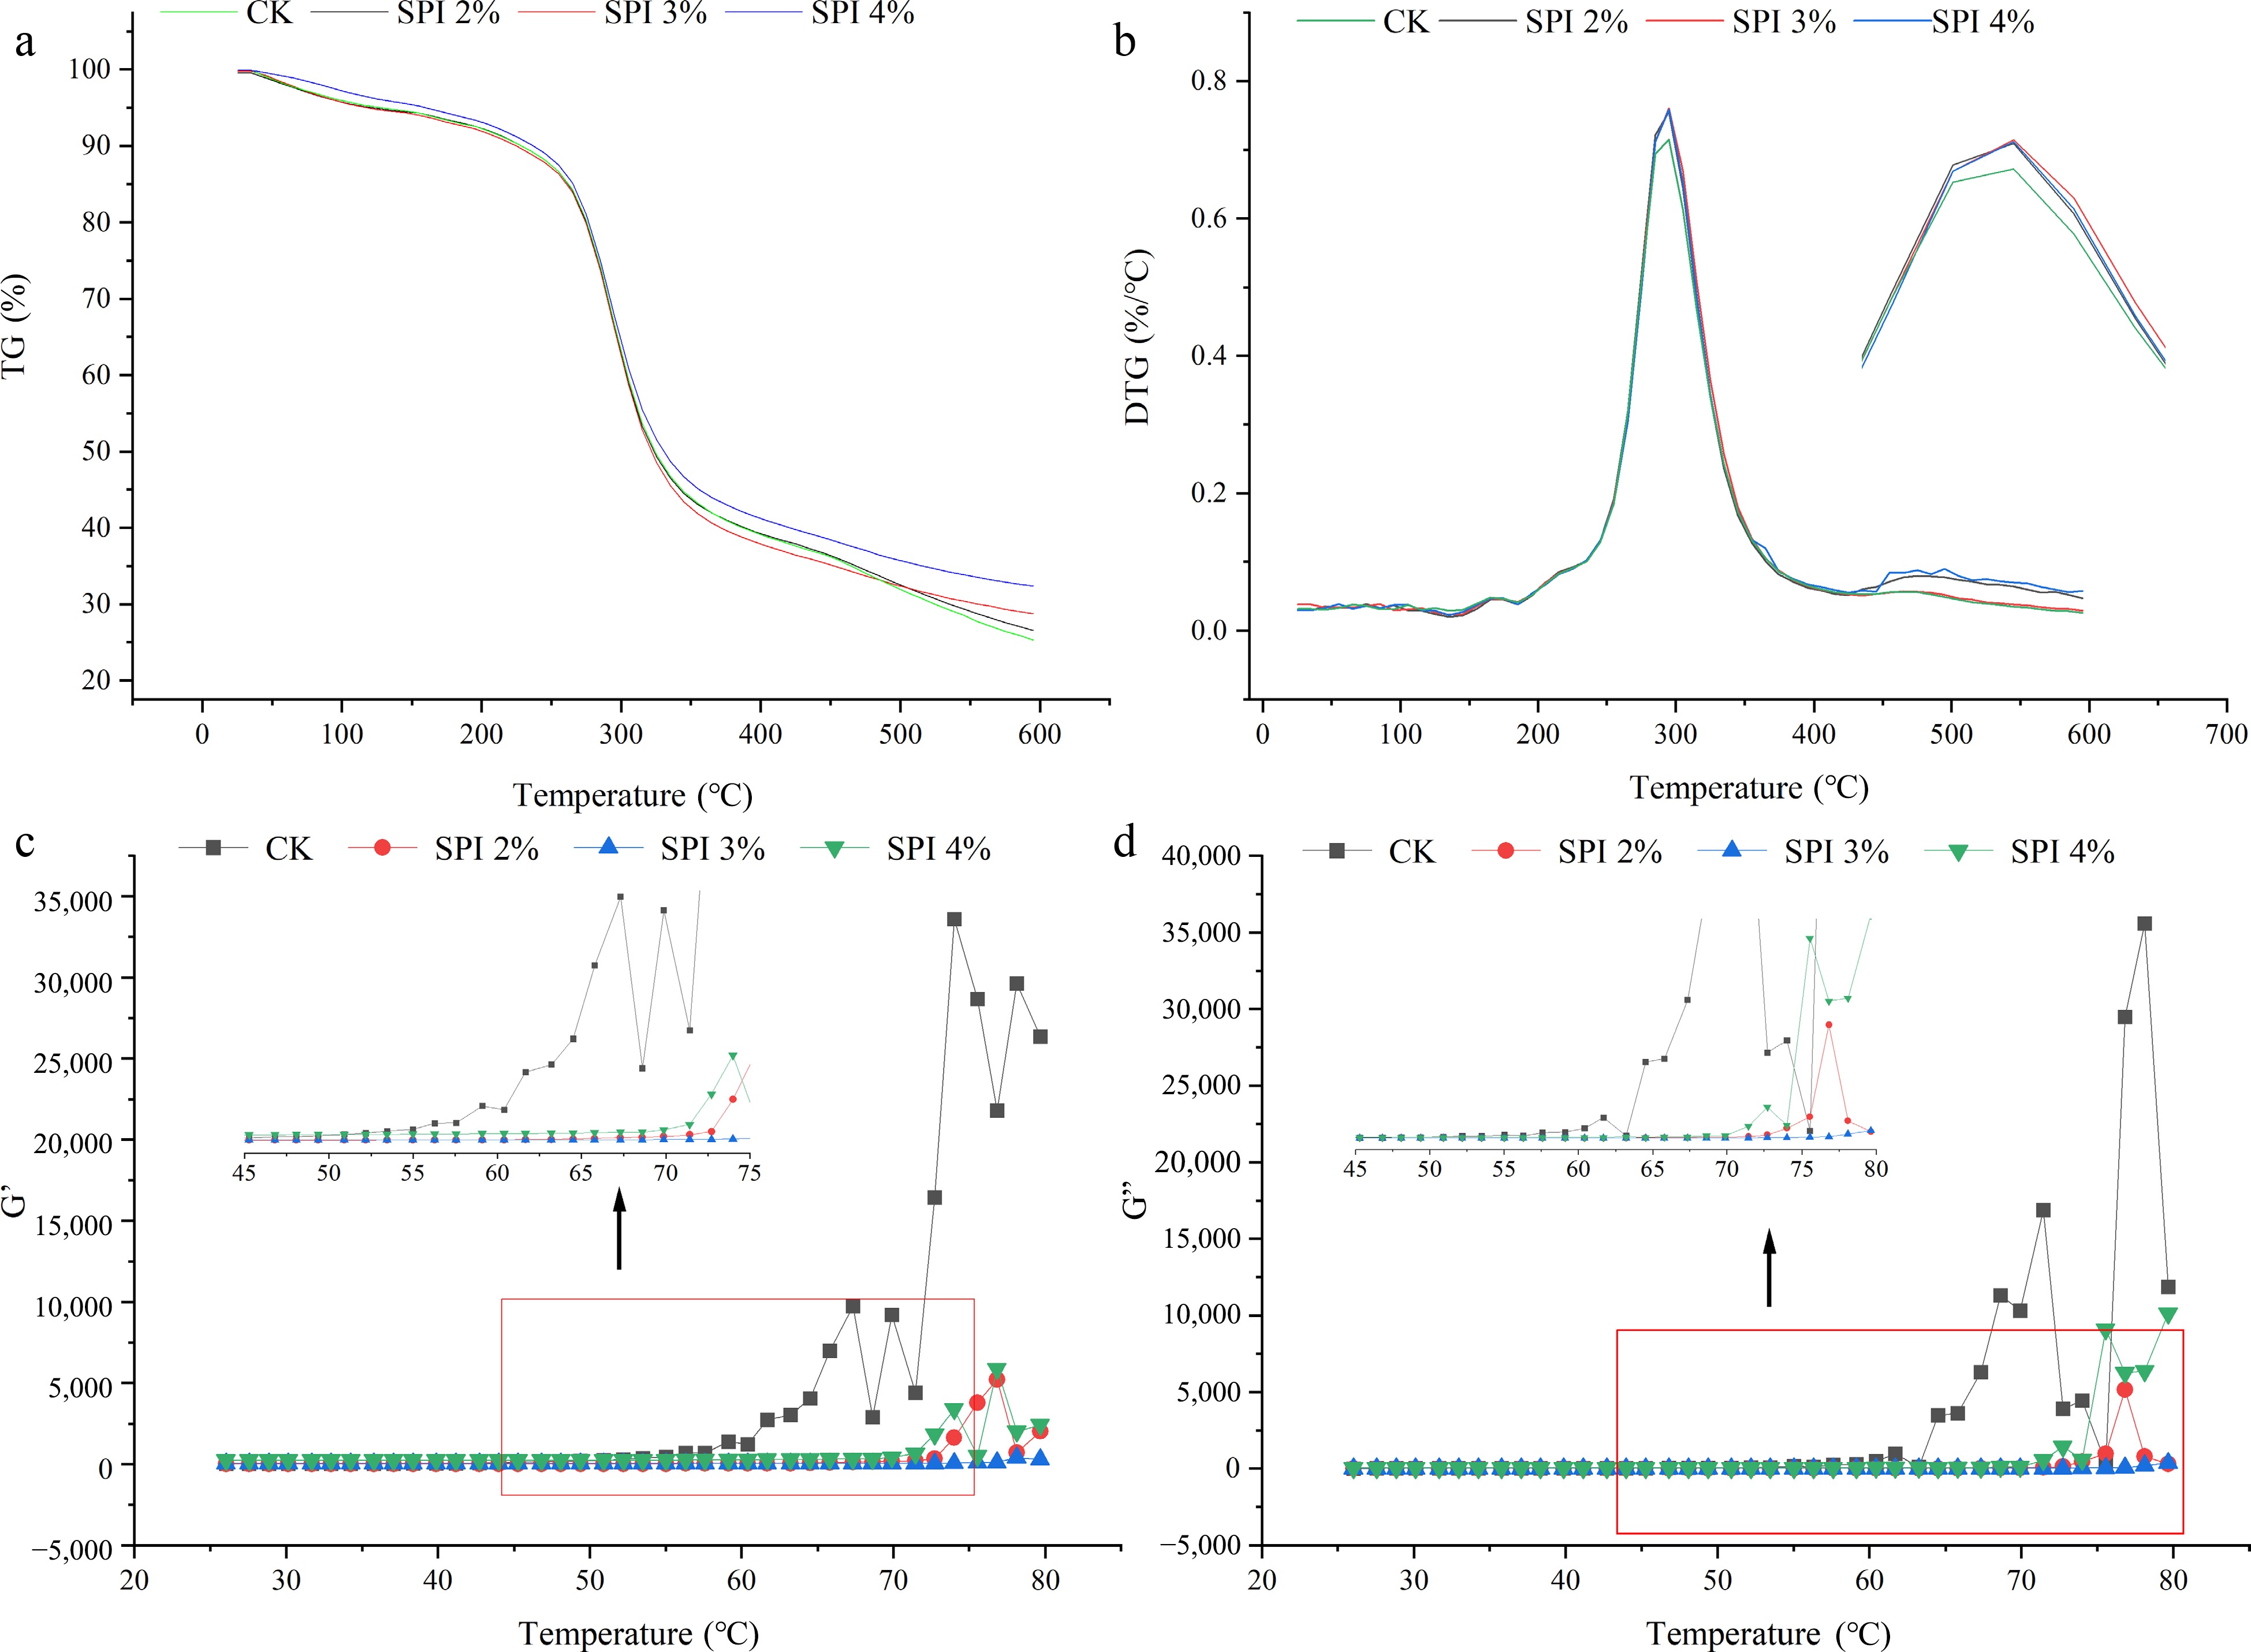
Figure 2.
Thermal properties and rheological properties of soybean protein isolate on FER: (a) TG curve; (b) DTG curve; (c) Storage modulus (G') curve; (d) Loss modulus (G") curve.
-
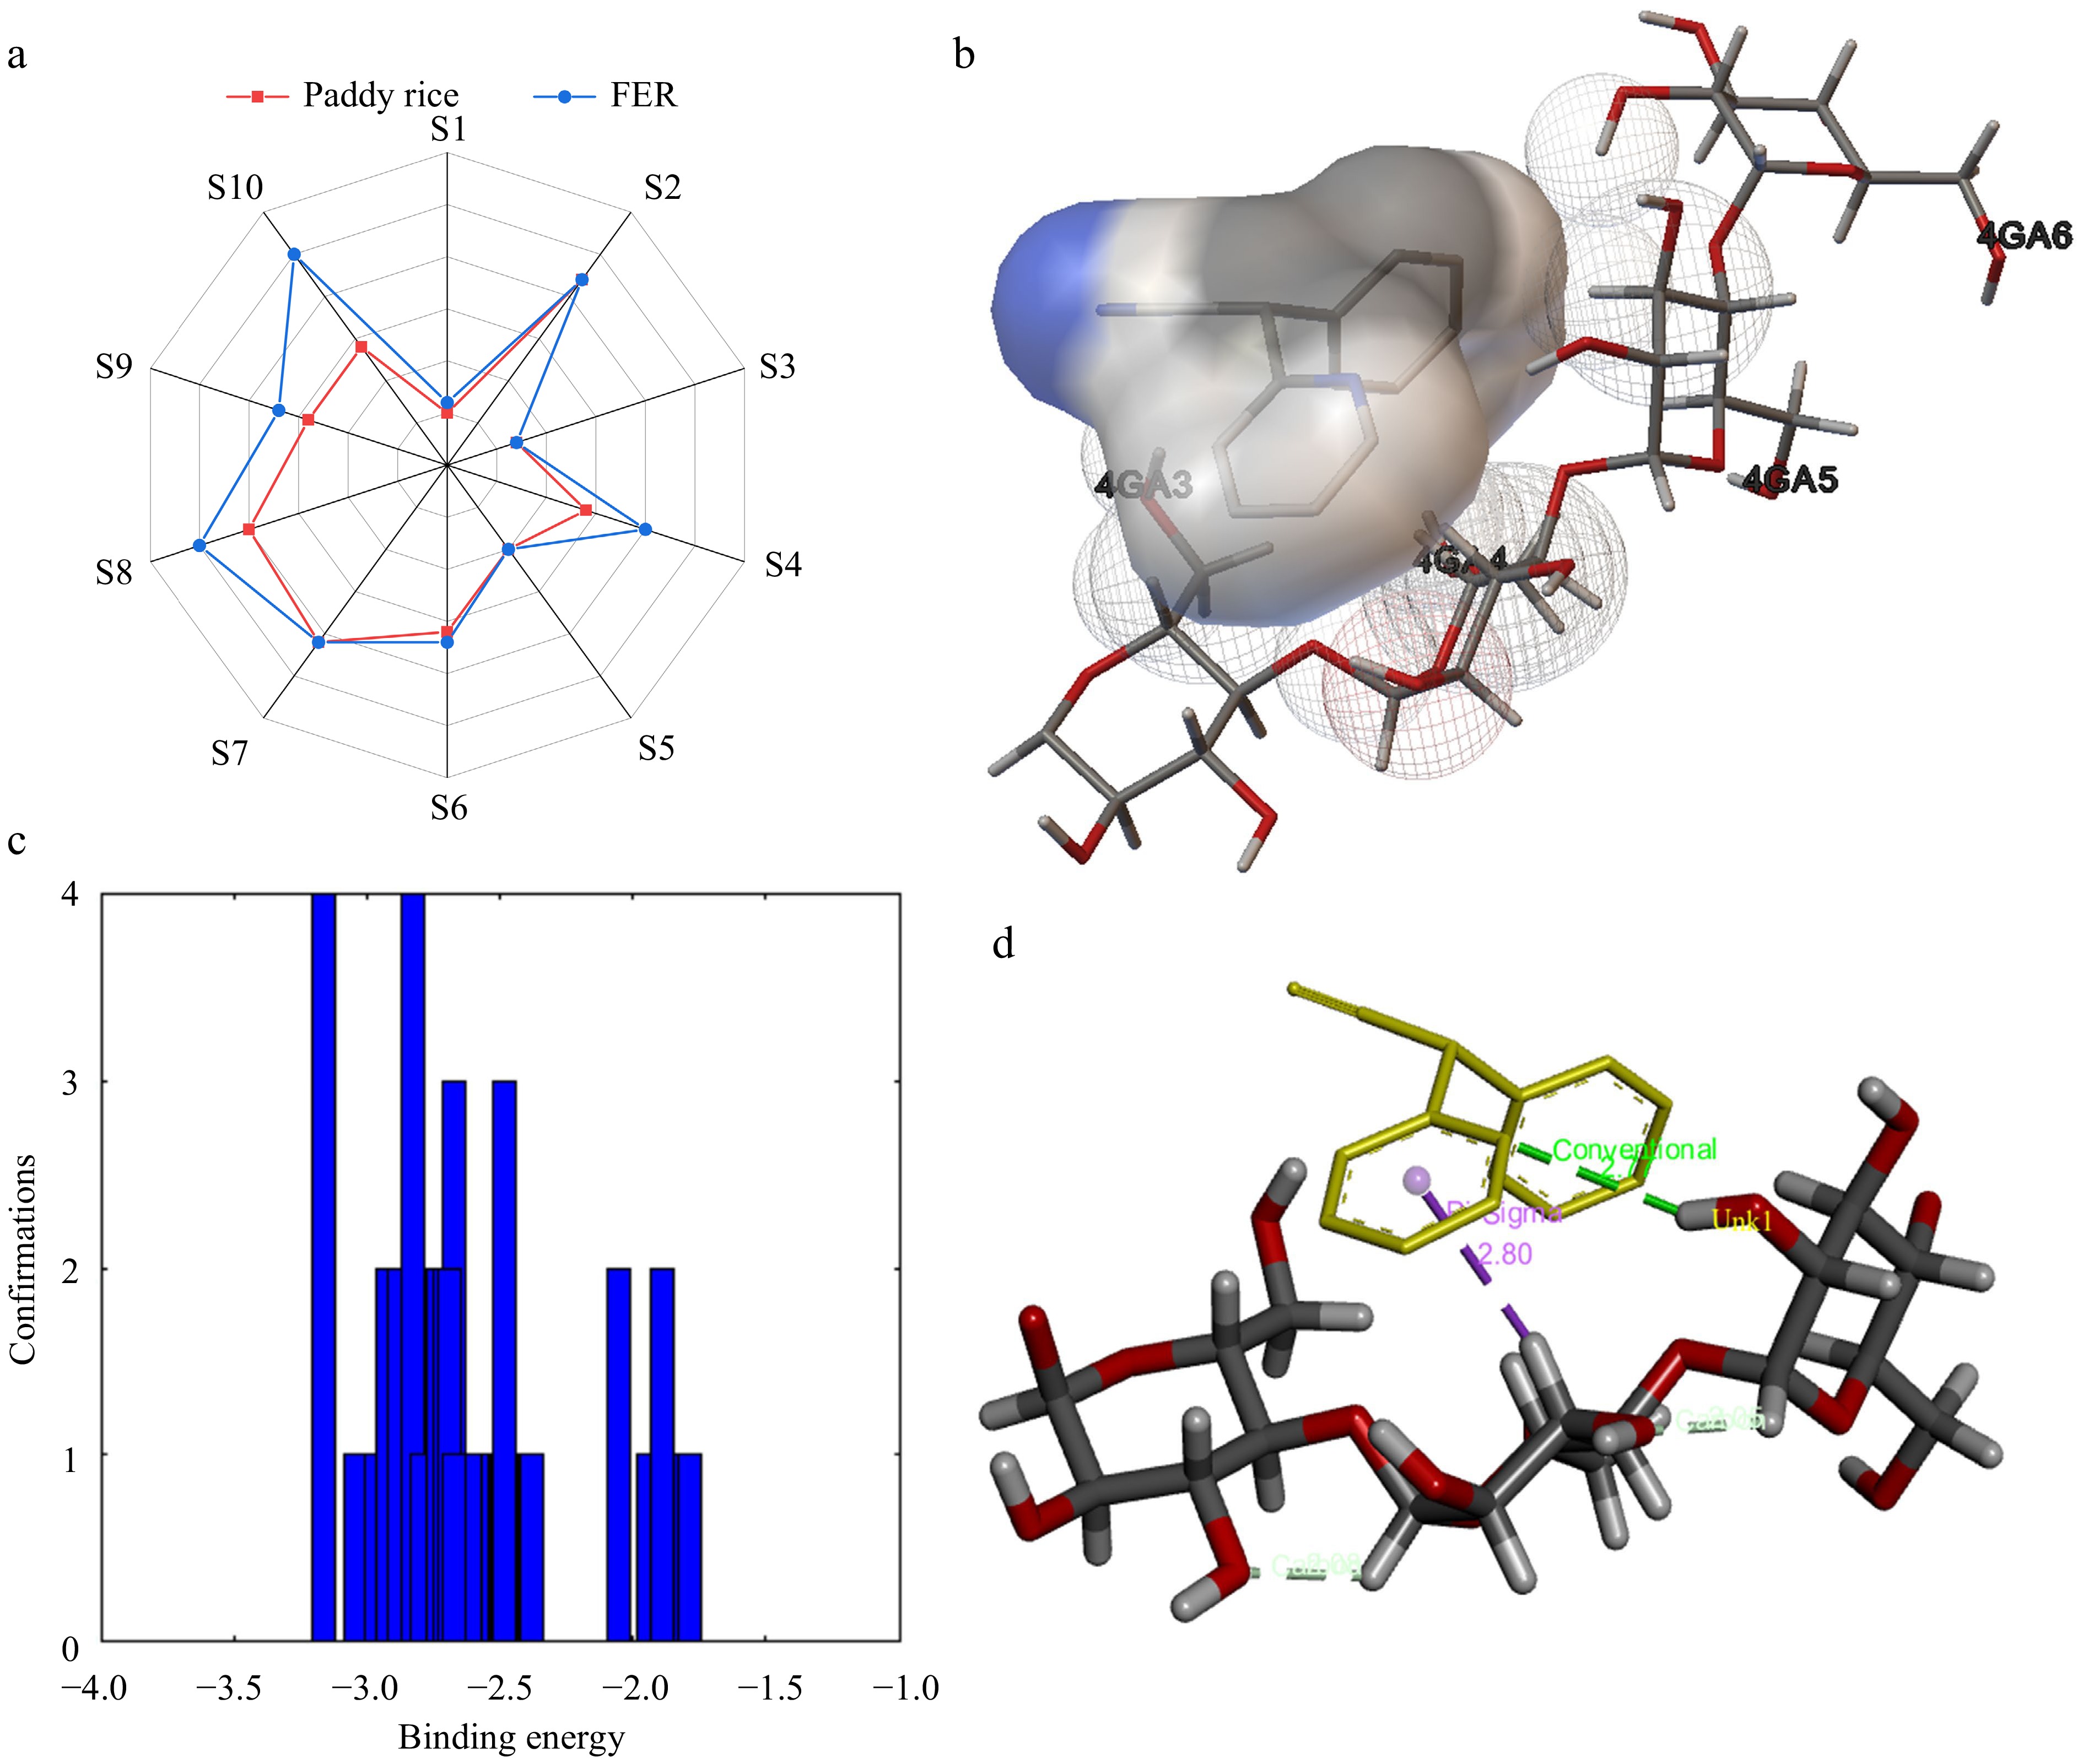
Figure 3.
(a) Food quality analysis radar chart. (b) The schematic diagram of the surface static electricity in the docking of starch and soy protein isolate molecules. (c) Diagram of the binding energy in all docking times, where the binding energy is less than 0, demonstrated that docking can be achieved, and the higher the value, the more powerful the binding. (d) Indicated that they were combined by hydrogen bond and hydrophobic force, and the bond position and length were shown in the figure.
-
Hardness (g) Elasticity (mm) Adhesiveness (gs) Cohesiveness (g) Chewiness (g) Resilience (gs) CK 600.53 ± 27.47a 0.48 ± 0.08c 0.47 ± 0.01c 296.60 ± 9.63a 155.56 ± 5.39a 0.36 ± 0.19a 2% 236.35 ± 10.06b 0.58 ± 0.02bc 0.57 ± 0.01a 140.92 ± 2.63b 91.23 ± 0.32b 0.26 ± 0.01a 3% 241.25 ± 4.28b 0.54 ± 0.01bc 0.52 ± 0.01b 120.67 ± 4.25c 66.39 ± 1.14c 0.21 ± 0.01a 4% 169.53 ± 3.95c 0.66 ± 0.01a 0.52 ± 0.01b 89.82 ± 2.39d 60.25 ± 1.16c 0.18 ± 0.01a The values represent the average value plus or minus the standard deviation (SD). The presence of distinct letters within the identical column signifies a significant disparity at a significance level of p < 0.05. Table 1.
Effect of soybean protein isolate on the textural properties of FER.
-
Samples Tm (°C) Rm (%/°C) TML (%) CK 262.54 ± 0.80b 0.7252 ± 0.0073b 67.70 ± 0.16d 2% 269.74 ± 1.04a 0.7625 ± 0.0022a 71.30 ± 0.27c 3% 270.79 ± 0.66a 0.7643 ± 0.0009a 73.48 ± 0.42a 4% 269.25 ± 0.16a 0.7648 ± 0.0024a 74.60 ± 0.09a Values are the mean ± standard deviation (SD). Different letters within the same column indicate significantly different at p < 0.05. Table 2.
Effect of soybean protein isolate on the thermogravimetric properties of FER.
-
Samples Taste Flavour Colour Appearance Taste analyser score FER 4.46 ± 0.27a 4.03 ± 0.19b 4.48 ± 0.25a 4.85 ± 0.08a 86.50 ± 1.08b Paddy rice 4.63 ± 0.18a 4.65 ± 0.33a 3.67 ± 0.42b 4.89 ± 0.05a 92.00 ± 1.31a The values represent the average value plus or minus the standard deviation (standard deviation). The presence of distinct letters within the identical column signifies a significant disparity at a significance level of p < 0.05. Table 3.
Food quality analysis of FER.
Figures
(3)
Tables
(3)