-
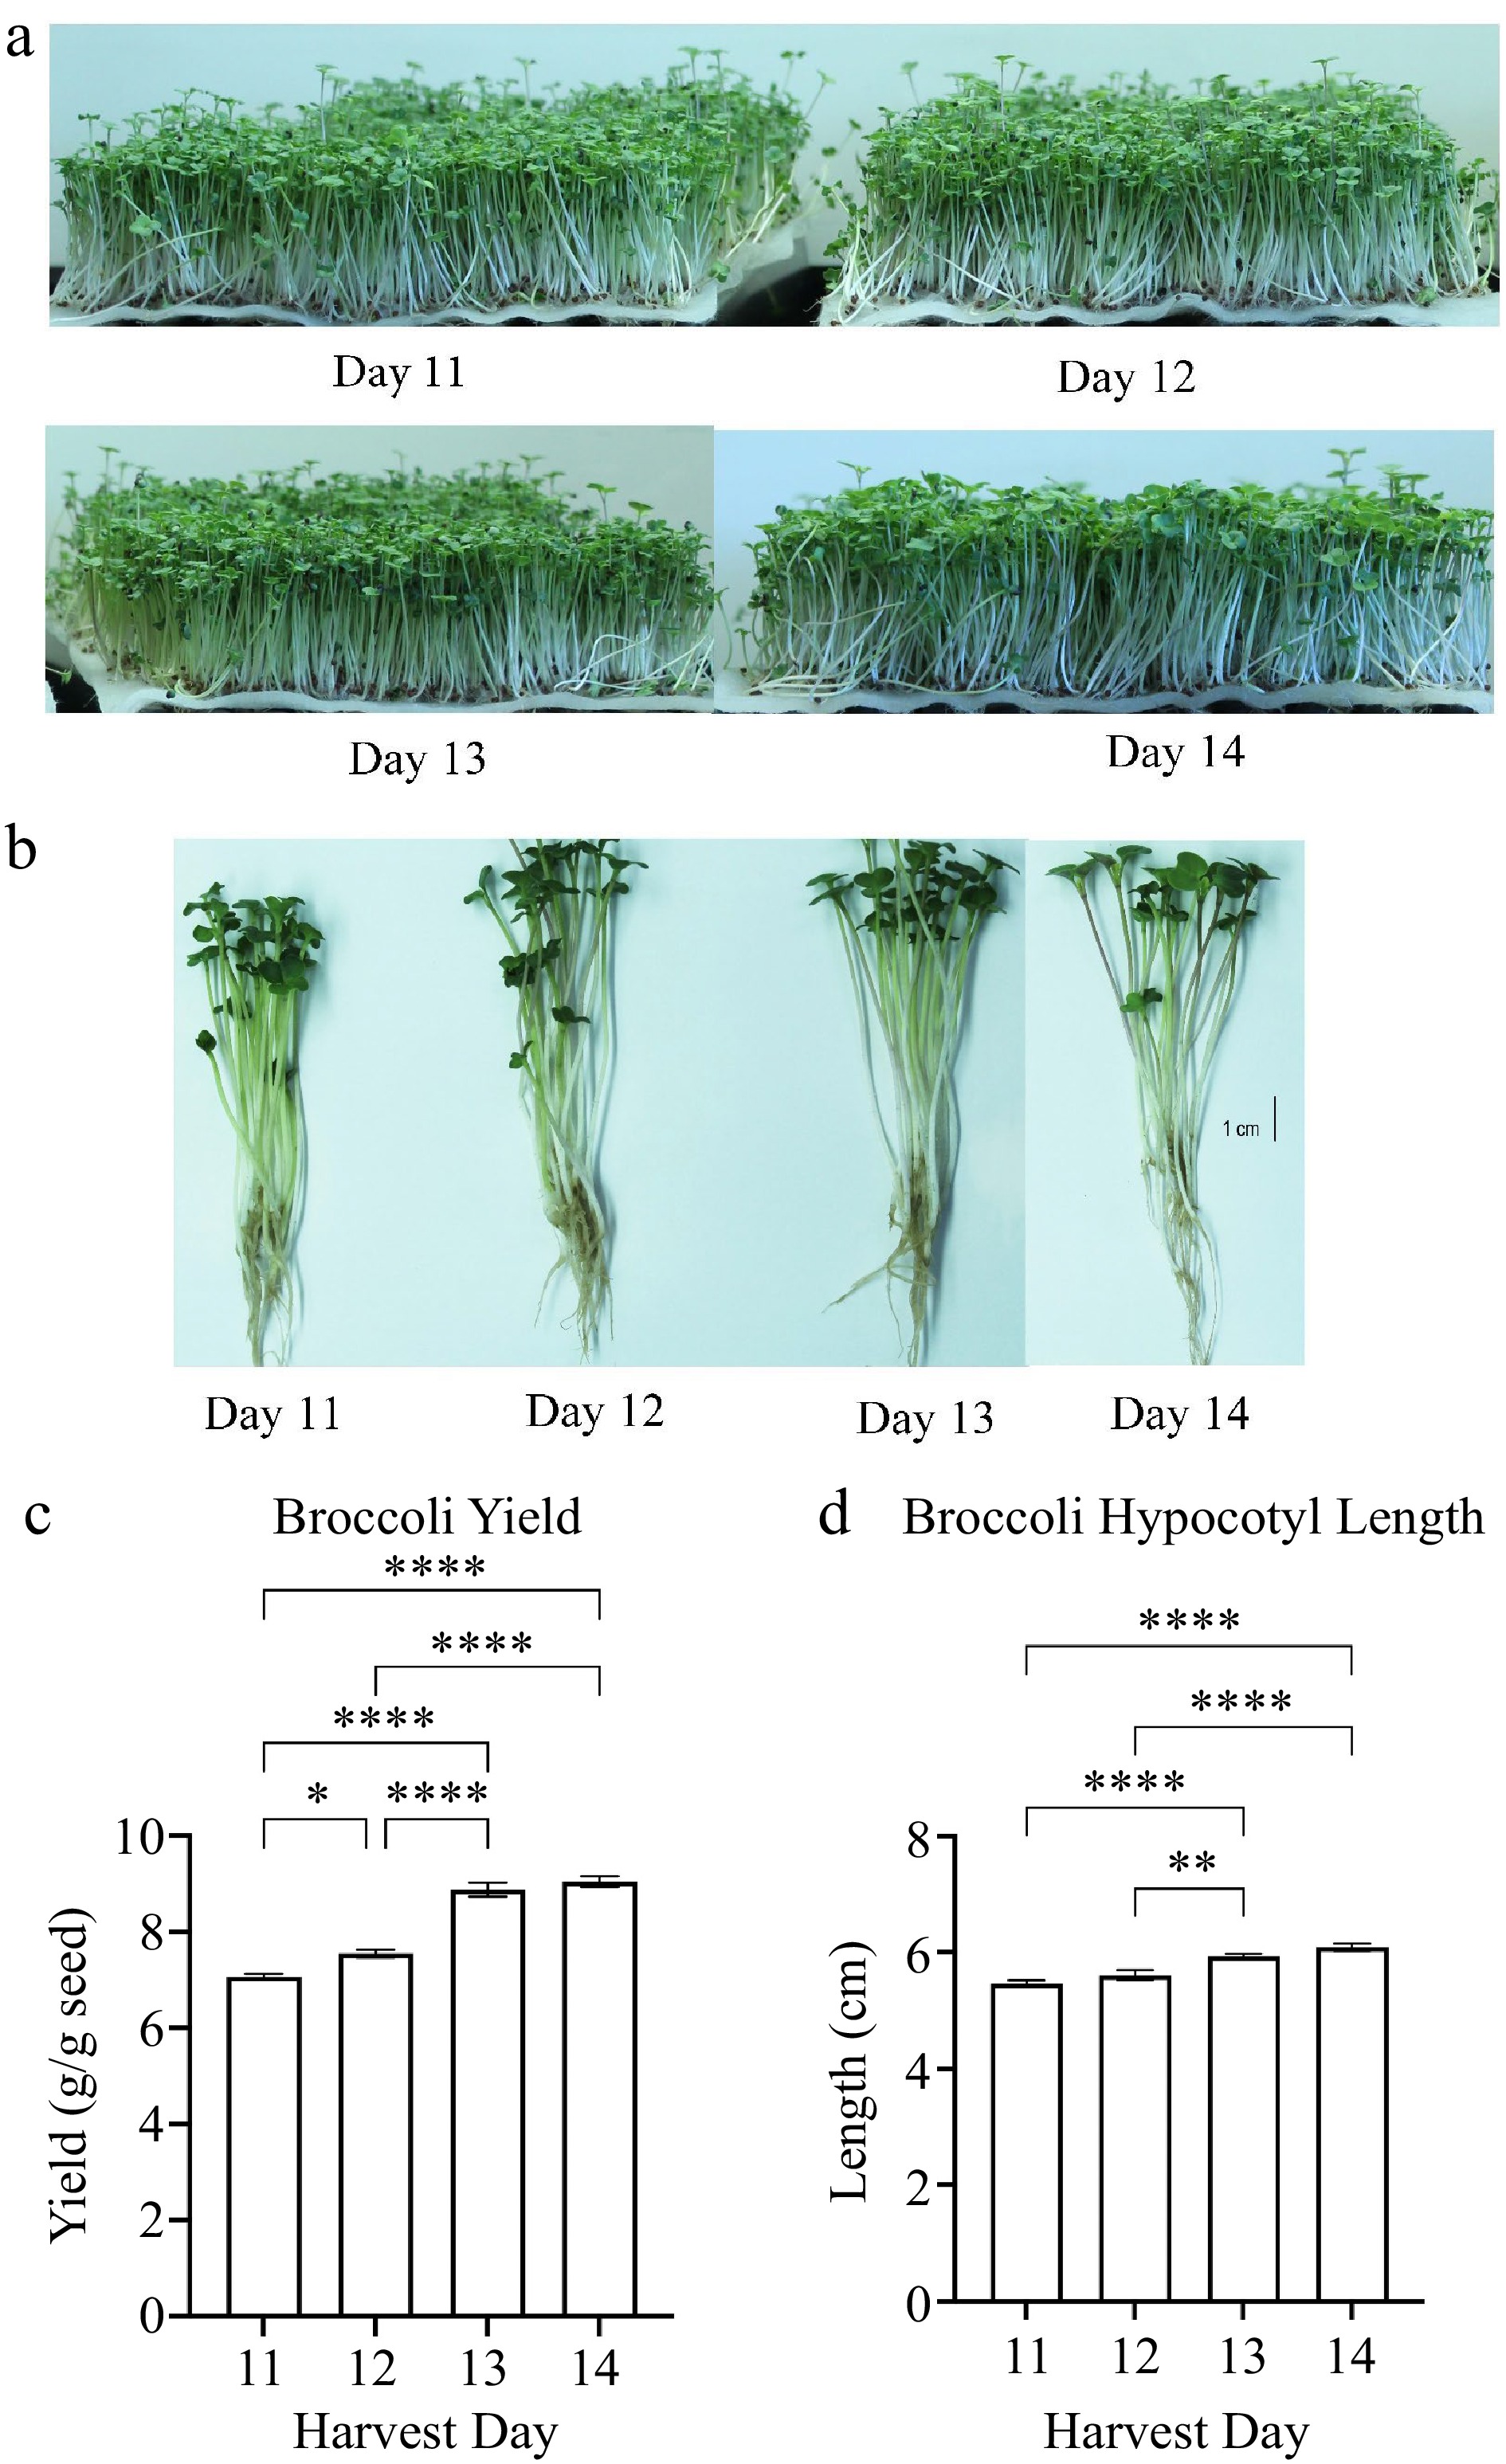
Figure 1.
(a), (b) Broccoli plants images and measurements of microgreen (c) yield and (d) plant height. Seedlings of broccoli cultivar Di Cicco grown hydroponically in BioStrate™ growing mats for 11 to 14 d post sowing. Microgreen yield and height were measured at harvest days 11 to 14. Bars represent standard error of the means. Asterisks indicate significant differences in yield or height between harvest days. * Indicates adjusted (adj) p-value = 0.0485; ** indicates adj p-value = 0.0043; **** indicates adj p-value < 0.0001.
-
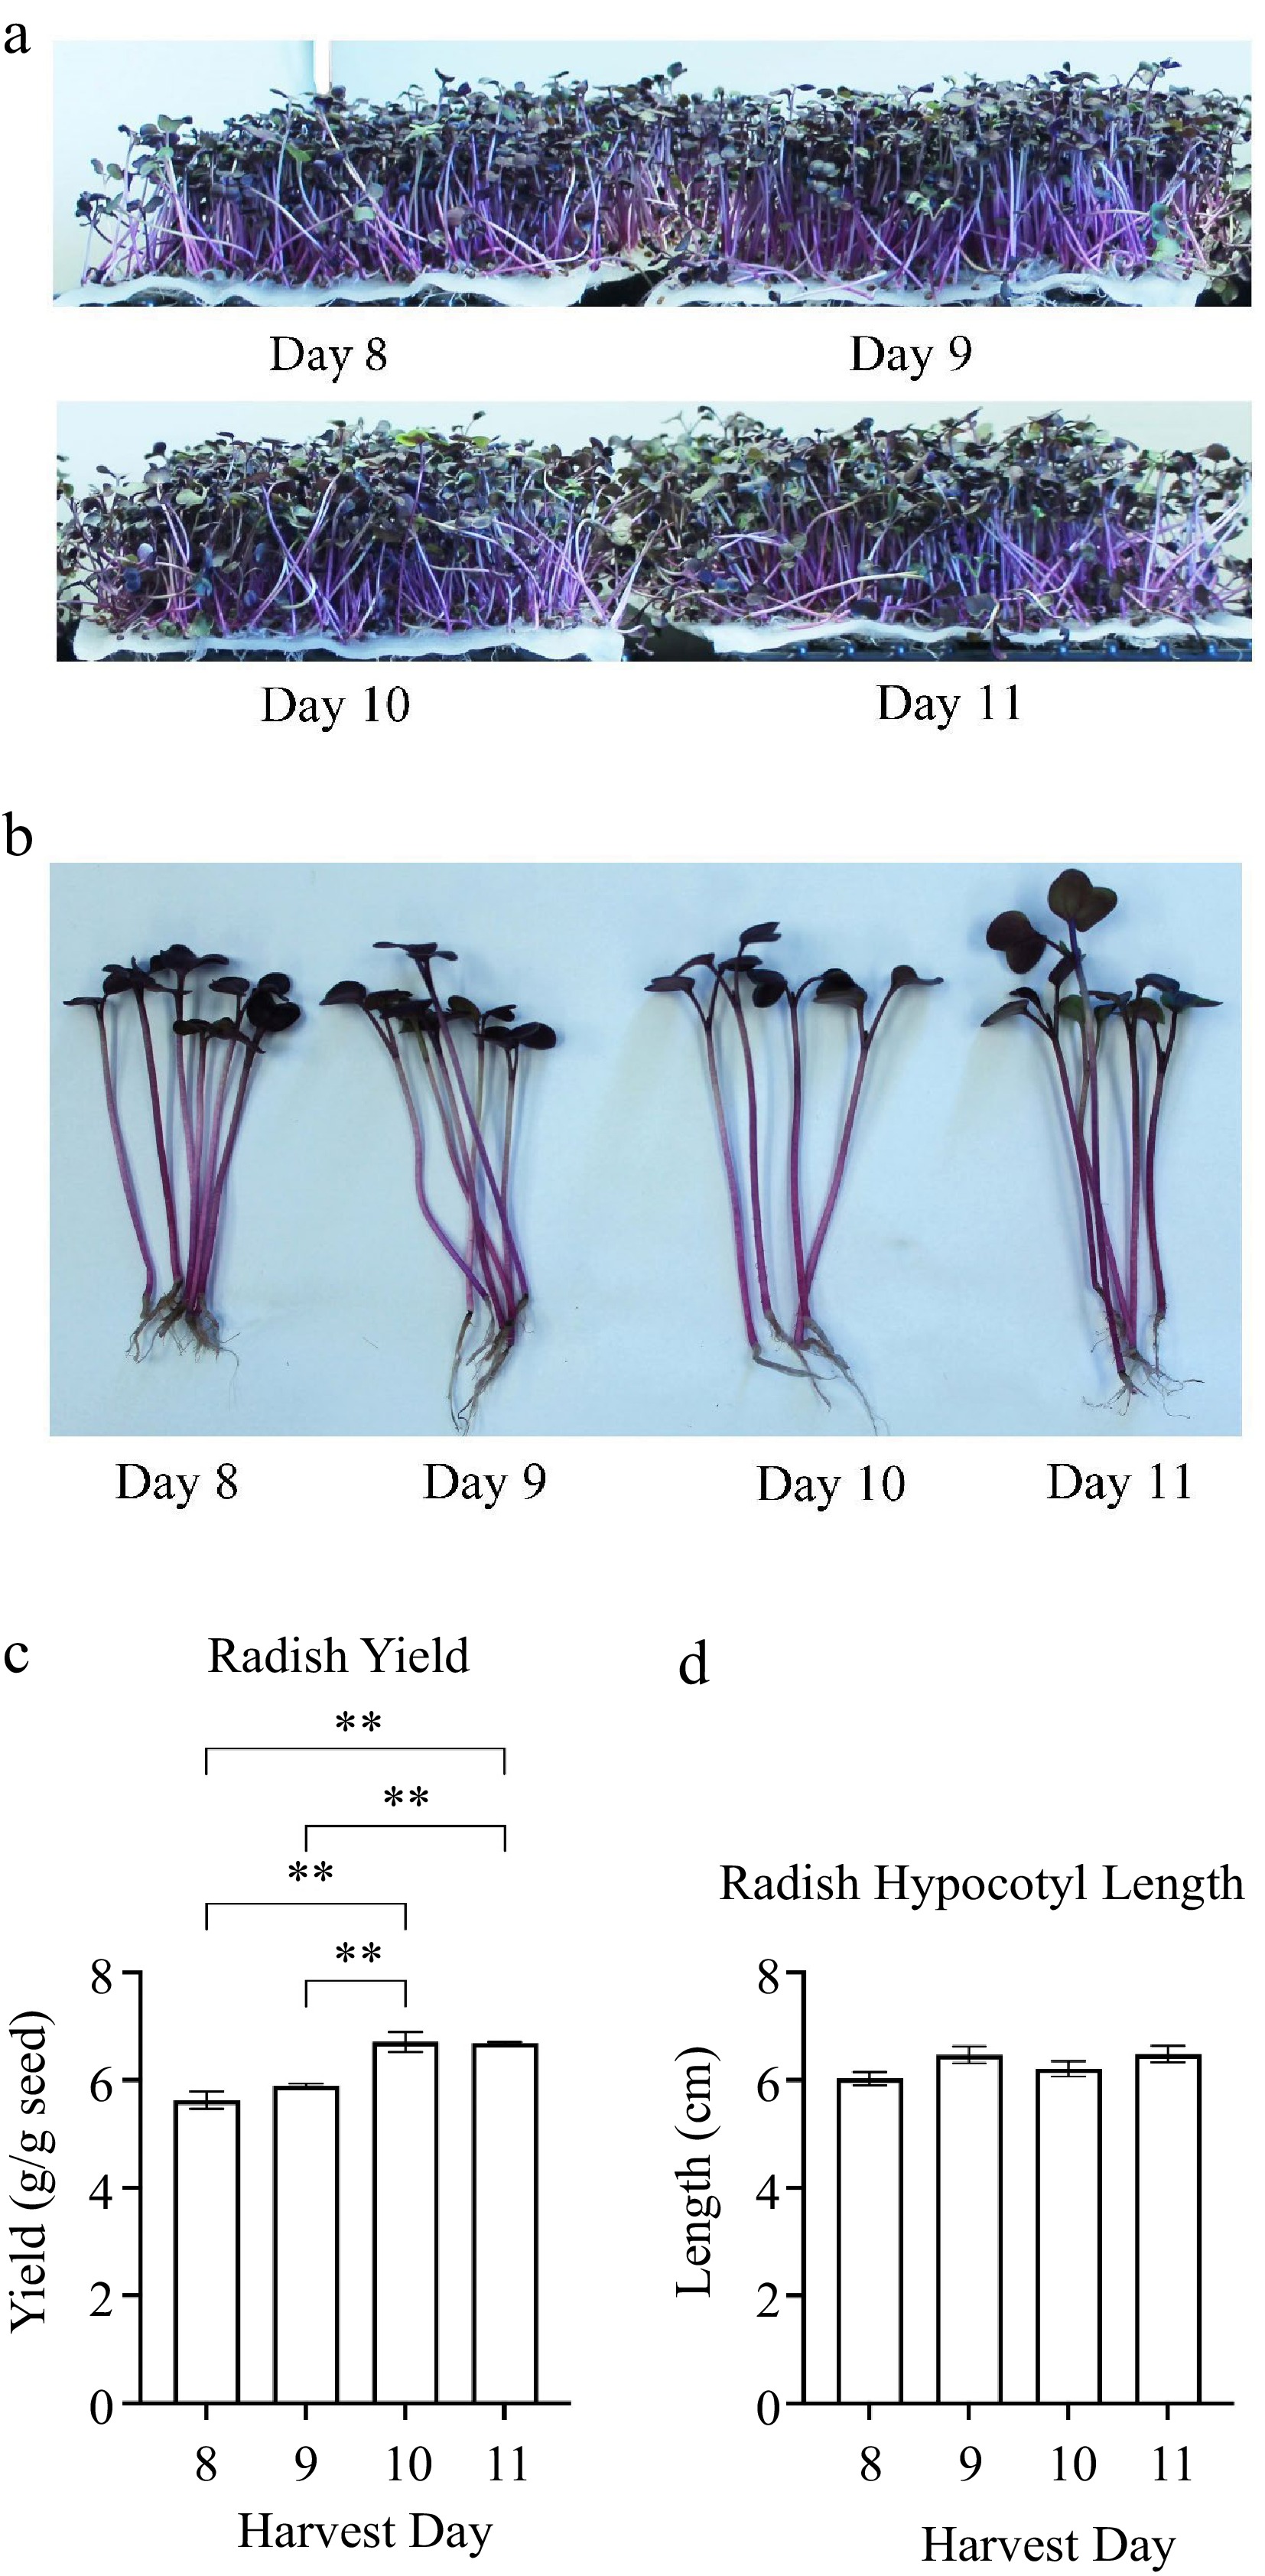
Figure 2.
(a), (b) Radish plant images and measurements of (c) yield and (d) plant height. Radish cultivar Rambo were grown hydroponically in BioStrate™ growing mats for 8 to 11 days post sowing. Radish microgreens' yield and height were measured on harvest days 8 to 11. Bars represent standard error of the means. Asterisks indicate significant differences between harvest days. ** Indicates 0.0002 < adj p-value ≤ 0.0021.
-
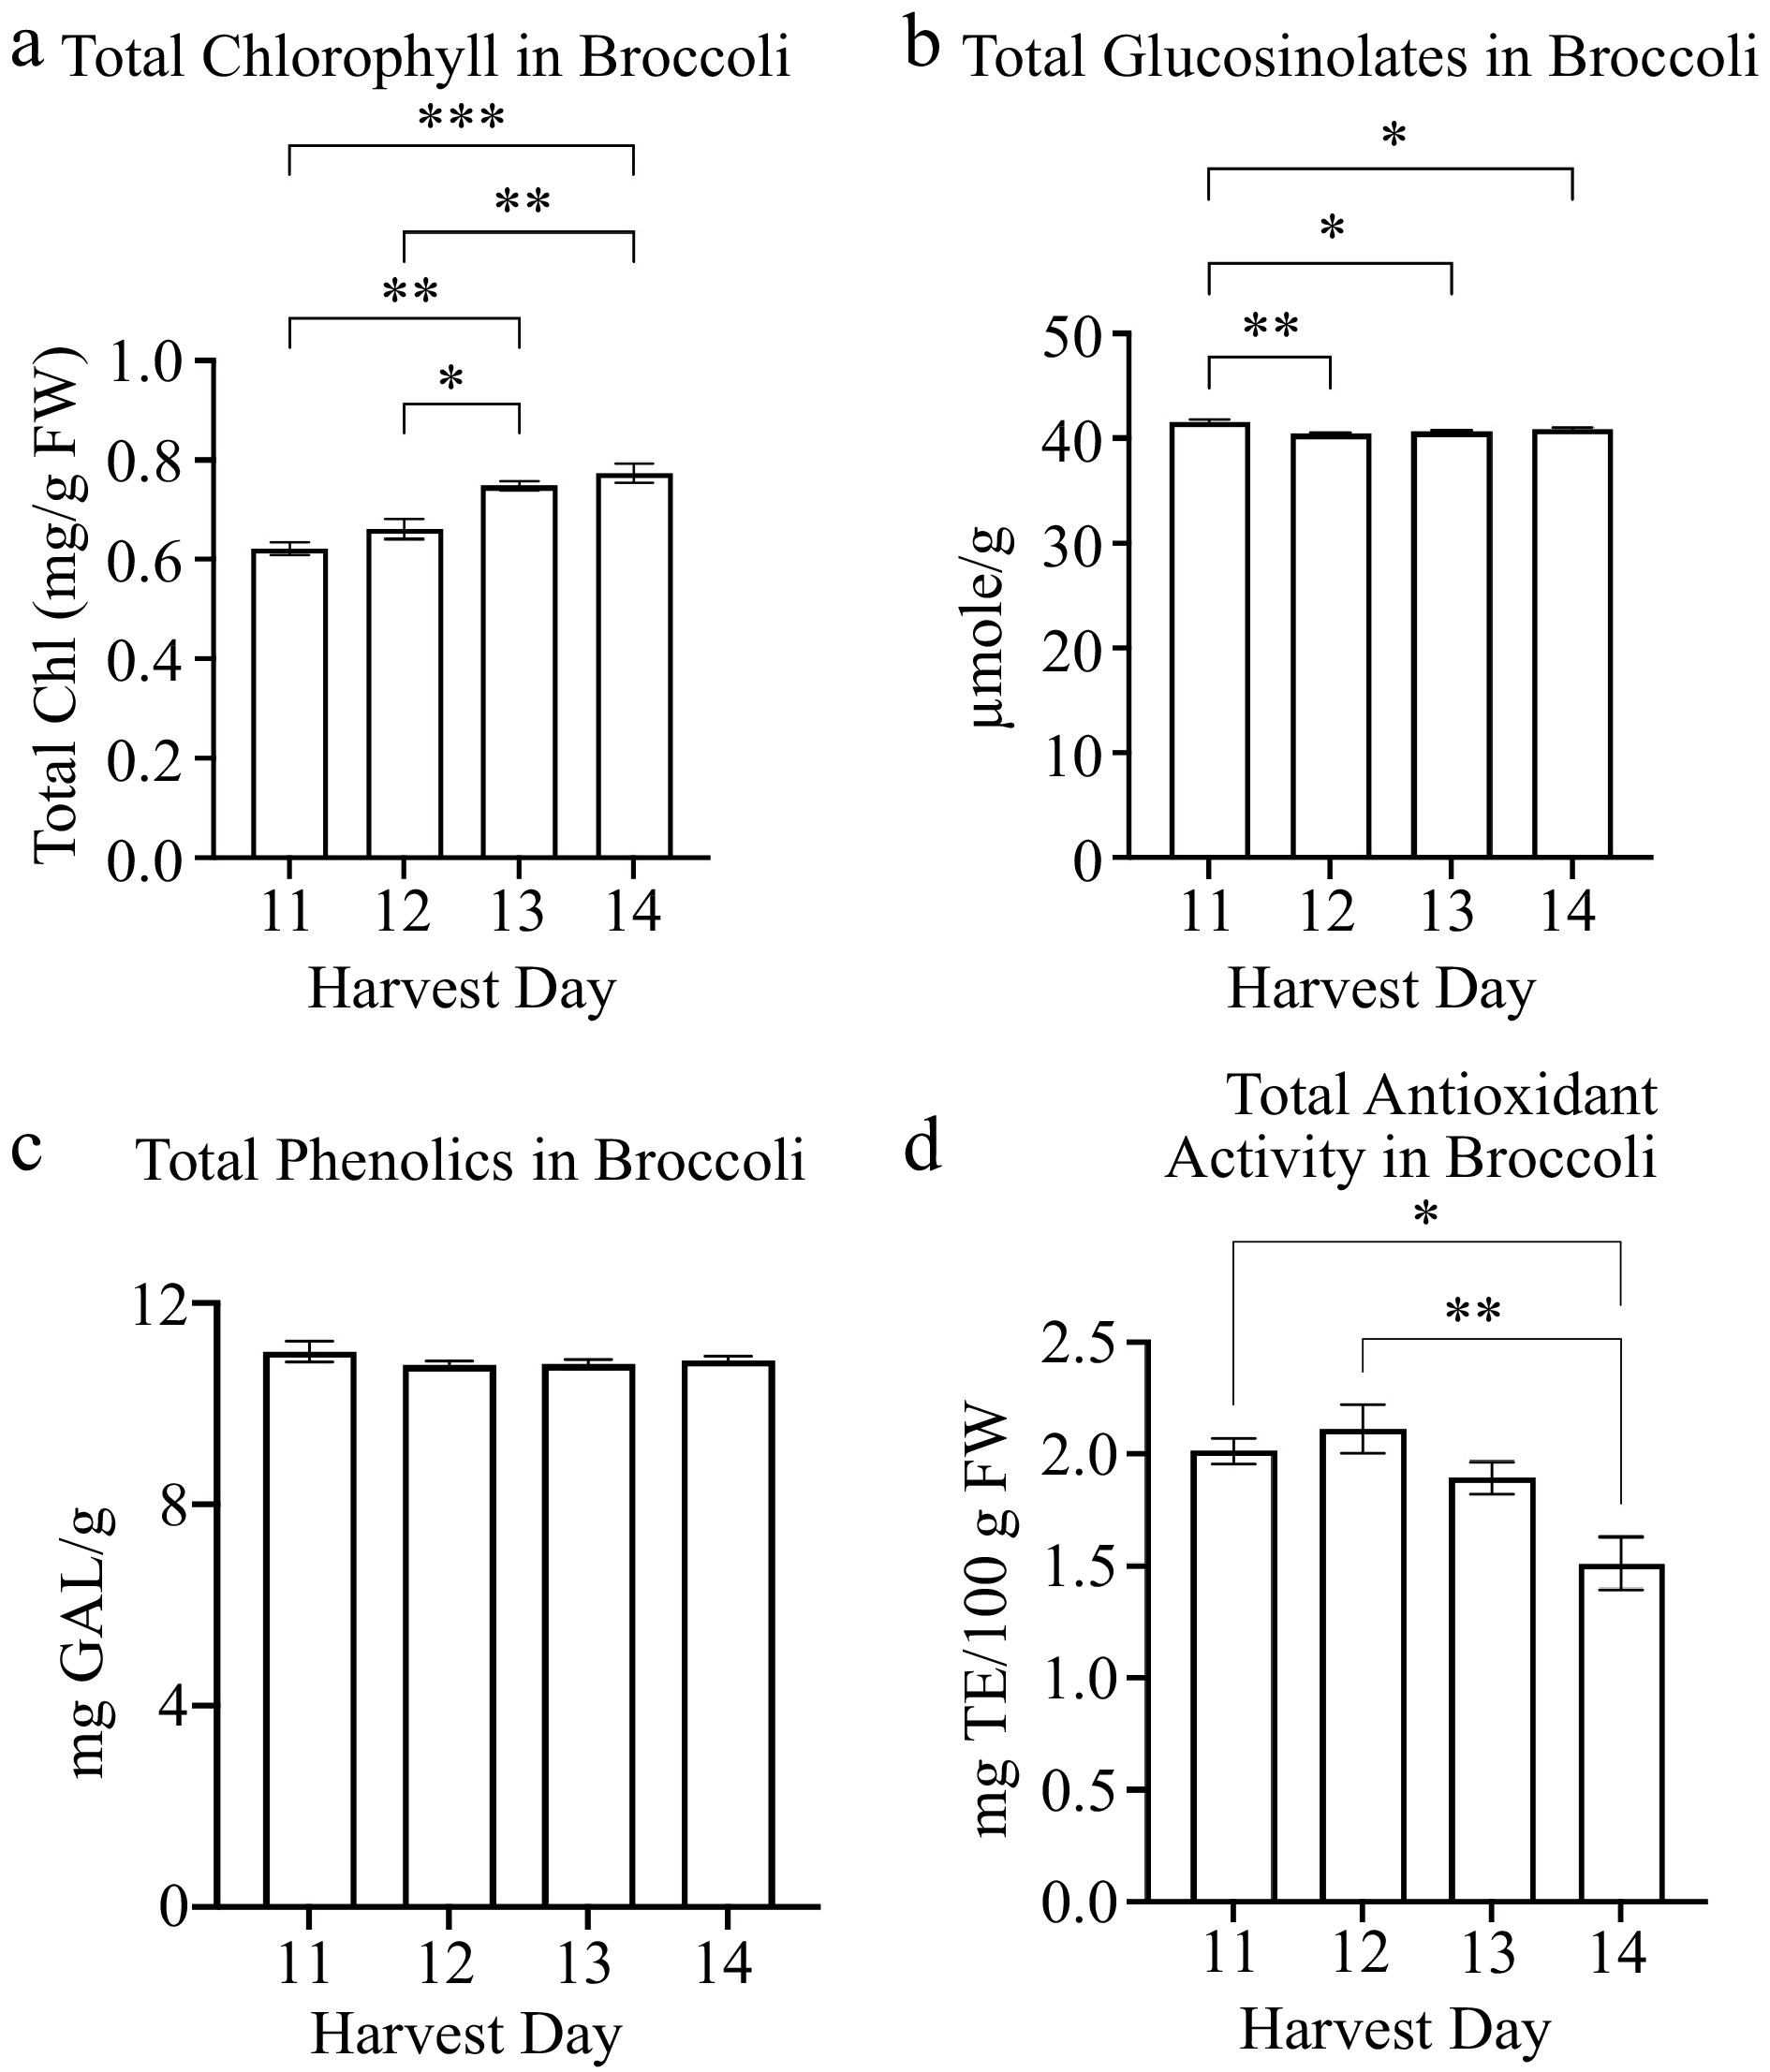
Figure 3.
Concentrations of broccoli microgreens (a) total chlorophyll and secondary metabolites: (b) glucosinolates, (c) phenolics and (d) antioxidant activity in broccoli microgreens for several harvest days is shown. Bars represent standard error of the means. Asterisks indicate significant differences in total chlorophyll or glucosinolates between harvest days. * Indicates 0.0021 < adj p-value ≤ 0.05; ** indicates 0.0002 < adj p-value ≤ 0.0021; *** indicates 0.0001 < adj p-value ≤ 0.0002.
-
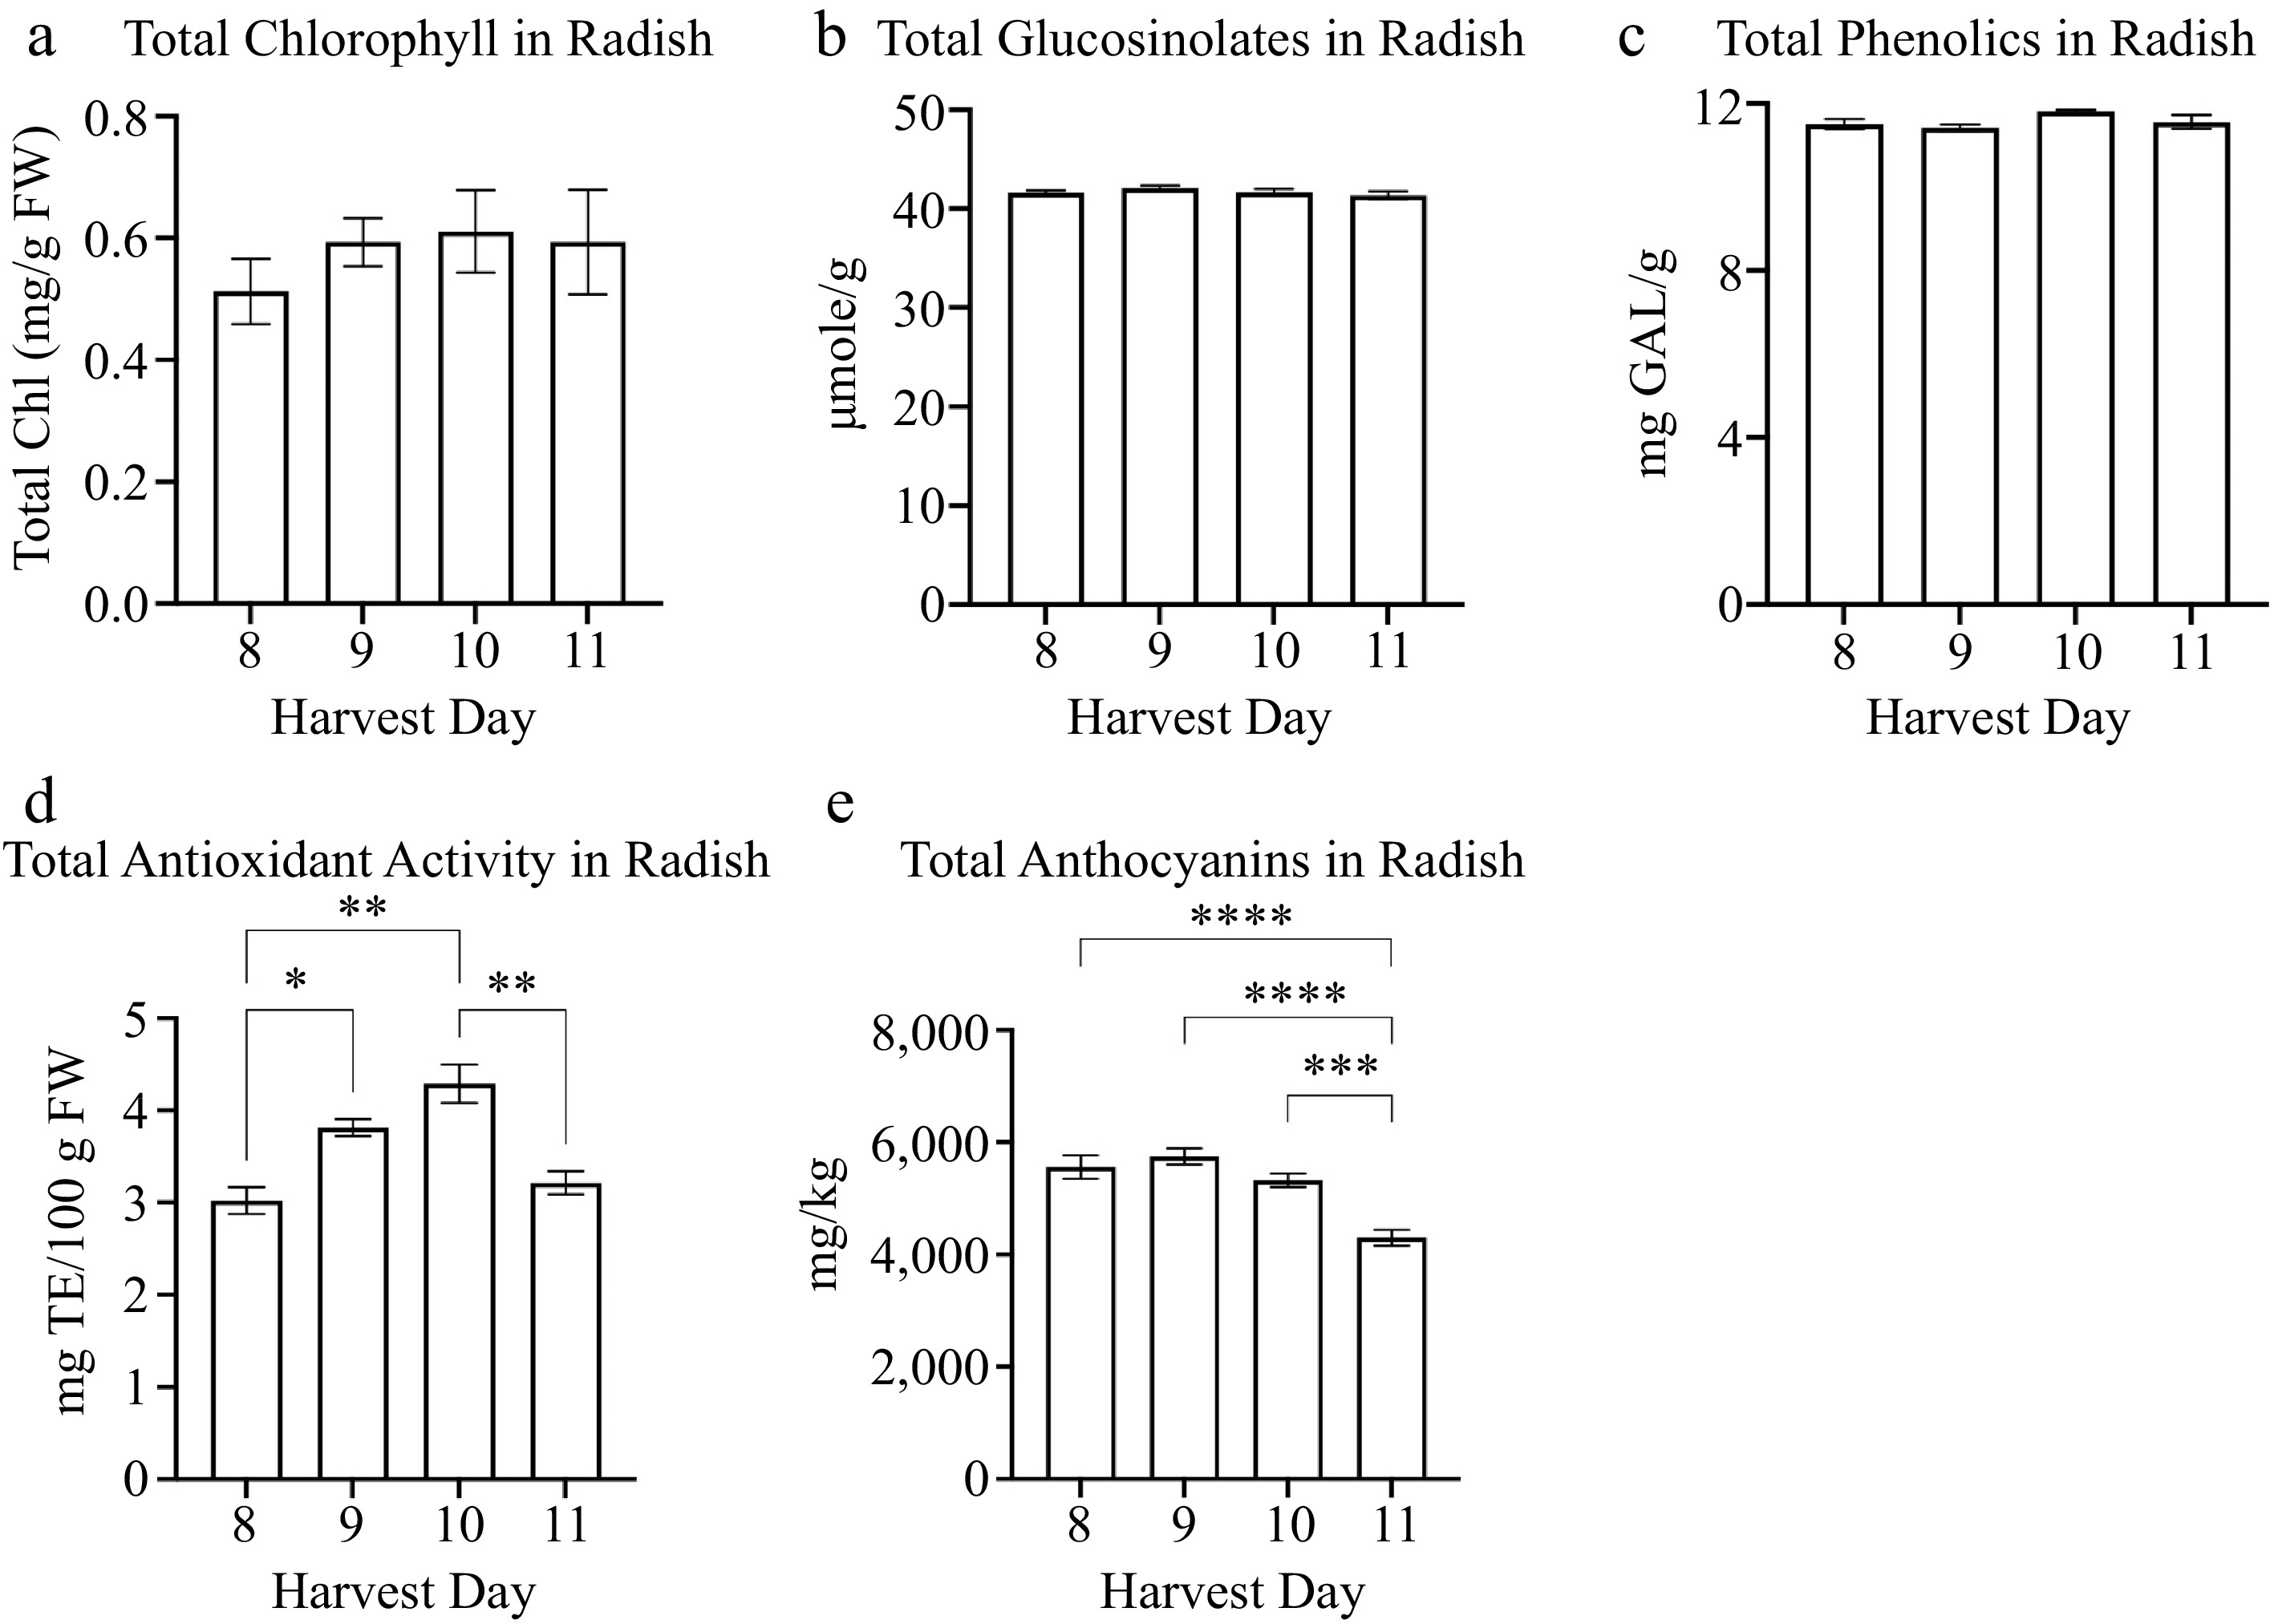
Figure 4.
Concentrations of radish microgreens (a) total chlorophyll and secondary metabolites: (a) glucosinolates, (b) phenolics, (c) antioxidant activity, and (d) anthocyanins for radish microgreens at several harvest days is shown. Bars represent standard error of the means. Asterisks indicate significant differences in total anthocyanins between harvest days. * Indicates 0.0021 < adj p-value ≤ 0.05; ** indicates 0.0002 < adj p-value ≤ 0.0021; *** indicates 0.0001 < adj p-value ≤ 0.0002; **** indicates adj p-value < 0.0001.
-
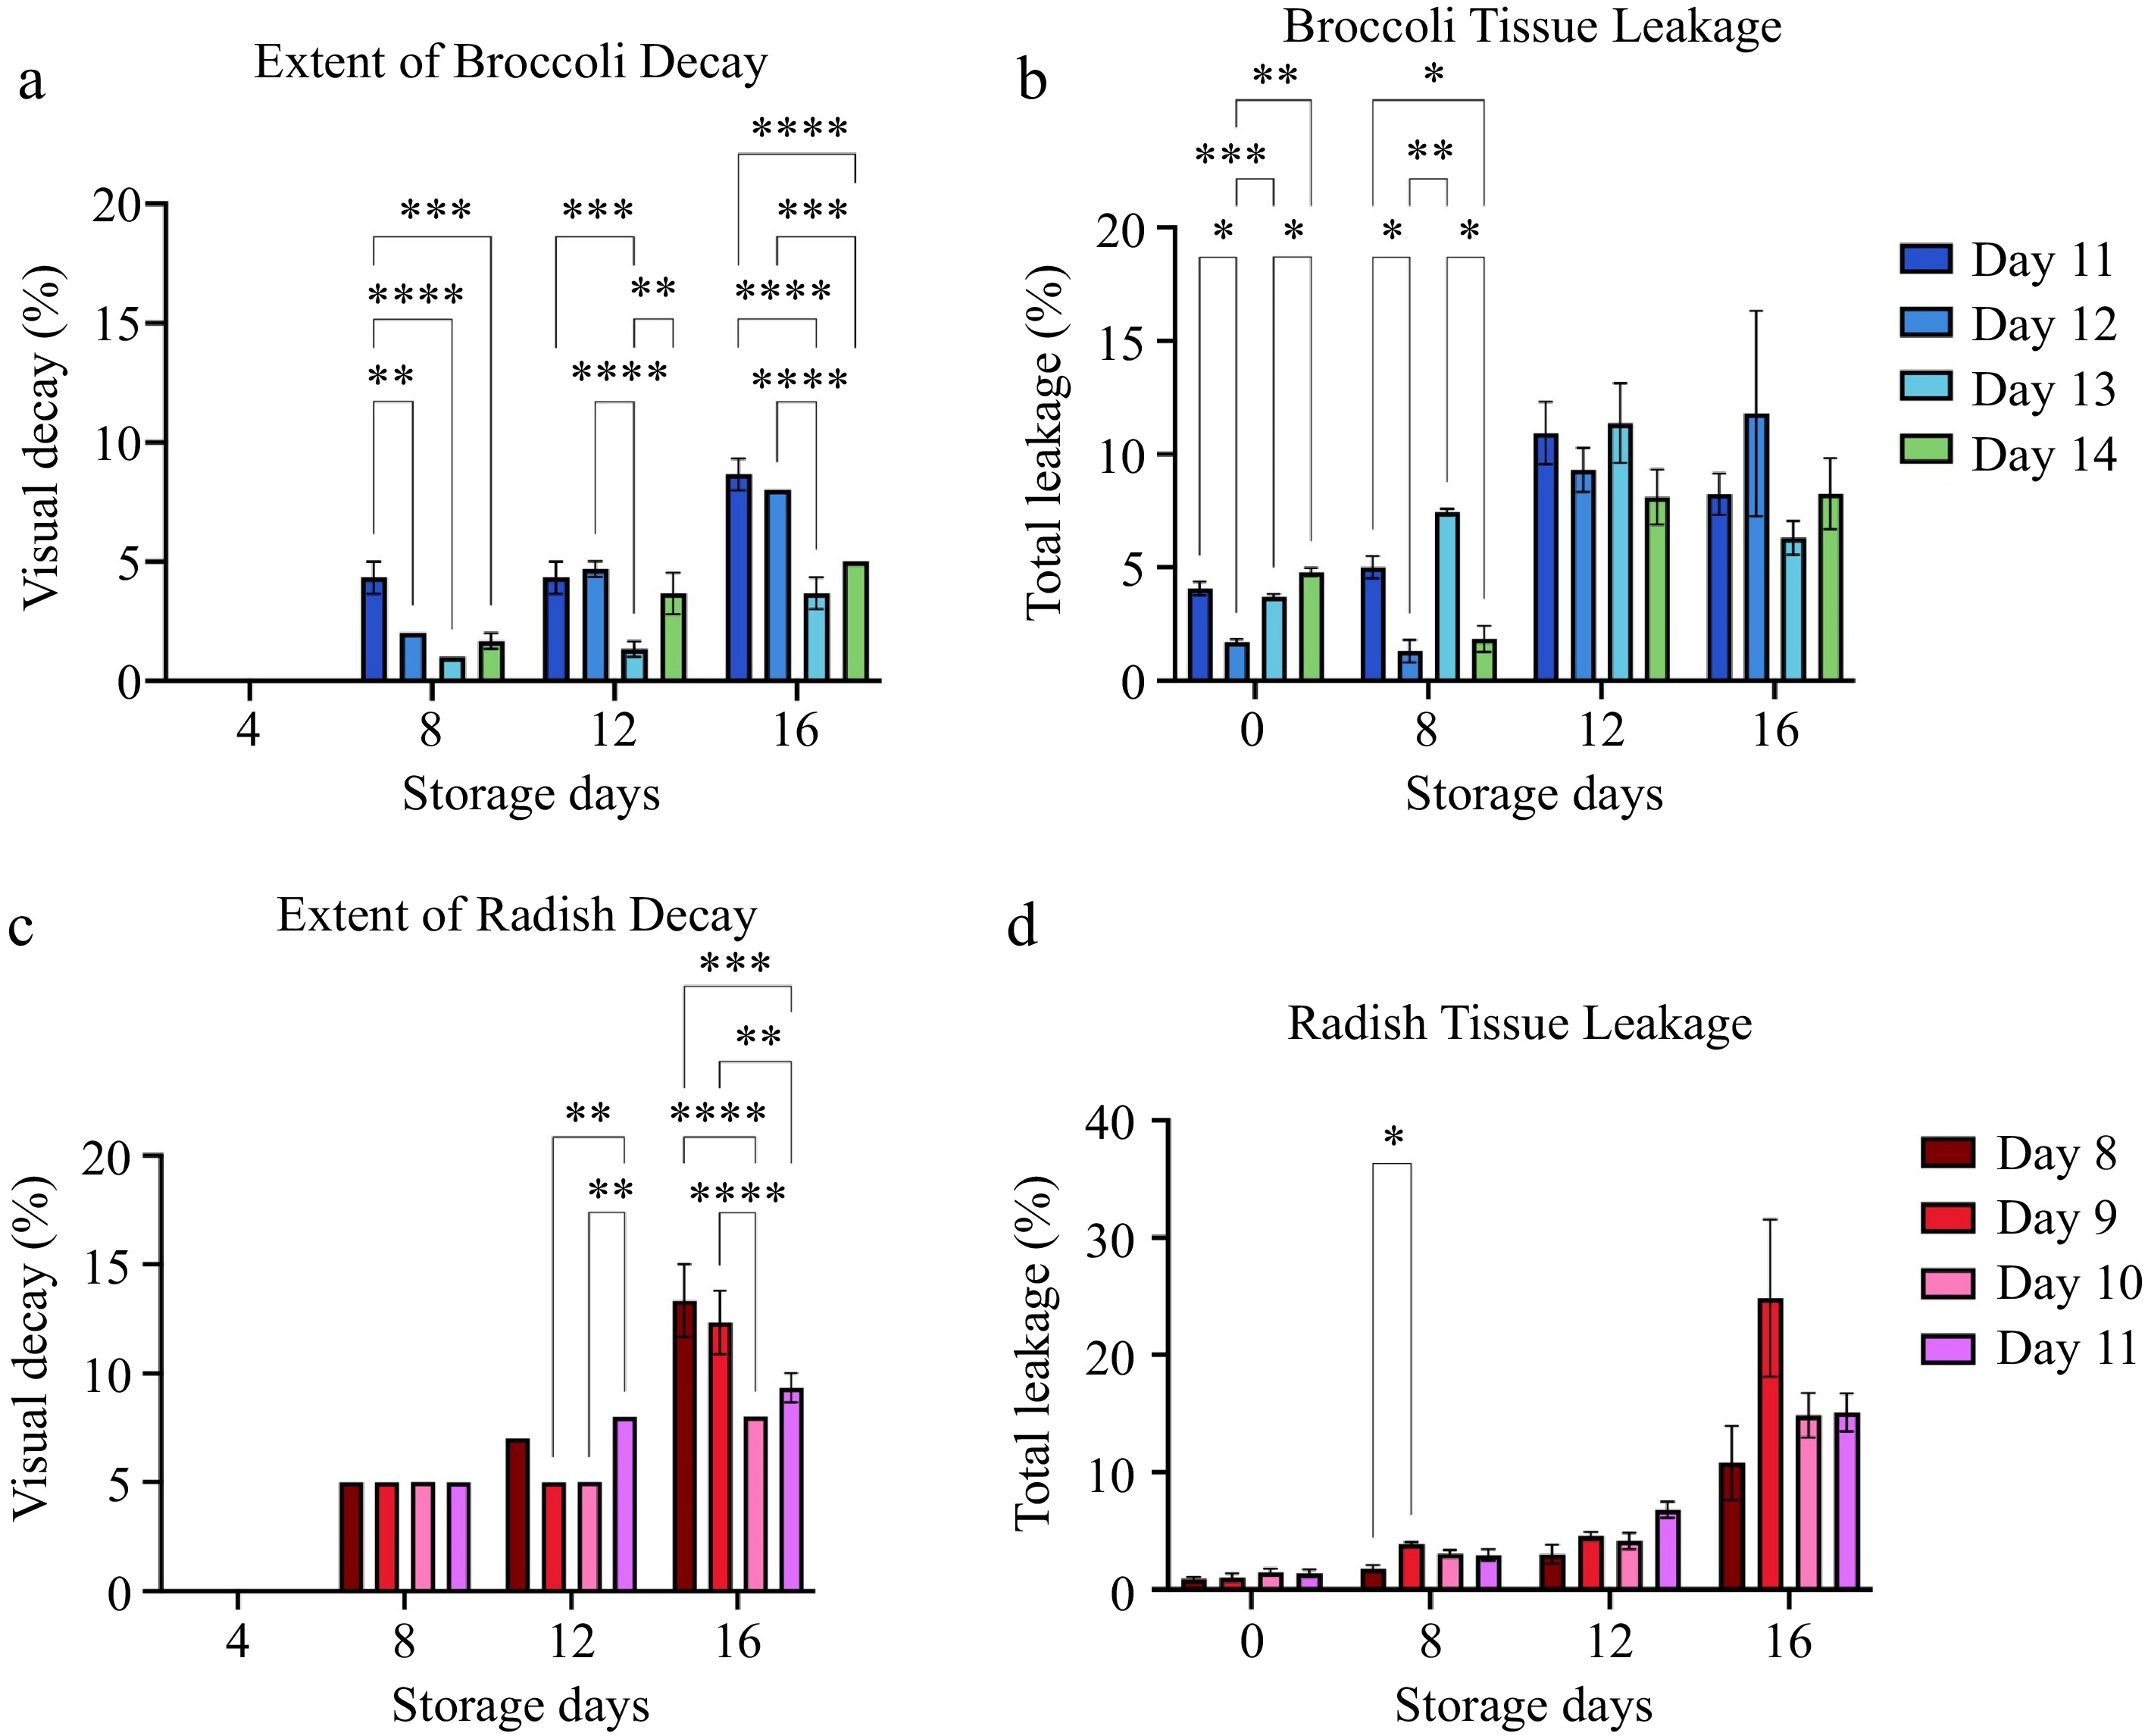
Figure 5.
The extent of decay and tissue leakage for (a), (b) broccoli and (c), (d) radish microgreens at several storage days is shown. Bars represent standard error of the means. Asterisks indicate significant differences in total anthocyanins between harvest days. * Indicates 0.0021 < adj p-value ≤ 0.05; ** Indicates 0.0002 < adj p-value ≤ 0.0021; *** indicates 0.0001 < adj p-value ≤ 0.0002; **** indicates adj p-value < 0.0001.
-
Score Description Visual quality 0% Essentially free from defects, freshly harvested Excellent < 10% Minor defects, not objectionable Good < 25% Moderately objectionable defects Fair > 50% Excessive defects, not saleable, marketability threshold Poor 100% Unusable, degraded product Very poor Table 1.
Microgreen decay evaluation scale based on overall visual analysis modified from Rennie et al.[34].
-
Harvest day Plant yield Plant hypocotyl length Total chlorophyll Total
phenolicsTotal glucosinolates Total antioxidant activity Tissue decay after 16 storage days Tissue leakage after 16 storage days Harvest day 1.000 Plant yield 0.946**** 1.000 Plant hypocotyl length 0.868** 0.872** 1.000 Total chlorophyll 0.917**** 0.930**** 0.841** 1.000 Total phenolics −0.276 −0.286 −0.303 −0.343 1.000 Total glucosinolates −0.457 −0.461 −0.334 −0.421 0.350 1.000 Total antioxidant activity 0.735* 0.639* 0.731* 0.574* 0.073 0.053 1.000 Tissue decay after 16 storage days −0.789* −0.904**** −0.750* −0.794* 0.294 0.305 0.459 1.000 Tissue leakage after 16 storage days 0.151 0.320 0.313 0.097 0.202 0.040 0.413 0.334 1.000 The correlation coefficient (r) values are shown for comparisons of broccoli microgreens quality traits. The asterisks represent significance in r. * indicates 0.0021 < p-value ≤ 0.05; ** indicates 0.0002 < p-value ≤ 0.0021; *** indicates 0.0001 < p-value ≤ 0.0002; **** indicates p-value < 0.0001. Table 2.
Correlation for broccoli microgreen quality traits.
-
Harvest day Plant yield Plant hypocotyl length Total chlorophyll Total anthocyanins Total phenolics Total glucosinolates Total antioxidant activity Tissue decay after 16 storage days Tissue leakage after 16 storage days Harvest day 1.000 Plant yield 0.875** 1.000 Plant hypocotyl length 0.295 0.156 1.000 Total chlorophyll 0.025 0.026 0.331 1.000 Total anthocyanins −0.659* −0.391 −0.262 0.256 1.000 Total phenolics 0.293 0.490 0.237 0.107 −0.362 1.000 Total glucosinolates −0.267 −0.232 −0.014 0.085 0.488 −0.423 1.000 Total antioxidant activity 0.324 0.395 0.048 0.273 0.195 0.392 0.290 1.000 Tissue decay after 16 storage days −0.673* −0.724* −0.048 0.193 0.165 −0.317 0.030 0.411 1.000 Tissue leakage after 16 storage days 0.216 0.395 0.048 0.335 0.195 0.392 0.290 0.324 0.411 1.000 The correlation coefficient (r) values are shown for comparisons of radish microgreens quality traits. The asterisks represent significance in r, * indicates 0.0021 < p-value ≤ 0.05; ** indicates 0.0002 < p-value ≤ 0.0021. Table 3.
Correlation for radish microgreens quality traits.
Figures
(5)
Tables
(3)