-
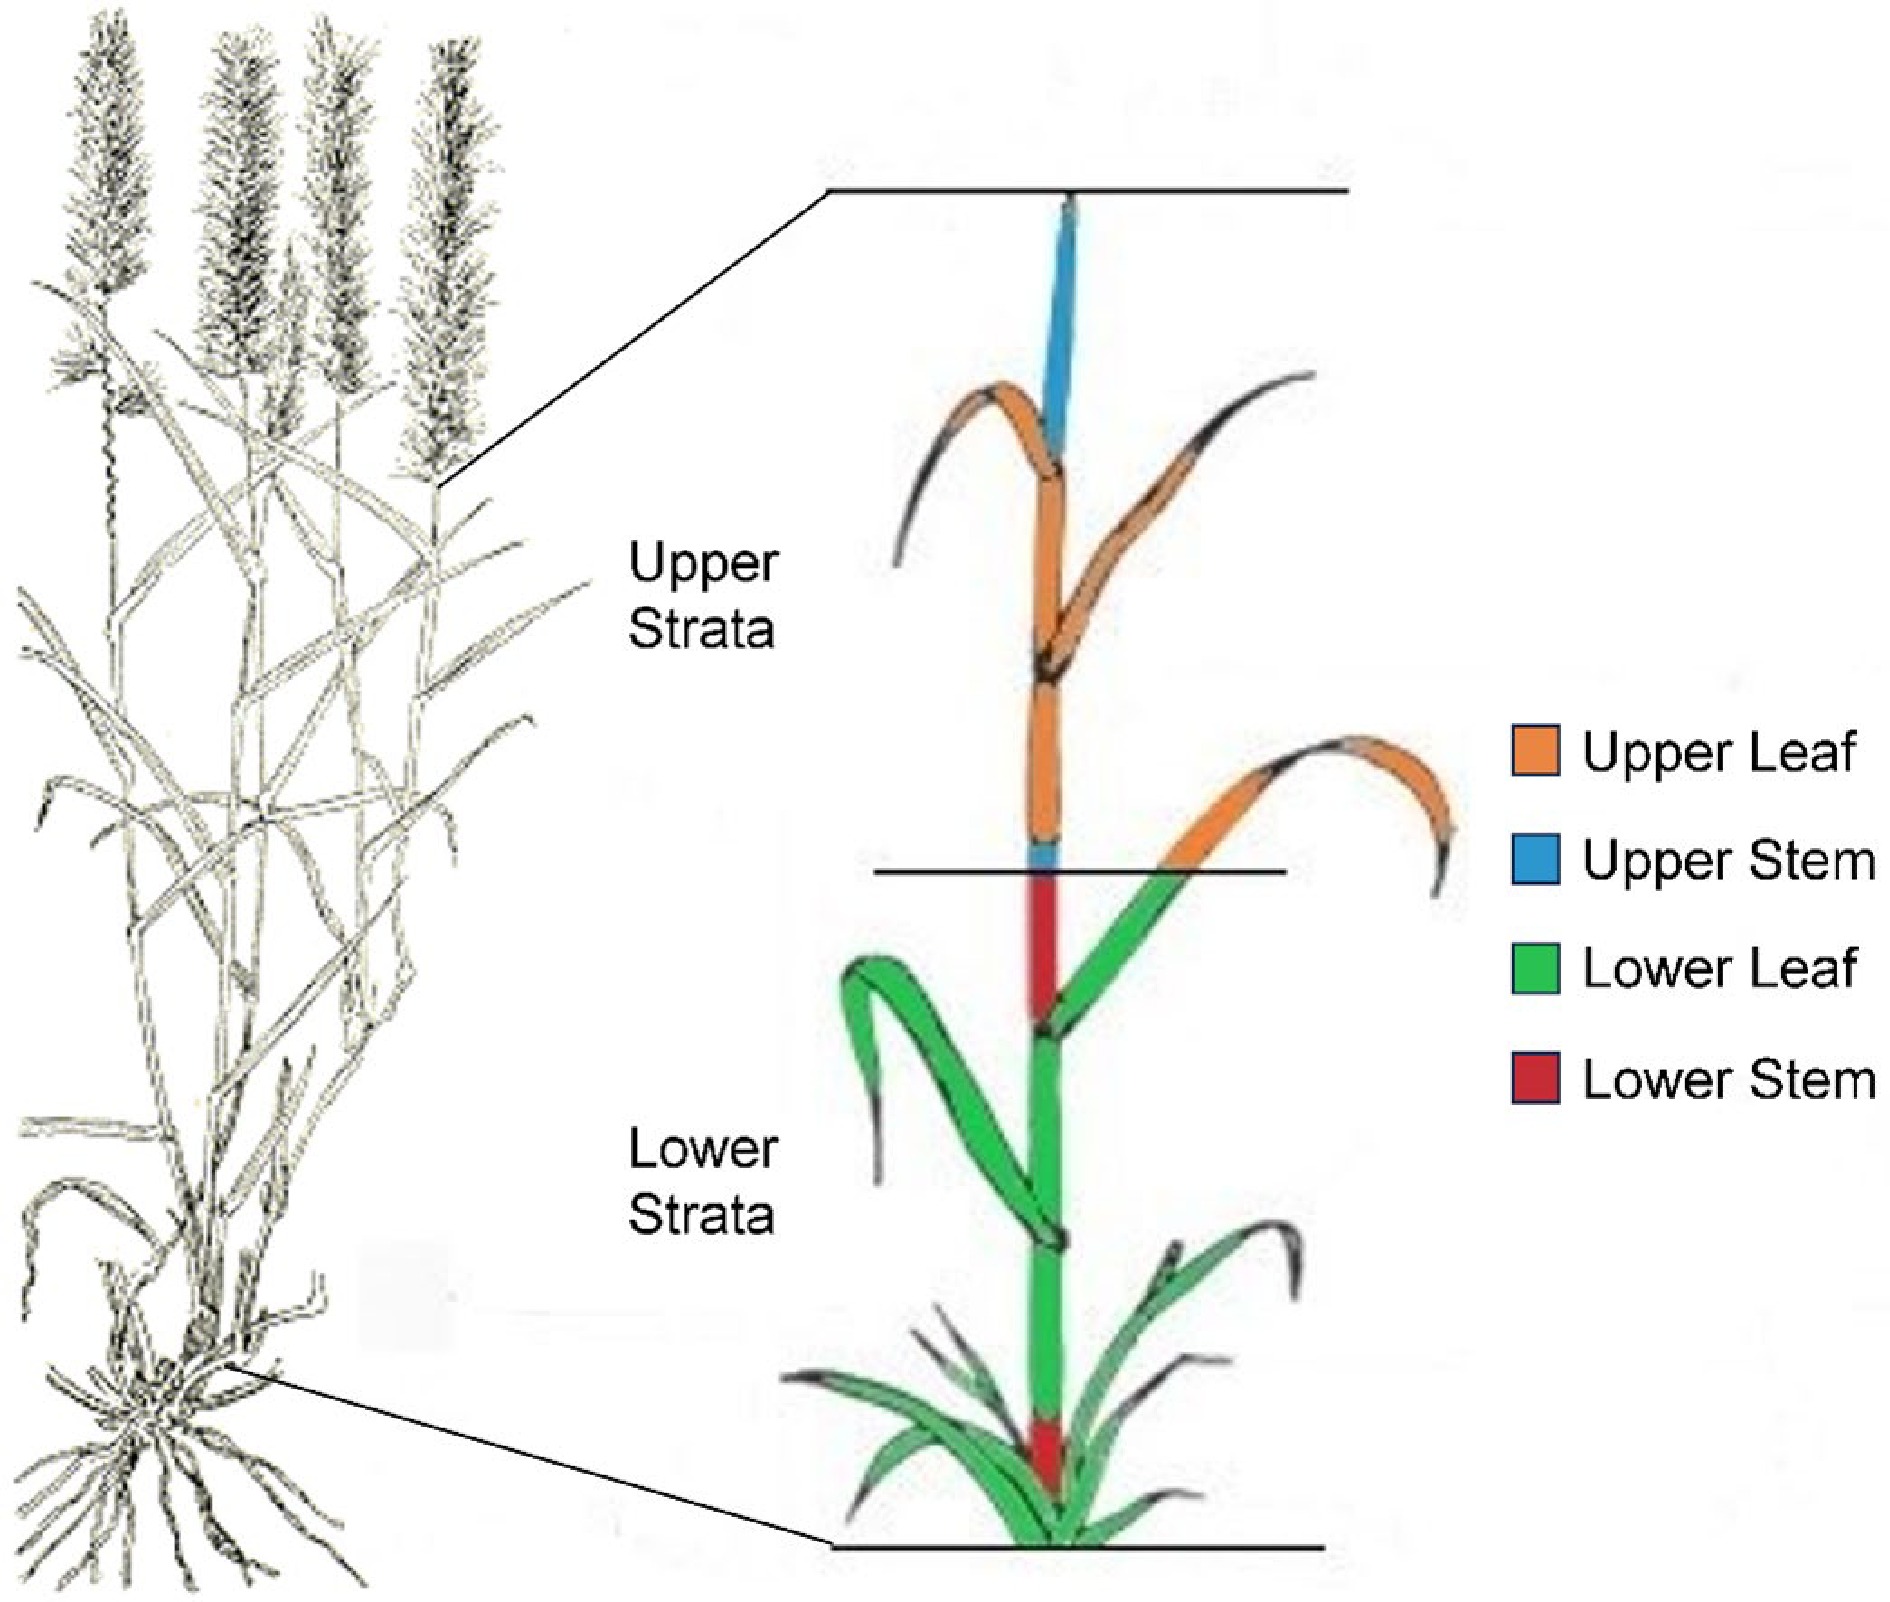
Figure 1.
Buffel accessions were harvested, seed heads removed, divided into upper and lower strata, oven dried and each stratum separated into leaf and stem tissue. The four tissues are indicated by color; lower stem (red), lower leaf including sheath (green), upper stem (blue), and upper leaf including sheath (orange).
-
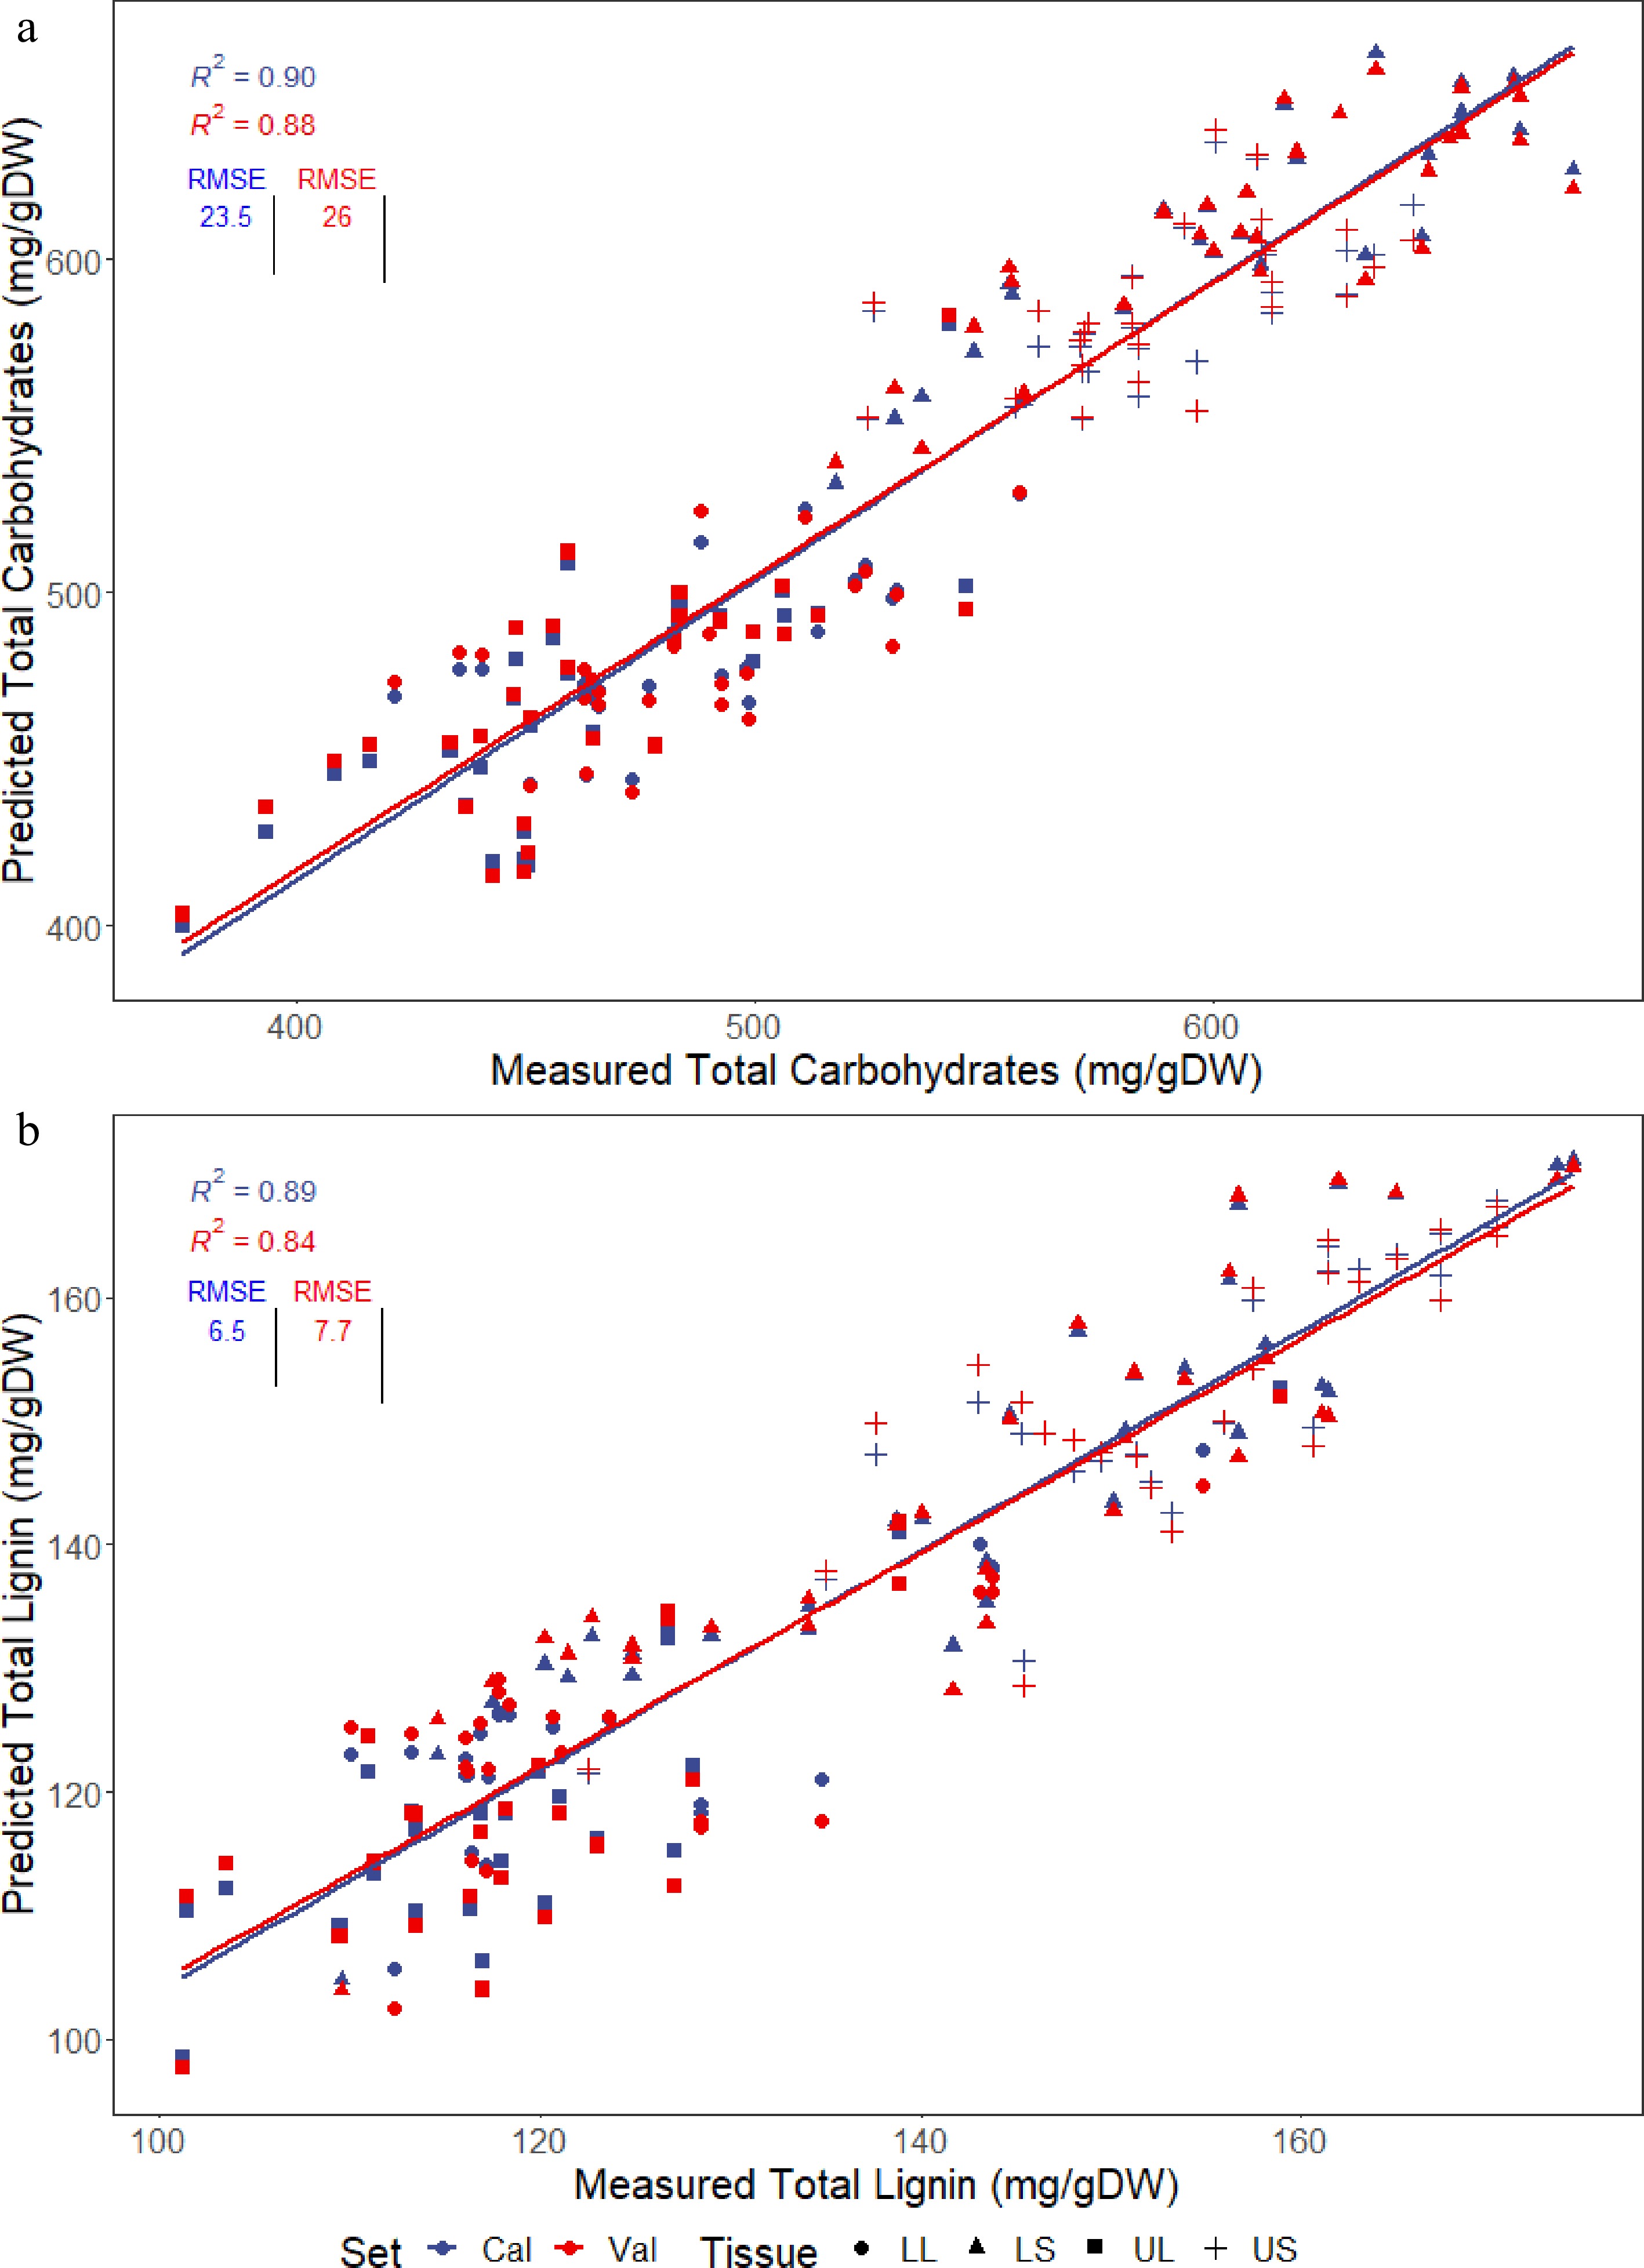
Figure 2.
PLSR models generated for predicting the two major cell wall components, (a) total lignin and (b) total carbohydrates, present in four different tissues of multiple Cenchrus accessions; lower stem (LS), lower leaf (LL), upper stem (US) and upper leaf (UL). Plots show calibration predictions (cal) as well as cross-validated predictions (val) used to evaluate the accuracy of the models, with the R2 and RMSE displayed.
-
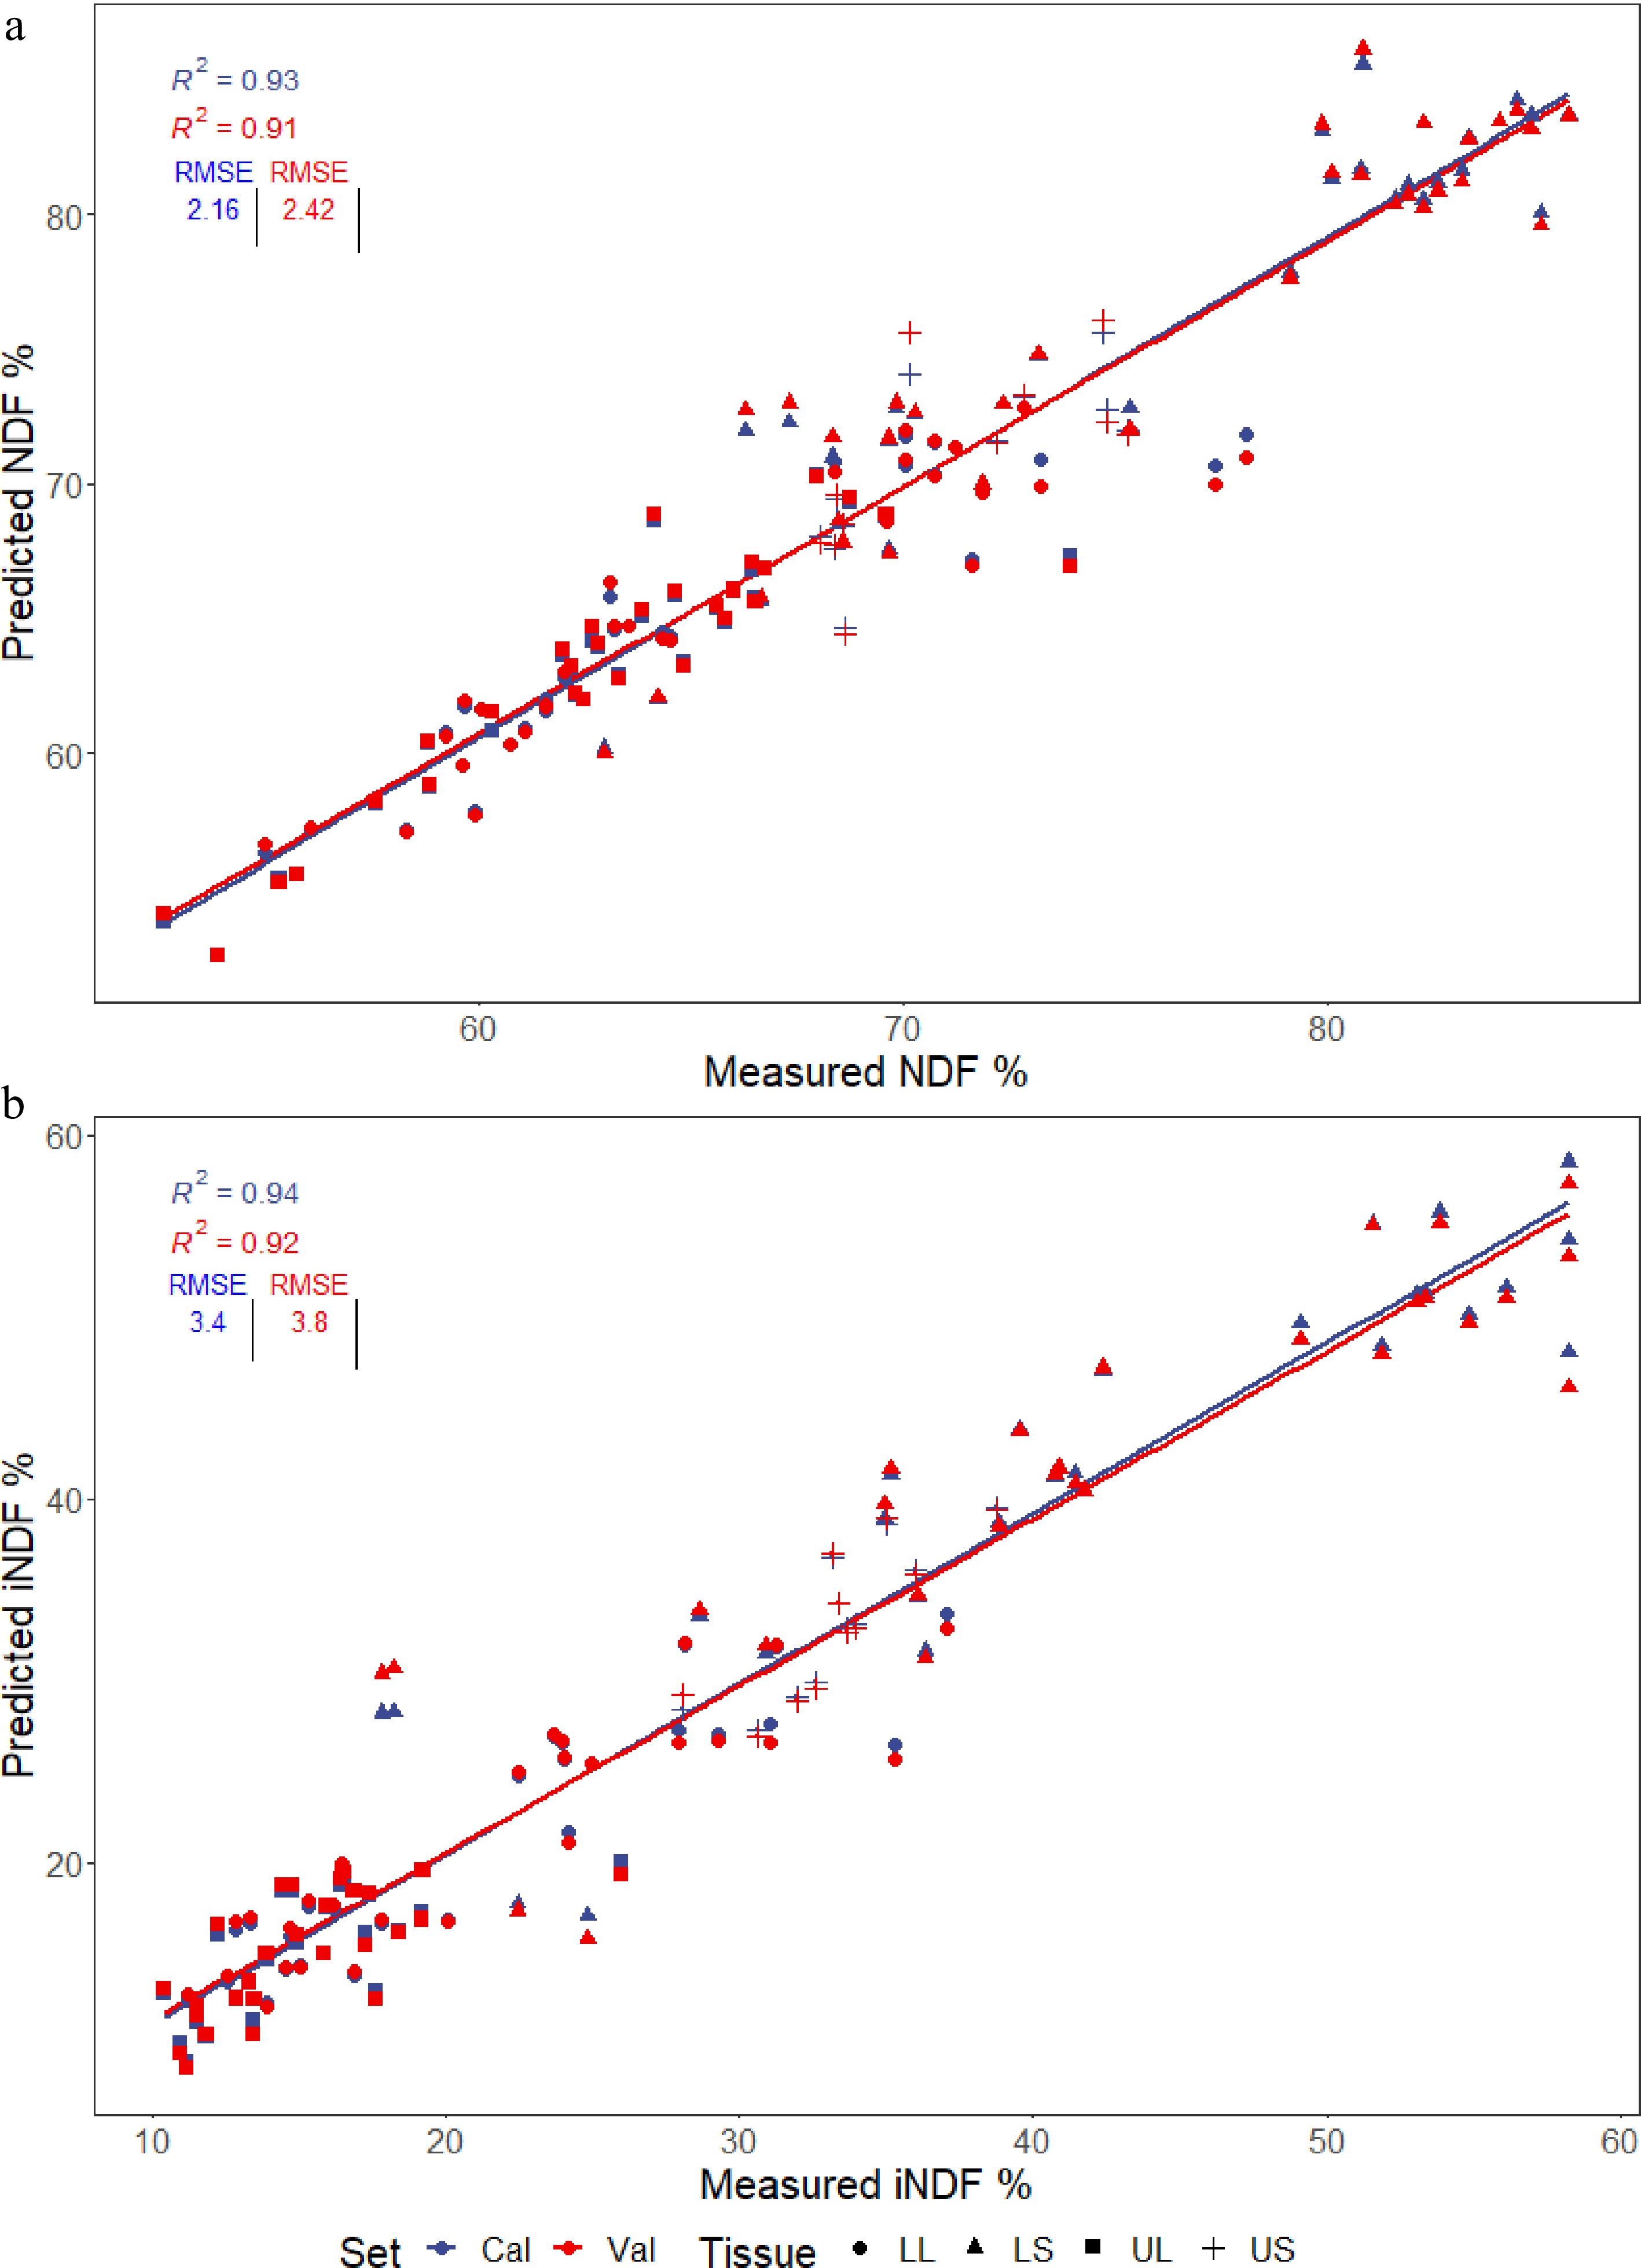
Figure 3.
PLSR models generated for predicting the (a) NDF and (b) iNDF values present in four different tissues of multiple Cenchrus accessions; lower stem (LS), lower leaf (LL), upper stem (US), and upper leaf (UL). Plots show calibration and cross-validated predictions used to evaluate the accuracy of the models, with the R2 and RMSE displayed.
-
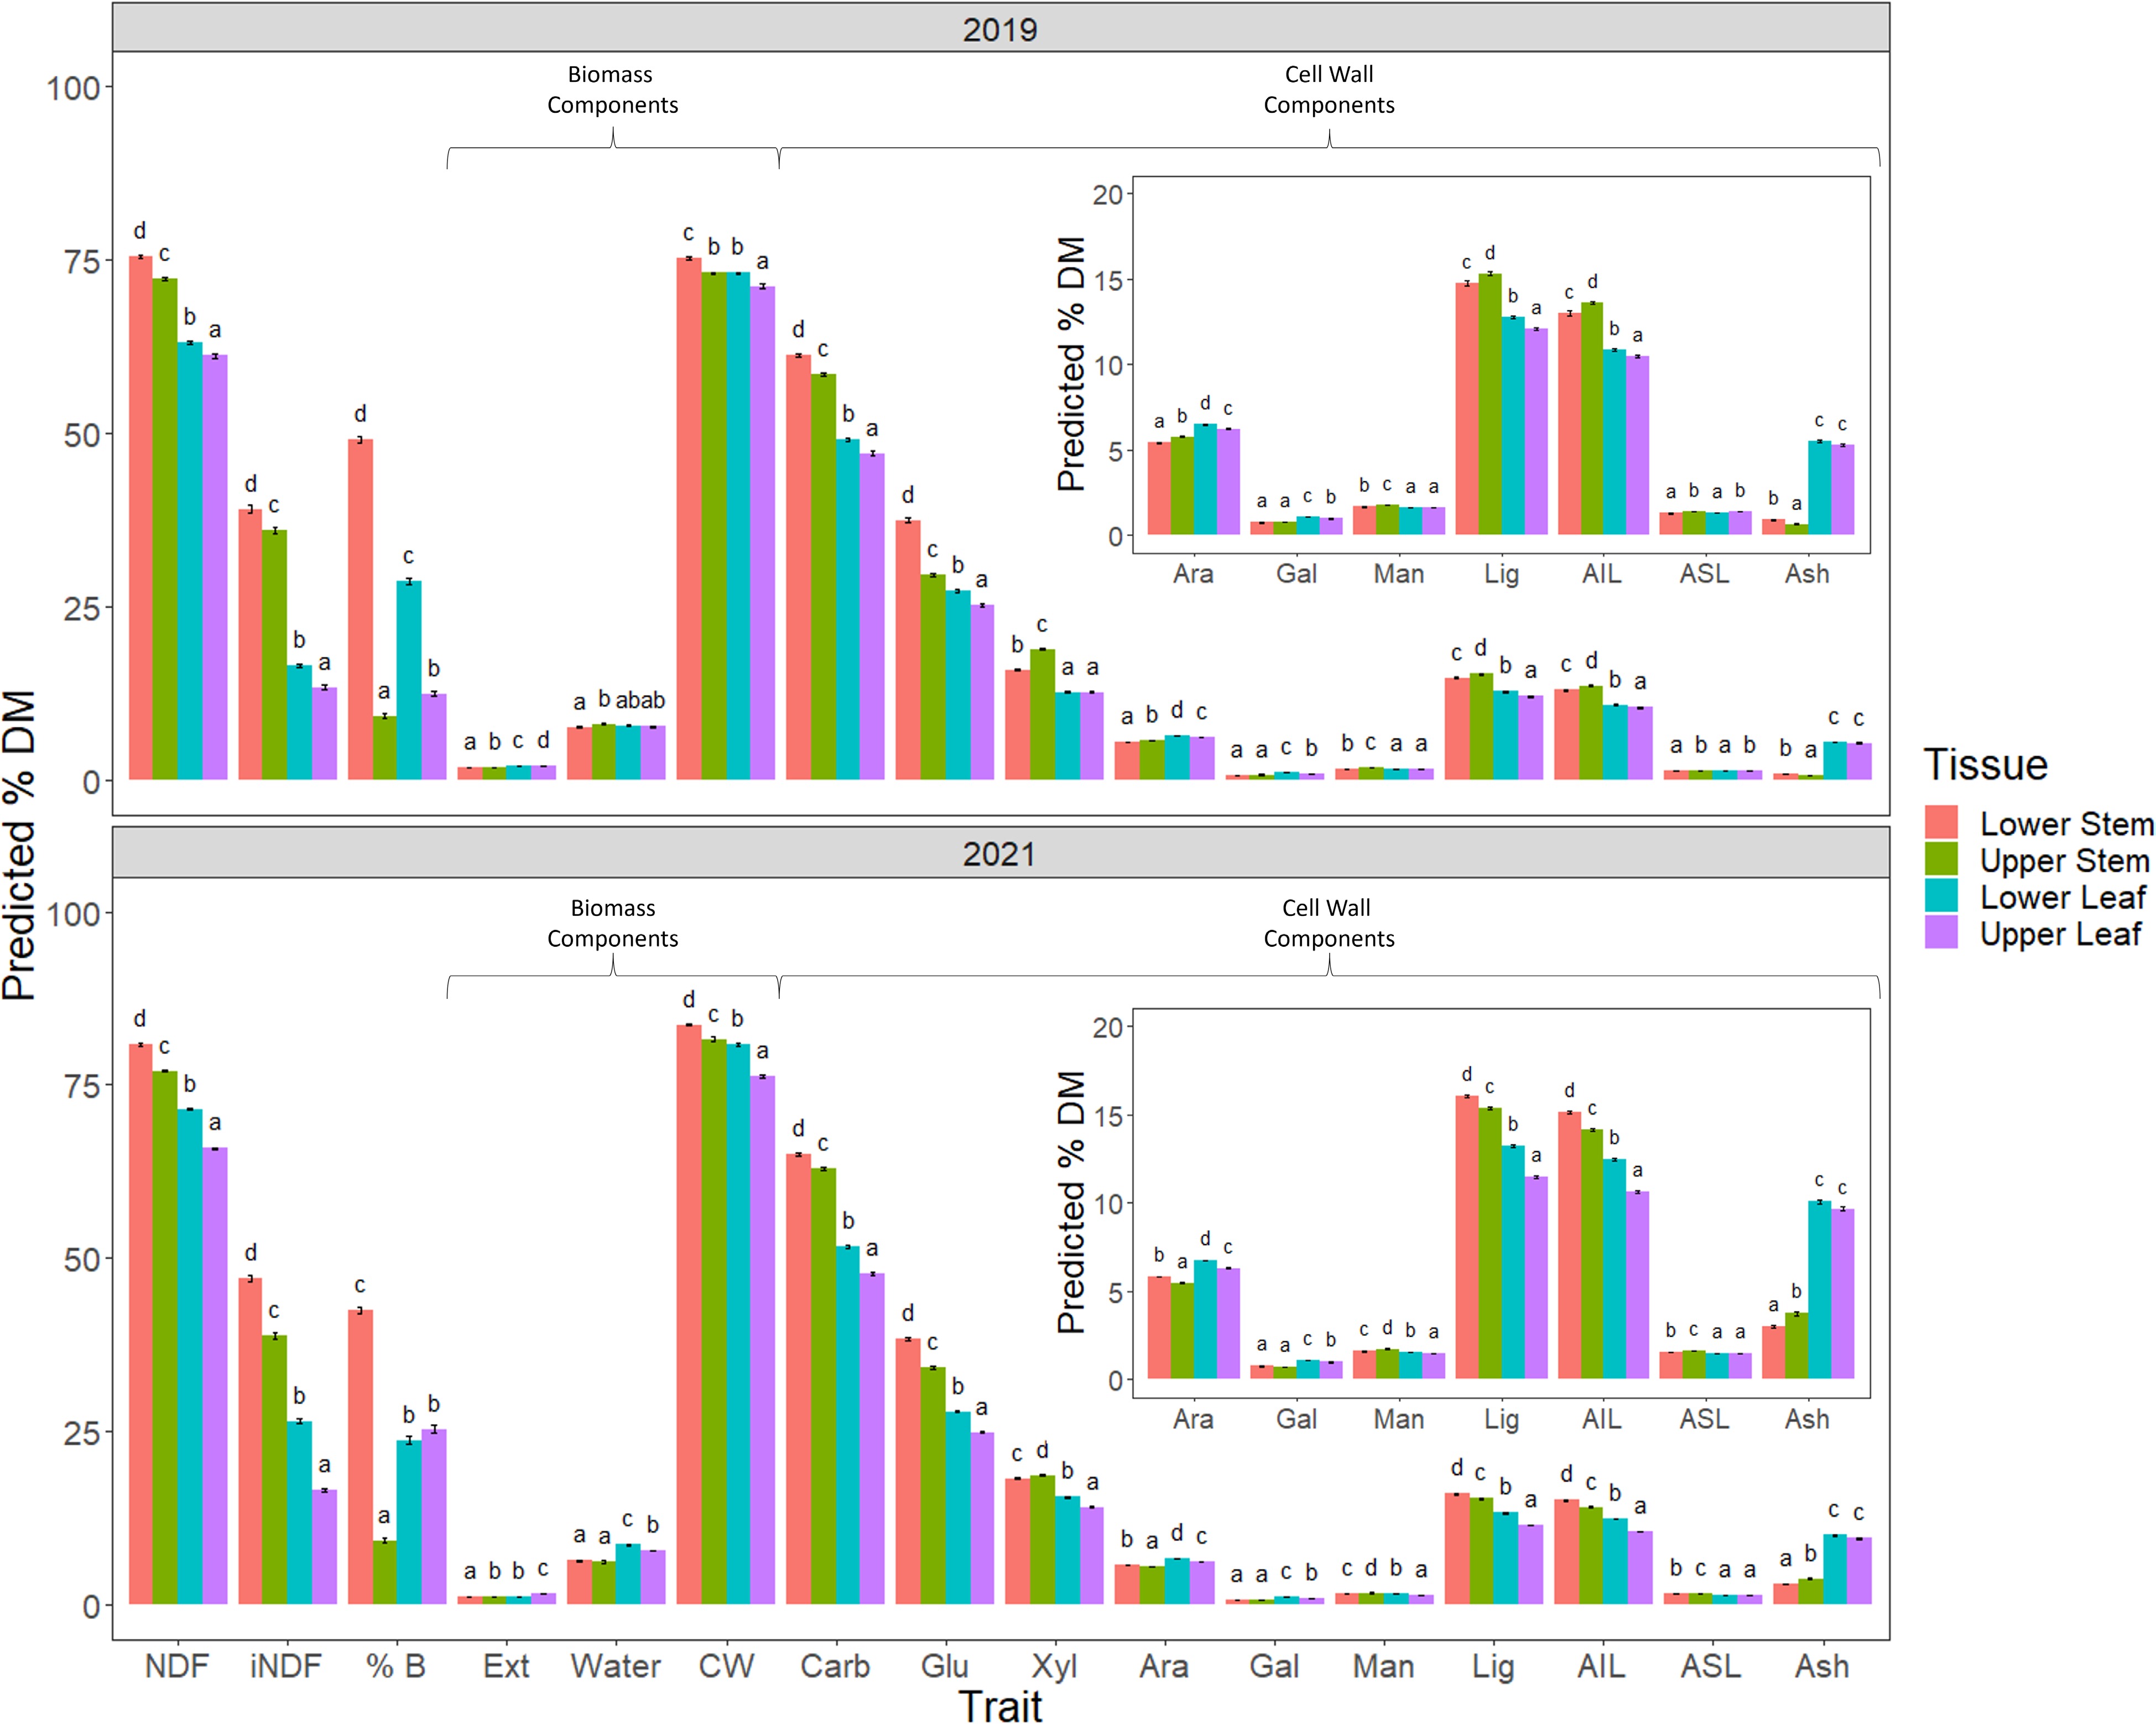
Figure 4.
Comparison of 2019 and 2021 harvests. The following traits were assessed NDF, iNDF, %B - % biomass of individual tissue type, biomass components; Ext - extractive, Water and CW - cell wall and cell wall composition Carb - total cell wall carbohydrates; Glu - glucan, Xyl - xylan, Ara - arabinan, Gal - galactan, Man - mannan, Lig - total lignin, acid insoluble lignin (AIL) and acid soluble lignin, (ASL) and the remaining cell wall component Ash of the measured tissue types. A number of cell wall traits were significantly different for all tissues, with stem having higher concentrations than leaf tissue with the exception of arabinan and ash. These latter two components were significantly higher in leaf than in stem for both years harvested. NDF and iNDF were also significantly different, with lower strata being higher than the upper strata for both stem and leaf tissues. Significance was determined by beta regression analysis and Tukey post hoc analysis of each trait across the four tissues.
-
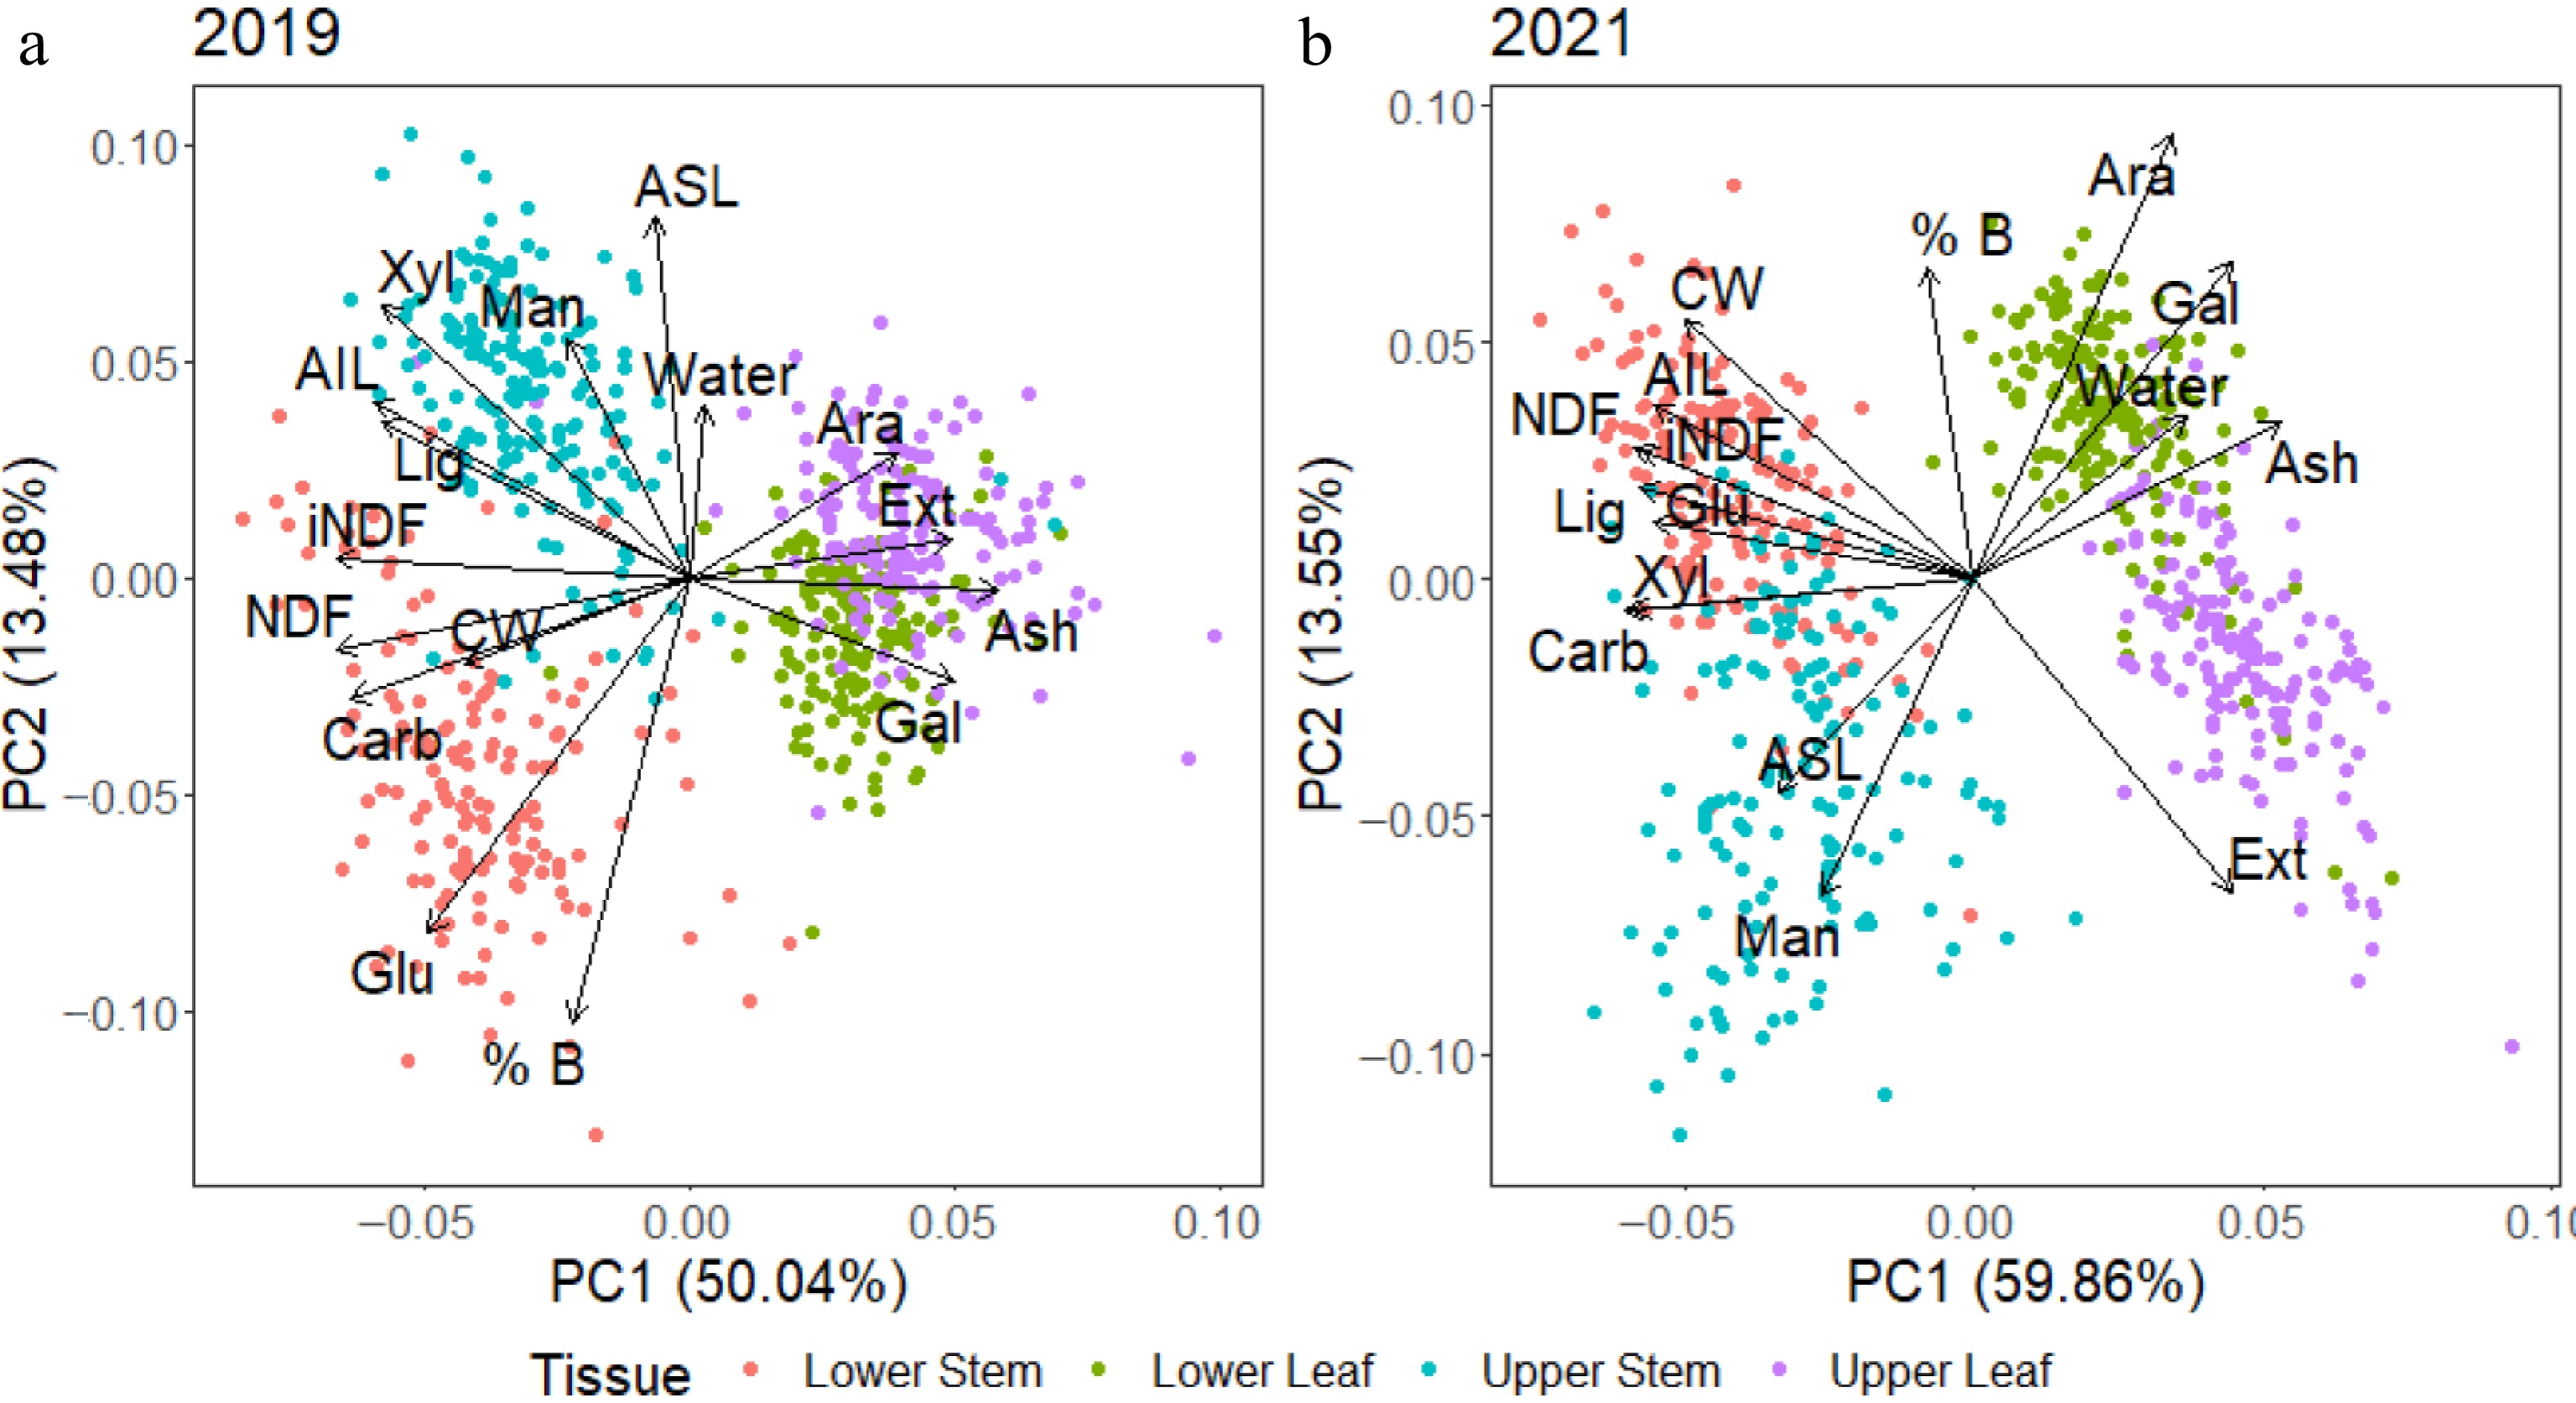
Figure 5.
Principal component analysis (PCA) of data from 2019 and 2021 harvests with both years showing differences between stem and leaf. Stem tissue had higher concentrations of most components than leaf tissue with the exception of arabinan, galactan, ash and extractives which were predicted to be present at higher concentrations in leaf tissue. From the 2019 harvest, there were also differences in the lower and upper stem tissue, with the lower stem tissue associated with higher glucan and % biomass and the upper stem more highly associated with glucan and lignin.
-
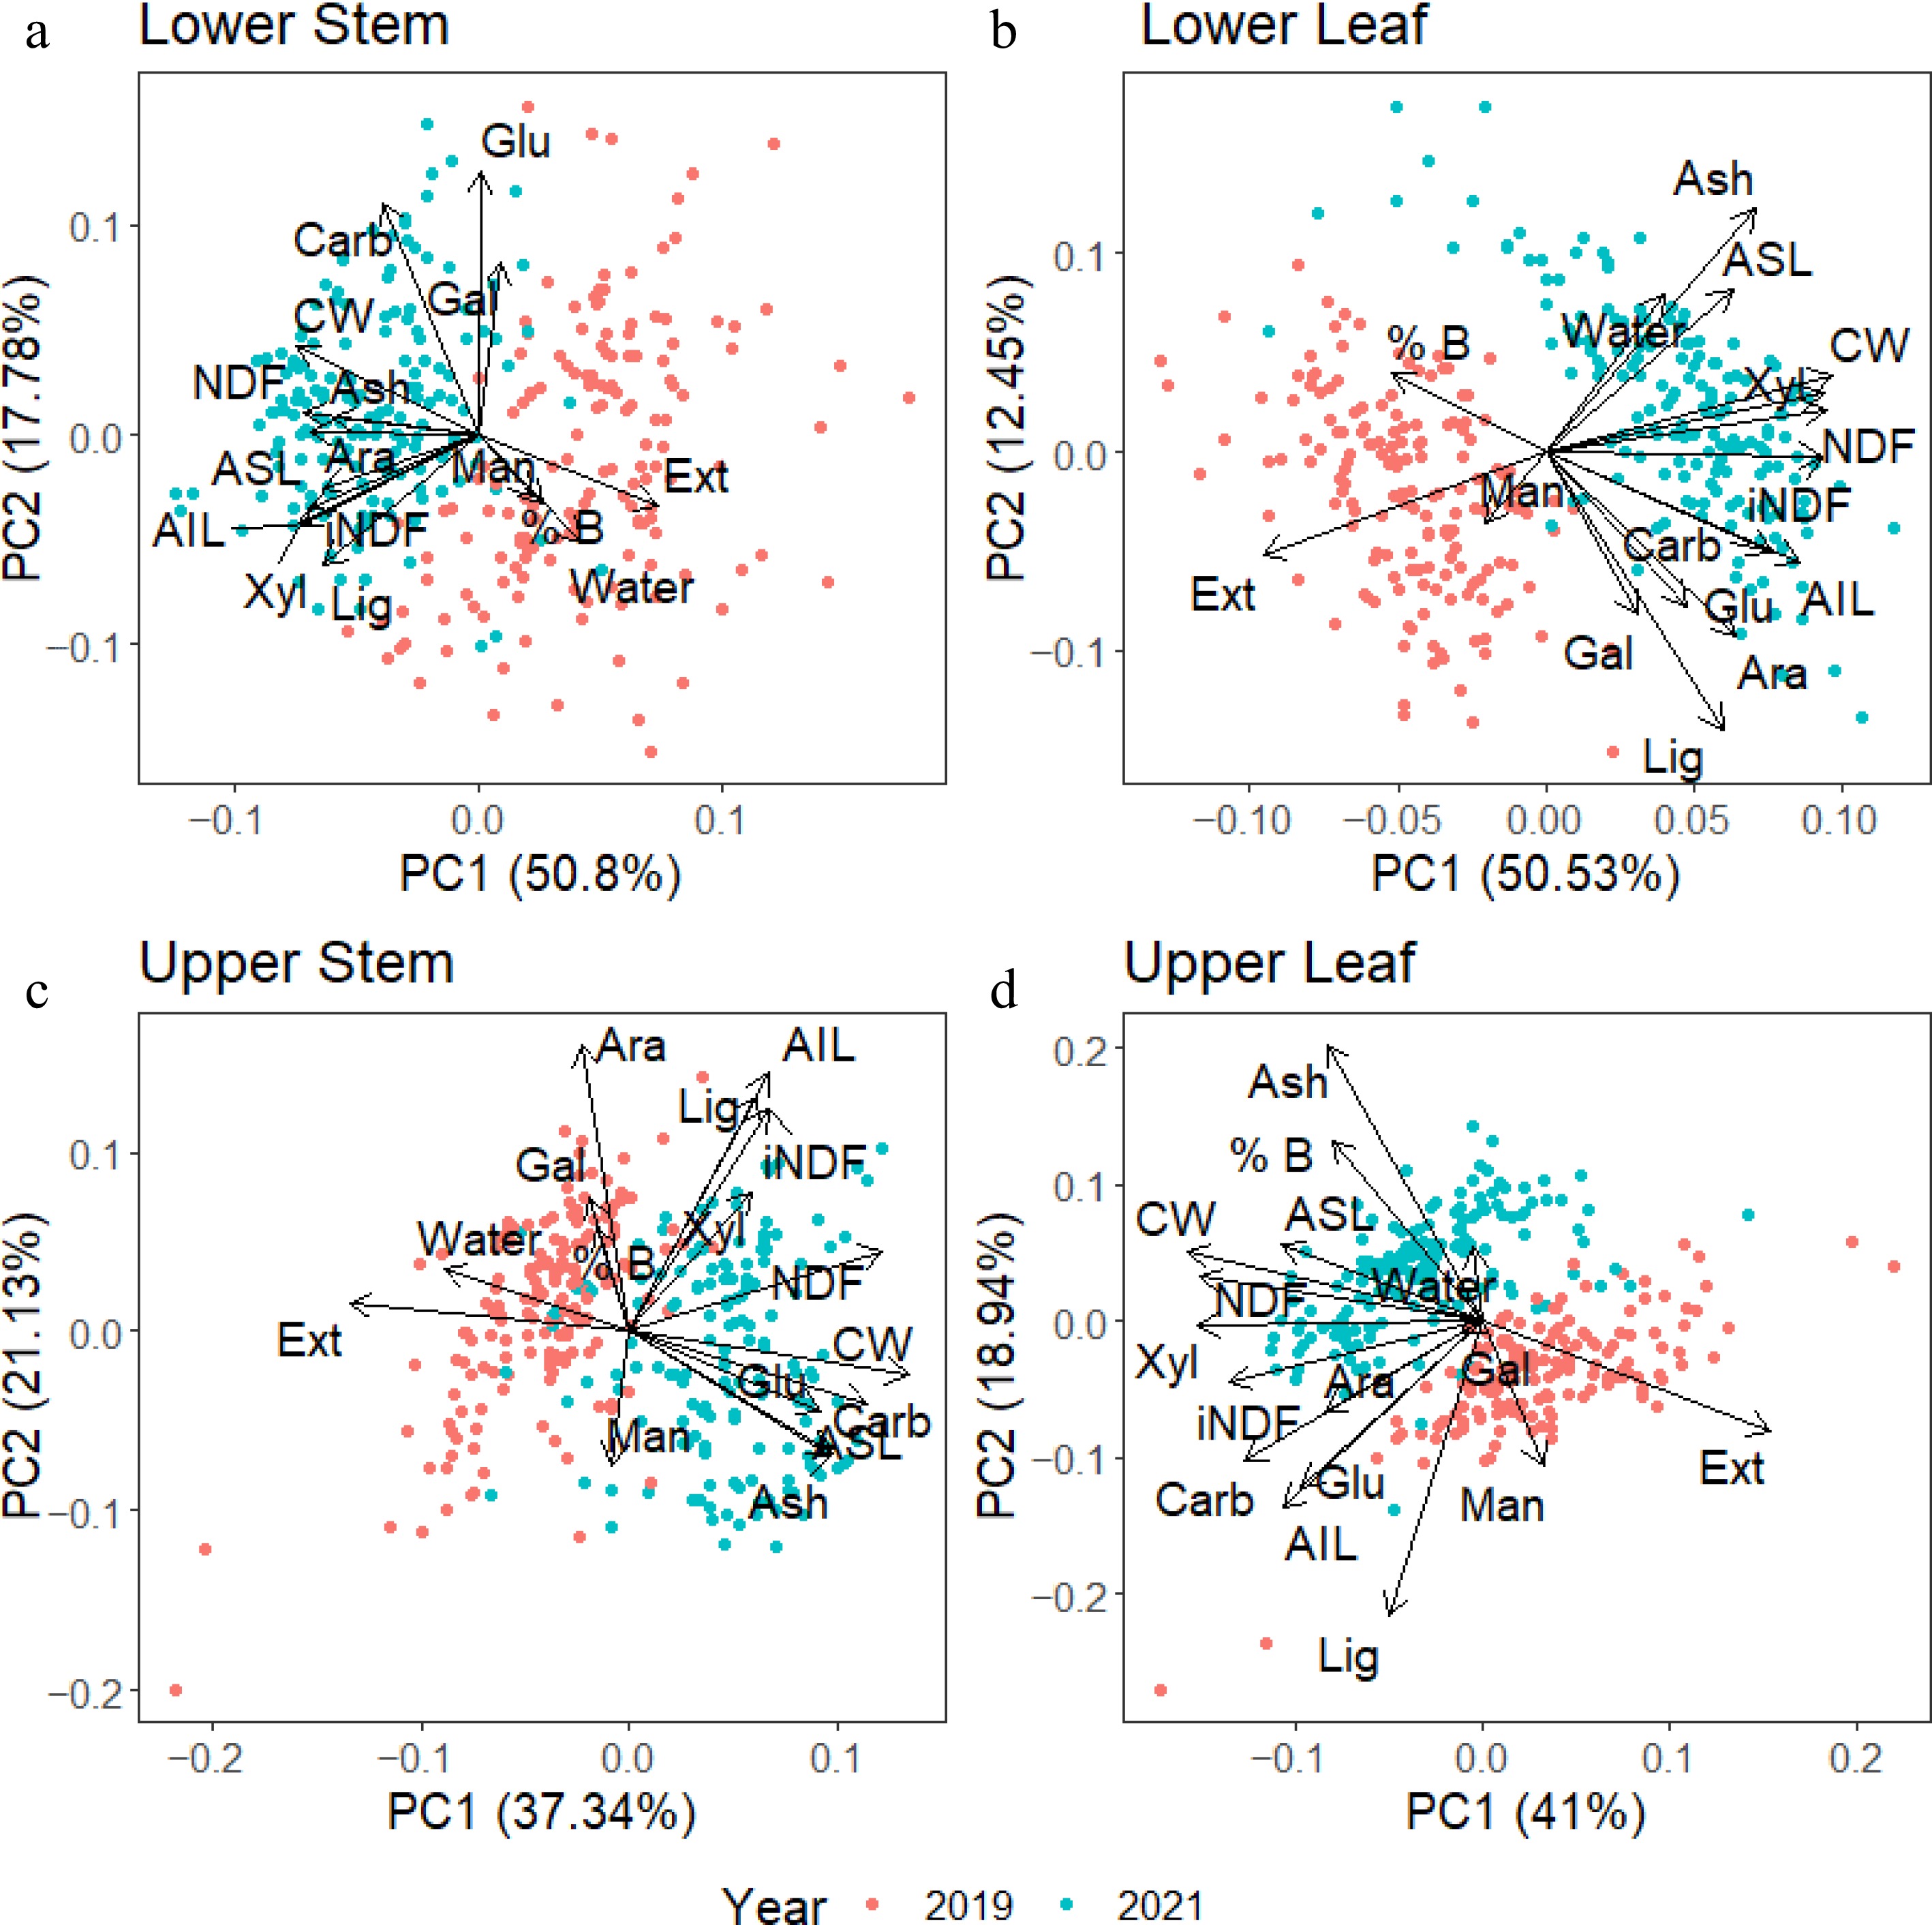
Figure 6.
Principal component analysis (PCA) of individual tissues from samples collected in 2019 (red) and 2021(blue). Overall, the 2019 harvest had higher extractive and lower CW content than the 2021 harvest. Lignin and xylan associated strongly with iNDF in stem tissues. In contrast, only xylan was strongly associated with iNDF in the leaf tissues. NDF was strongly associated with CW concentrations in all tissues, with a weaker correlation in the upper stem.
Figures
(6)
Tables
(0)