-
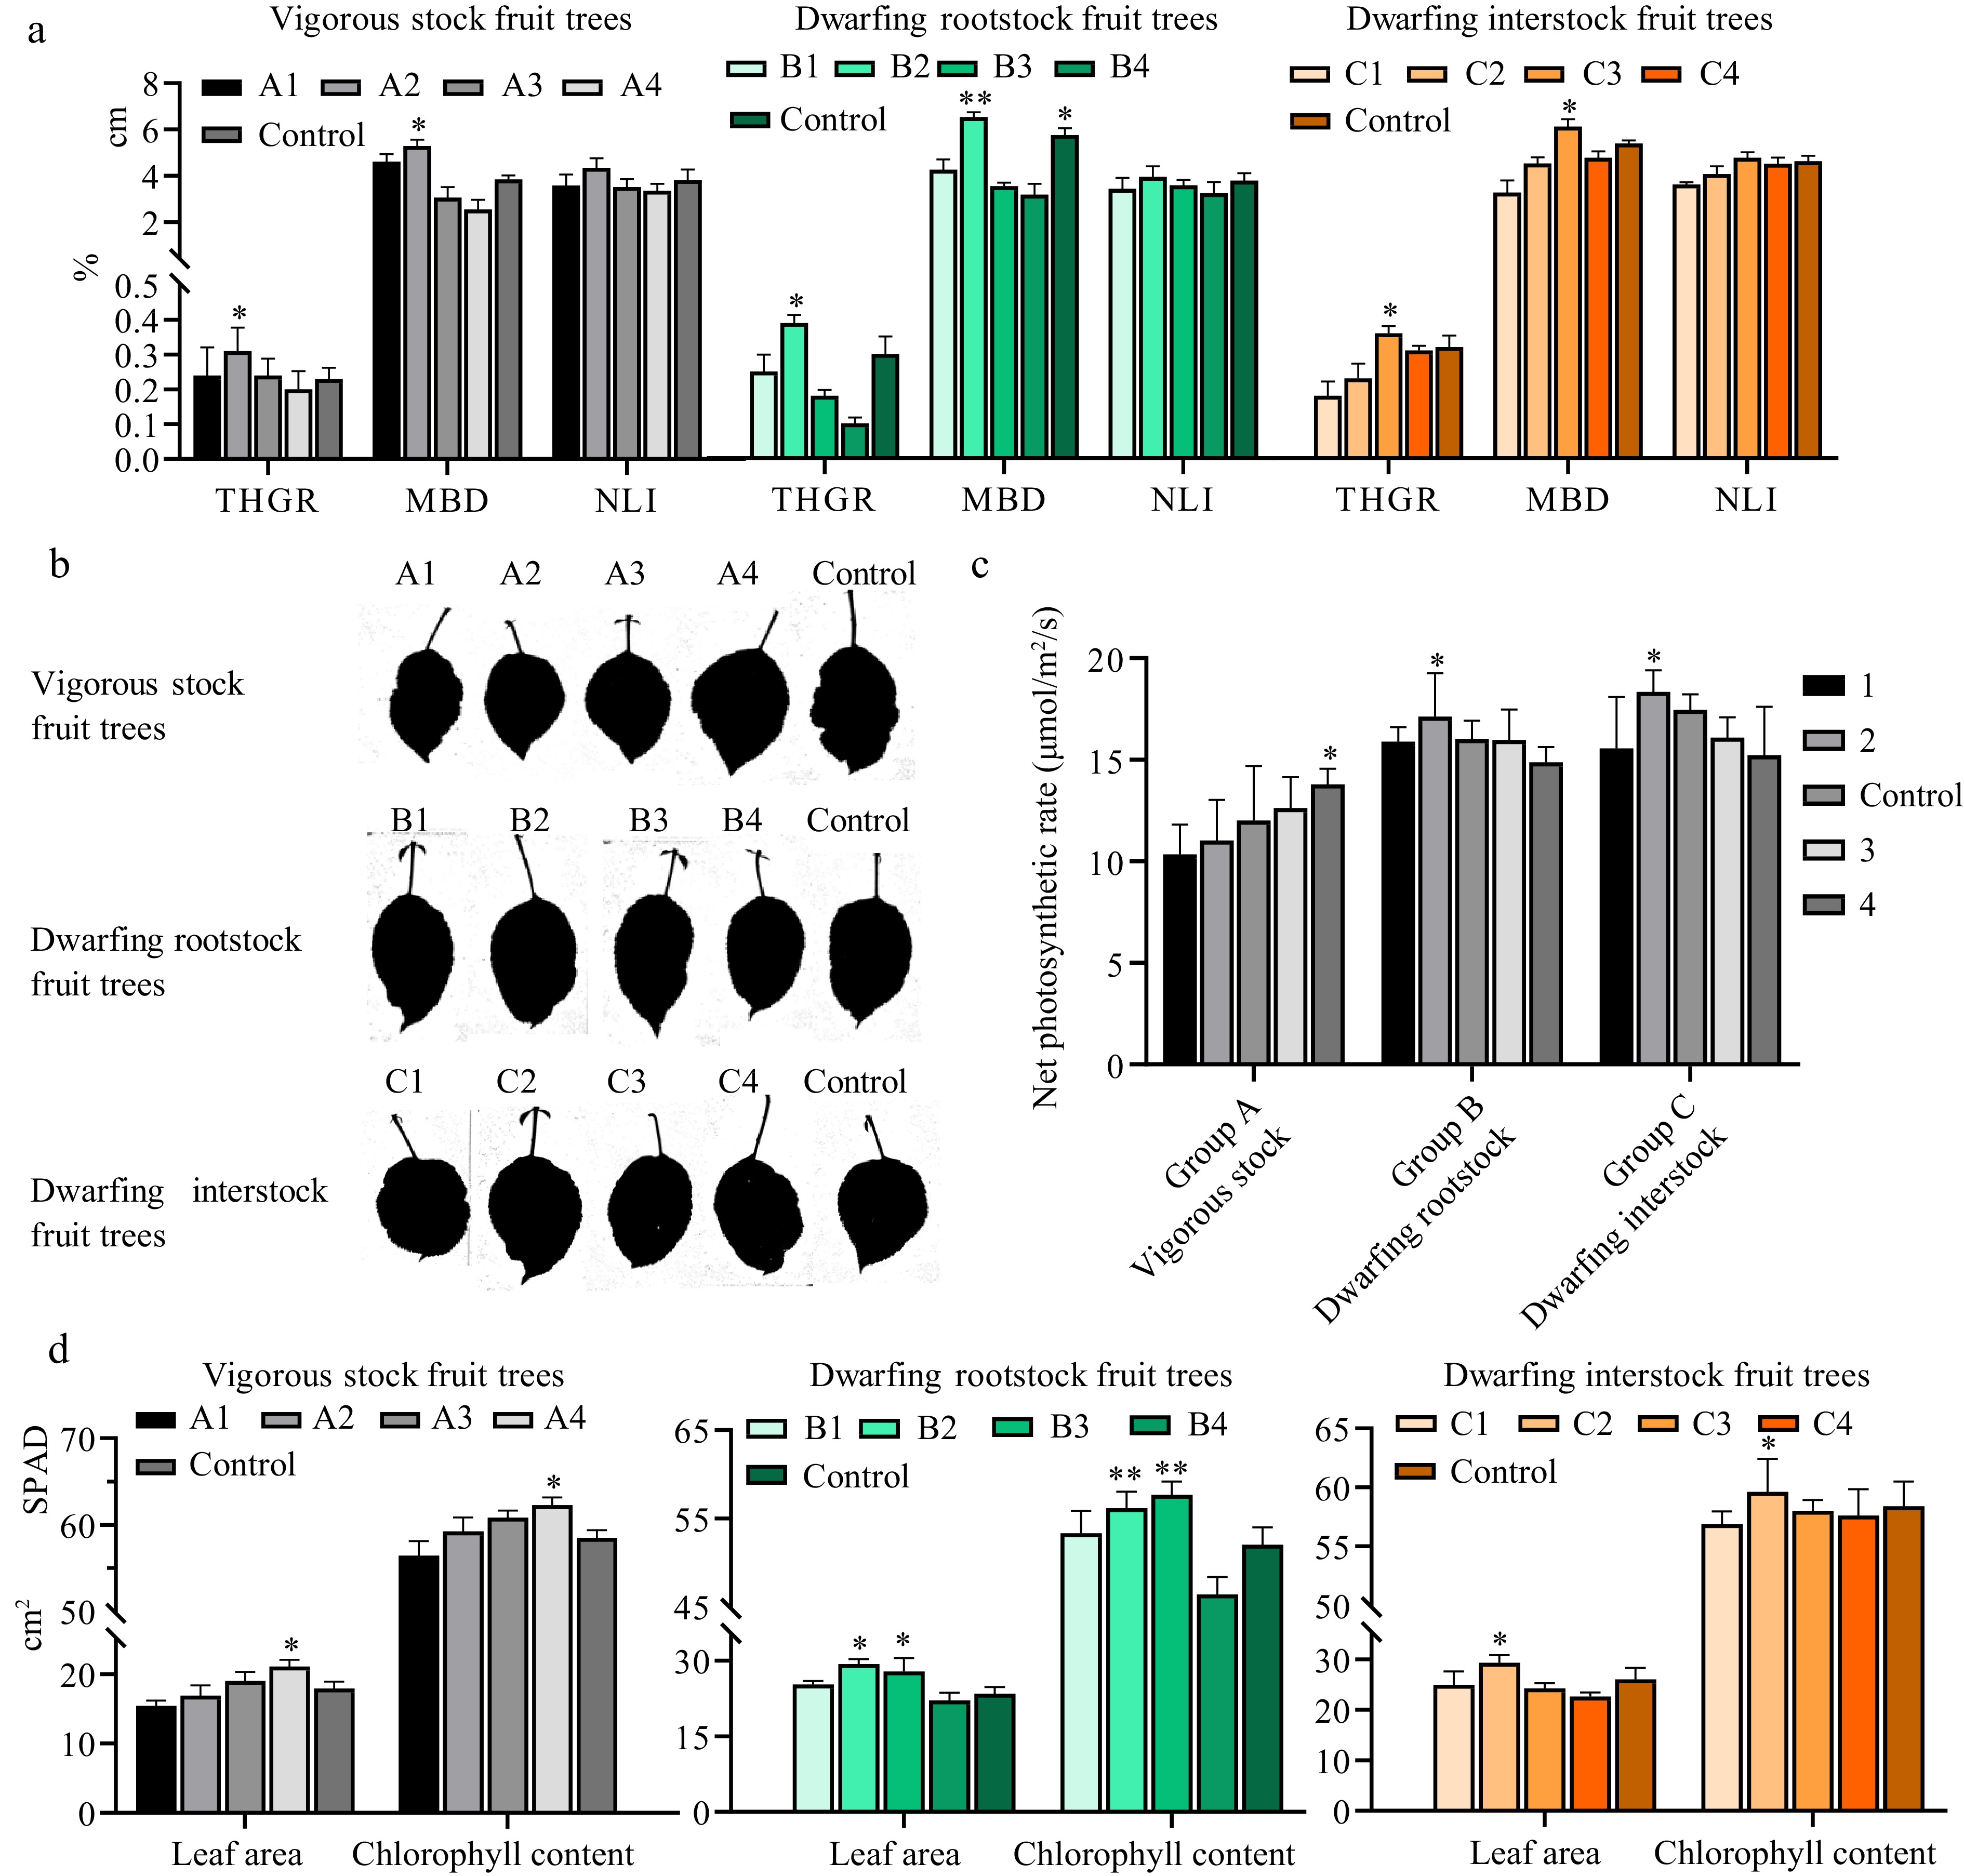
Figure 1.
Effect of different crop load on the development of tree and leaves. (a) Tree characteristics of three cultivation types under different loads. The lower half of the y-axis represents THGR (Tree Height Growth Rate). and the upper half of the y-axis represents MBD (Main branch diameter increment) and NLI (New length increment). Vigorous stock, dwarfing rootstock and dwarfing interstock are shown on the left, middle, and right, respectively. (b) Leaf area scanning of three rootstock types under different loads and control. (c) Net photosynthetic rate of three rootstock types under different loads and control. (d) Leaf area and chlorophyll content of three rootstock types under different loads and control. The lower half of the y-axis represents leaf area and the upper half of the y-axis represents chlorophyll content. In the vigorous stock apple trees, A1 represents 240, A2 (320), A3 (480), A4 (560), and control (400). B1 represents 90, B2 (110), B3 (150), B4 (170), and control (130) for the dwarfing rootstock apple trees. C1 represents 100, C2 (150), C3 (210), C4 (260), and control (180) for the dwarfing rootstock apple trees. Asterisks indicate significant differences to the lowest data (Student's t-test; * p < 0.05 and ** p < 0.01).
-
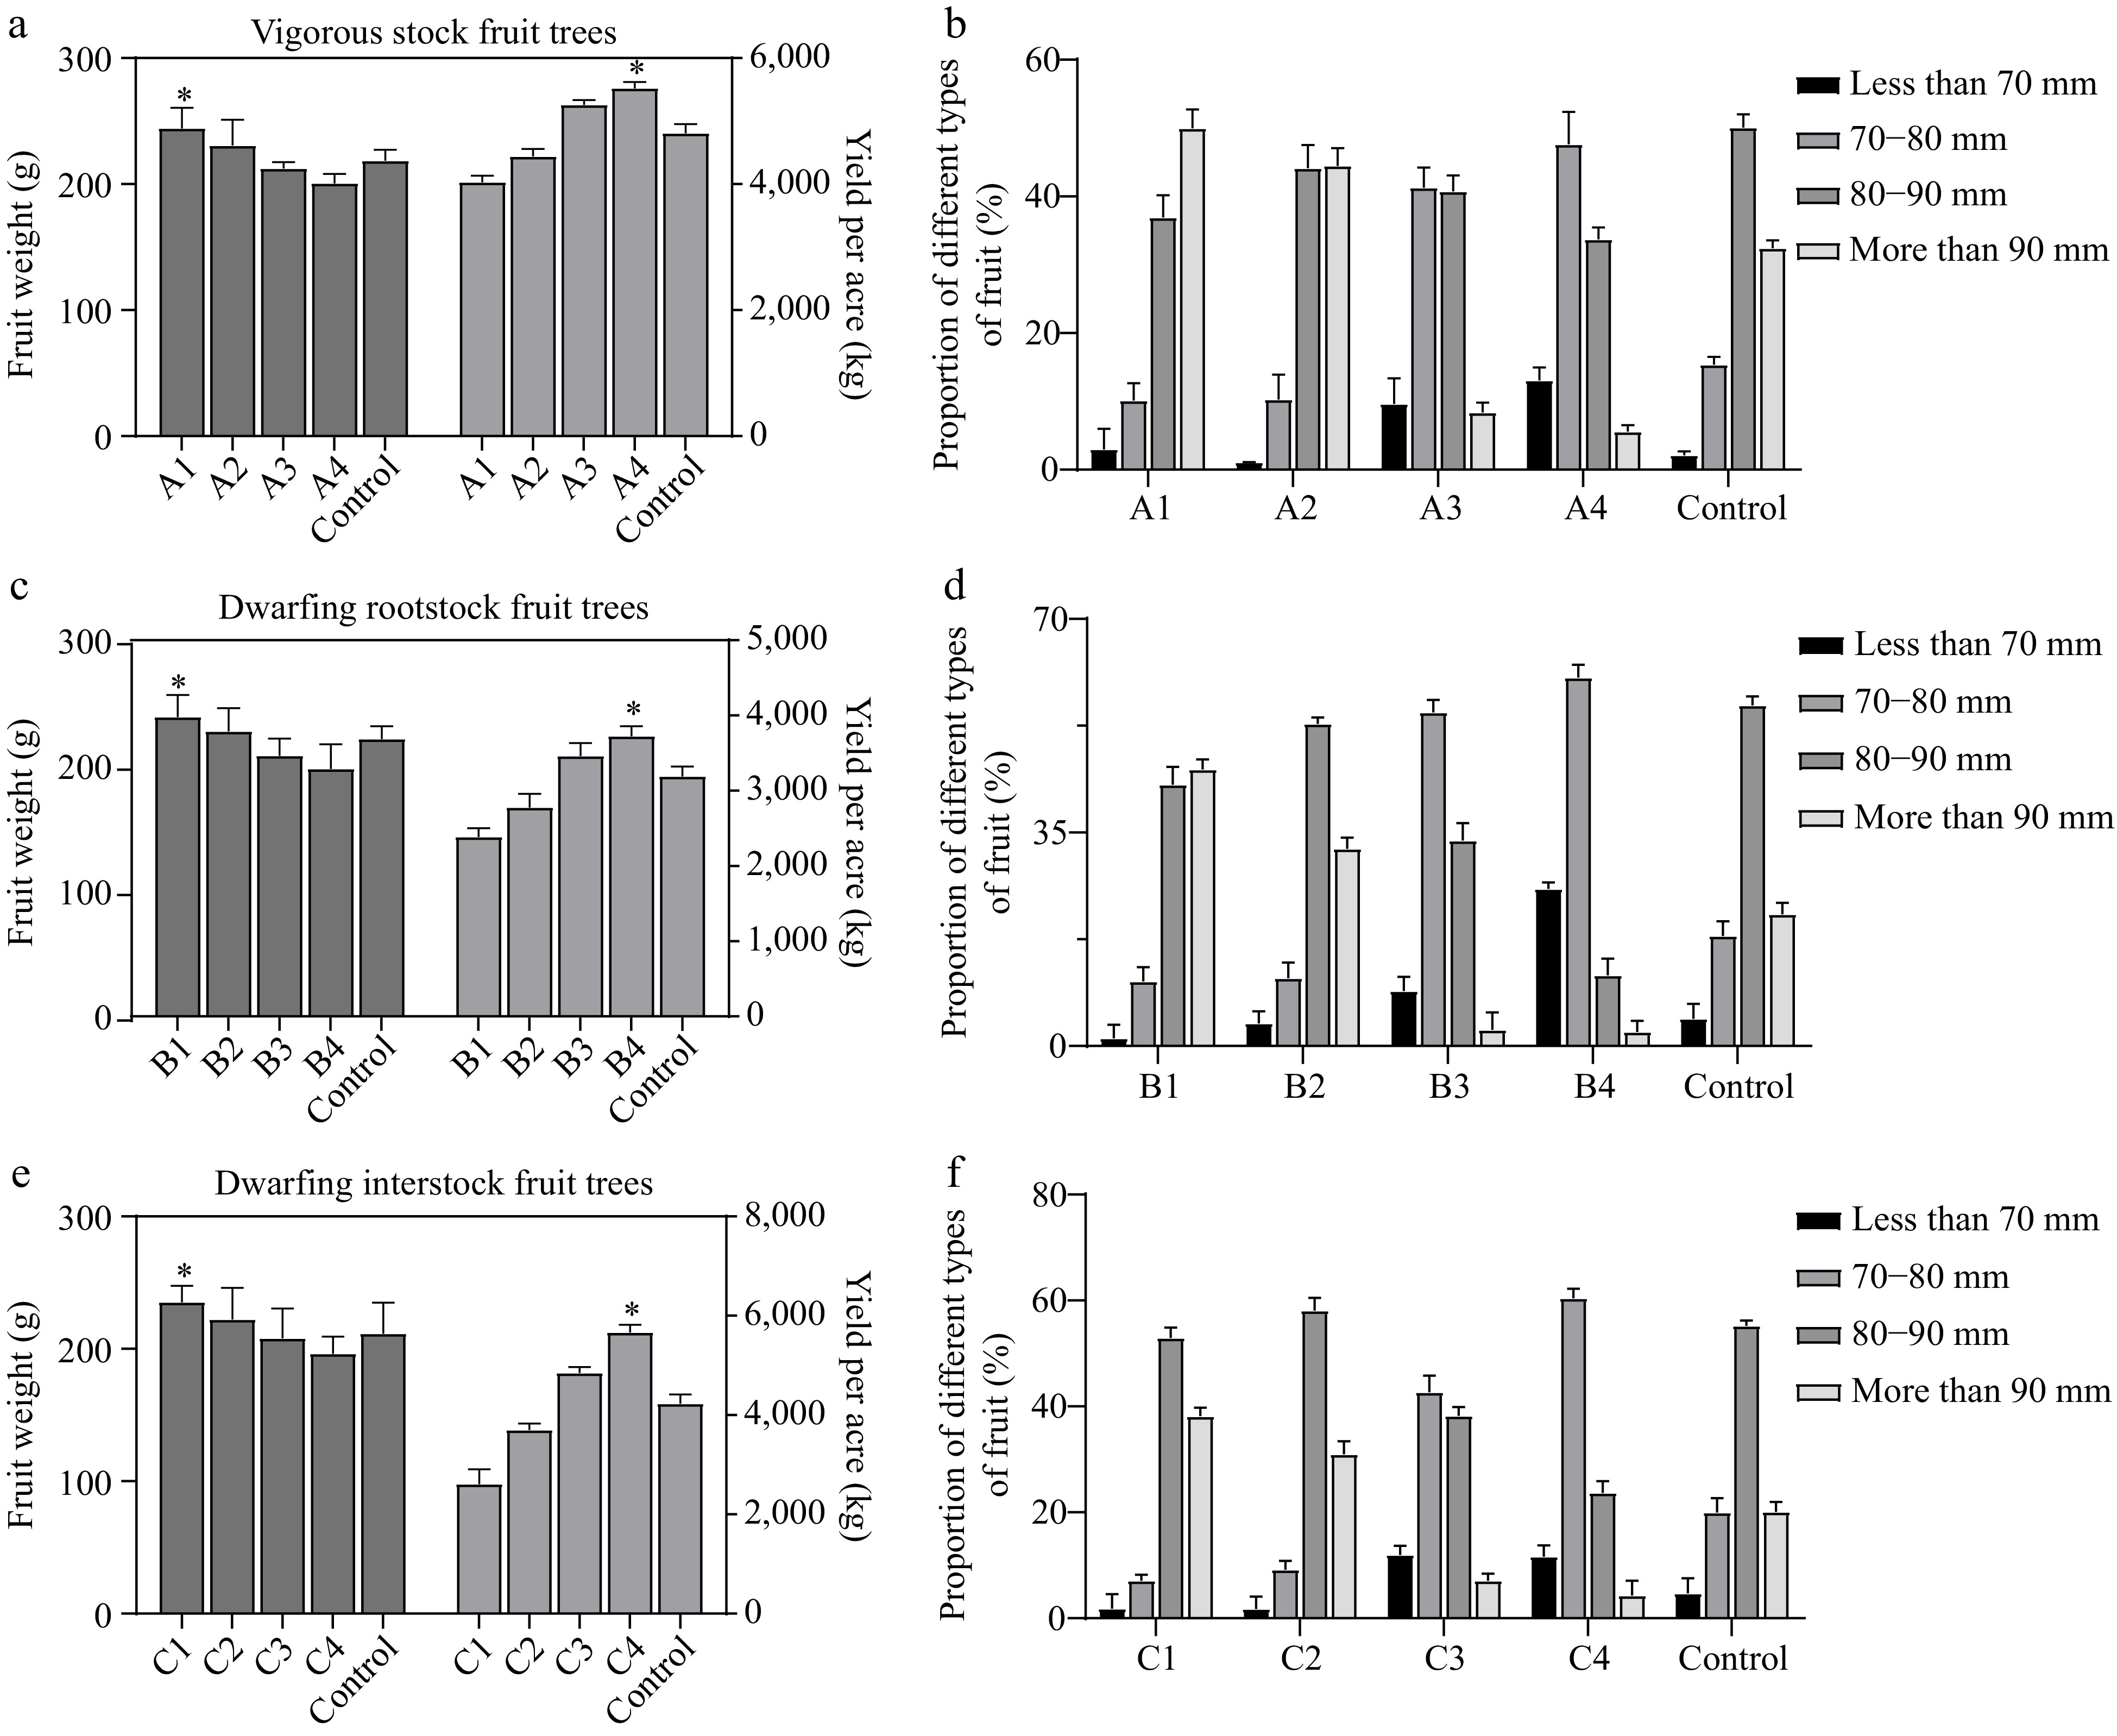
Figure 2.
Effect of different loadings on fruit. (a) Effect of different loadings on weight and yield of arborized fruits. (b) Effect of different loadings on fruiting types of vigorous stock fruit trees. (c) Effect of different loadings on fruit weight and yield of dwarf self-rooted rootstock. (d) Effect of different loadings on fruit type of dwarf self-rooted rootstock fruit trees. (e) Effect of different loadings on fruit weight and yield of dwarfing interstock. (f) Effect of different loadings on fruit type of dwarfing interstock fruit trees. For the different degrees of crop load, 240, 320, 480, 560, and 400 for A1−A4 and control for vigorous stock fruit trees. The fruit retention of dwarfing rootstock was divided into 90, 110, 150, 170, and 130 for B1−B4 and control, respectively. Meanwhile, 100, 150, 210, 260, and 180 for C1−C4 and control of the dwarfing interstock fruit trees, respectively. Asterisks indicate significant differences to the lowest data (Student's t-test; * p < 0.05).
-
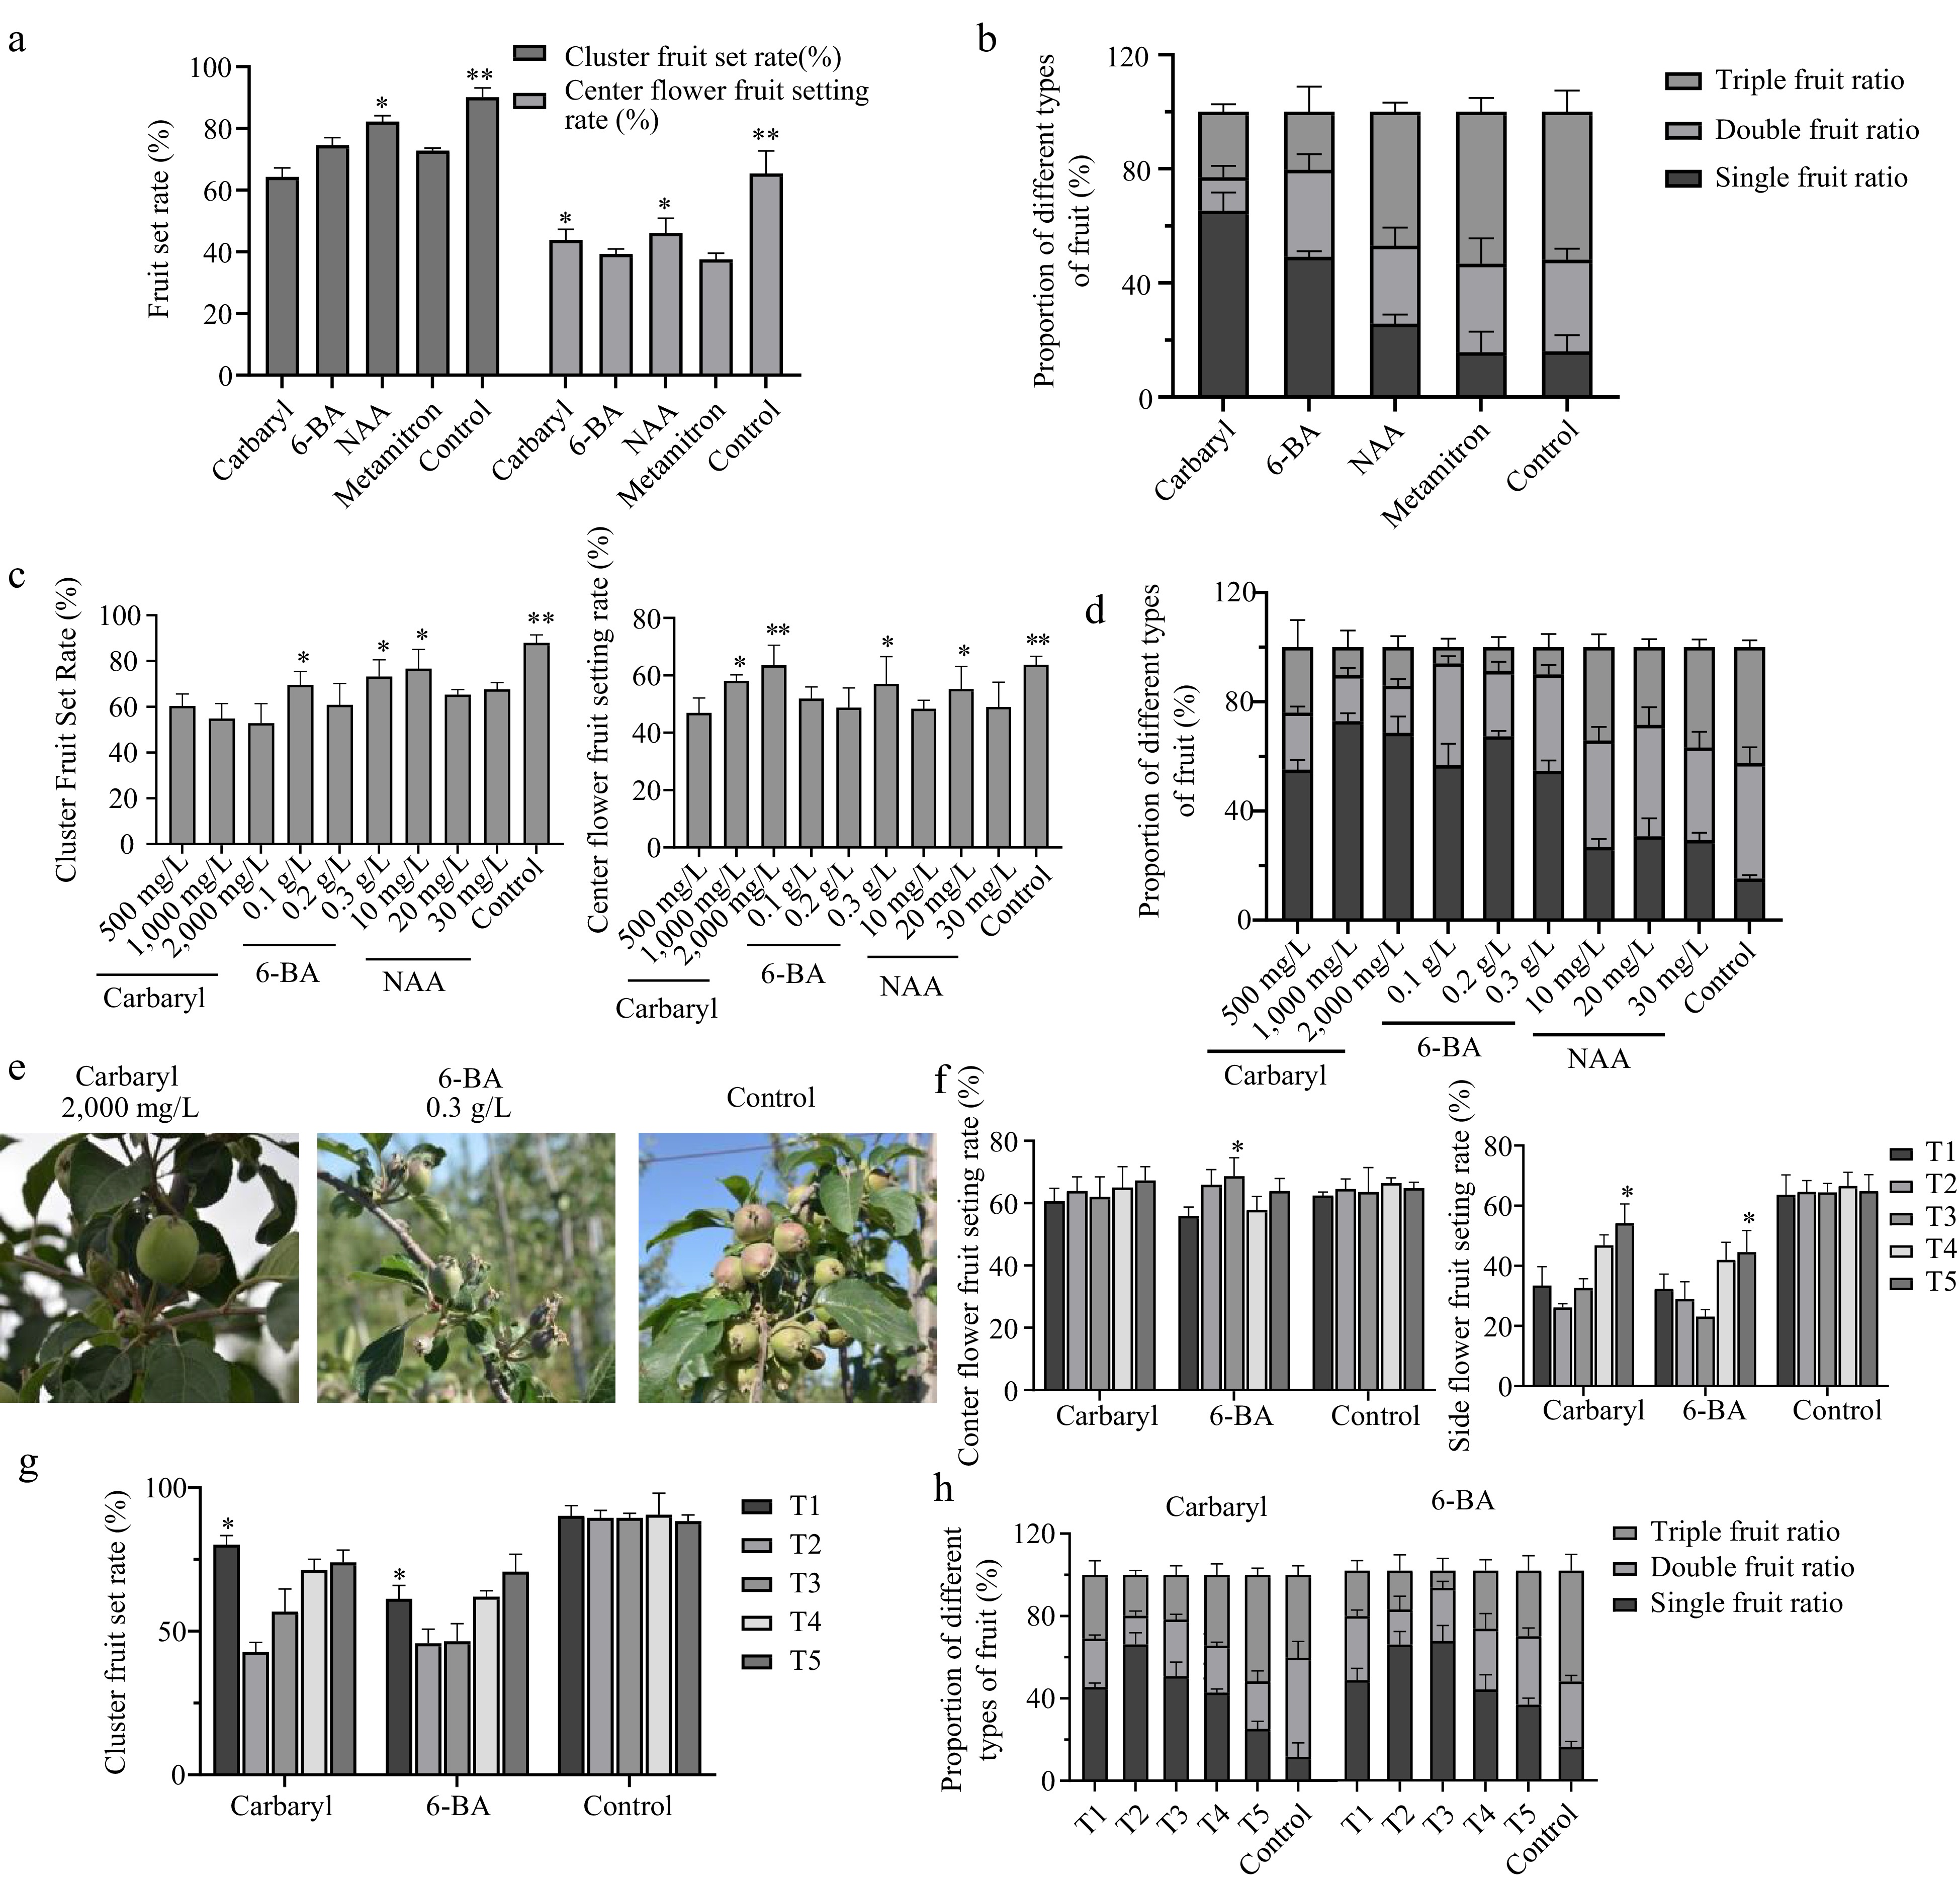
Figure 3.
Thinning effect of fruit thinning agents. (a) Cluster fruit set rate and center flower setting rate of different kinds of fruit thinners. (b) The proportion of different types of fruits with different types of fruit thinning agents. (c) Cluster fruit set of different concentrations of fruit thinners. (d) Cluster fruit set rate and center flower setting rate with different concentrations of fruit thinning agents. (e) The proportion of different fruit types with different concentrations of fruit thinners. (f) Center and edge flower setting rate at different spraying times of fruit thinning agents. (g) Cluster fruit set rate at different spraying times of fruit thinning agent. (h) The proportion of different fruit types at different spraying times of fruit thinning agents (Carbaryl, 6-BA). Asterisks indicate significant differences to the lowest data (Student's t-test; * p < 0.05 and ** p < 0.01).
-
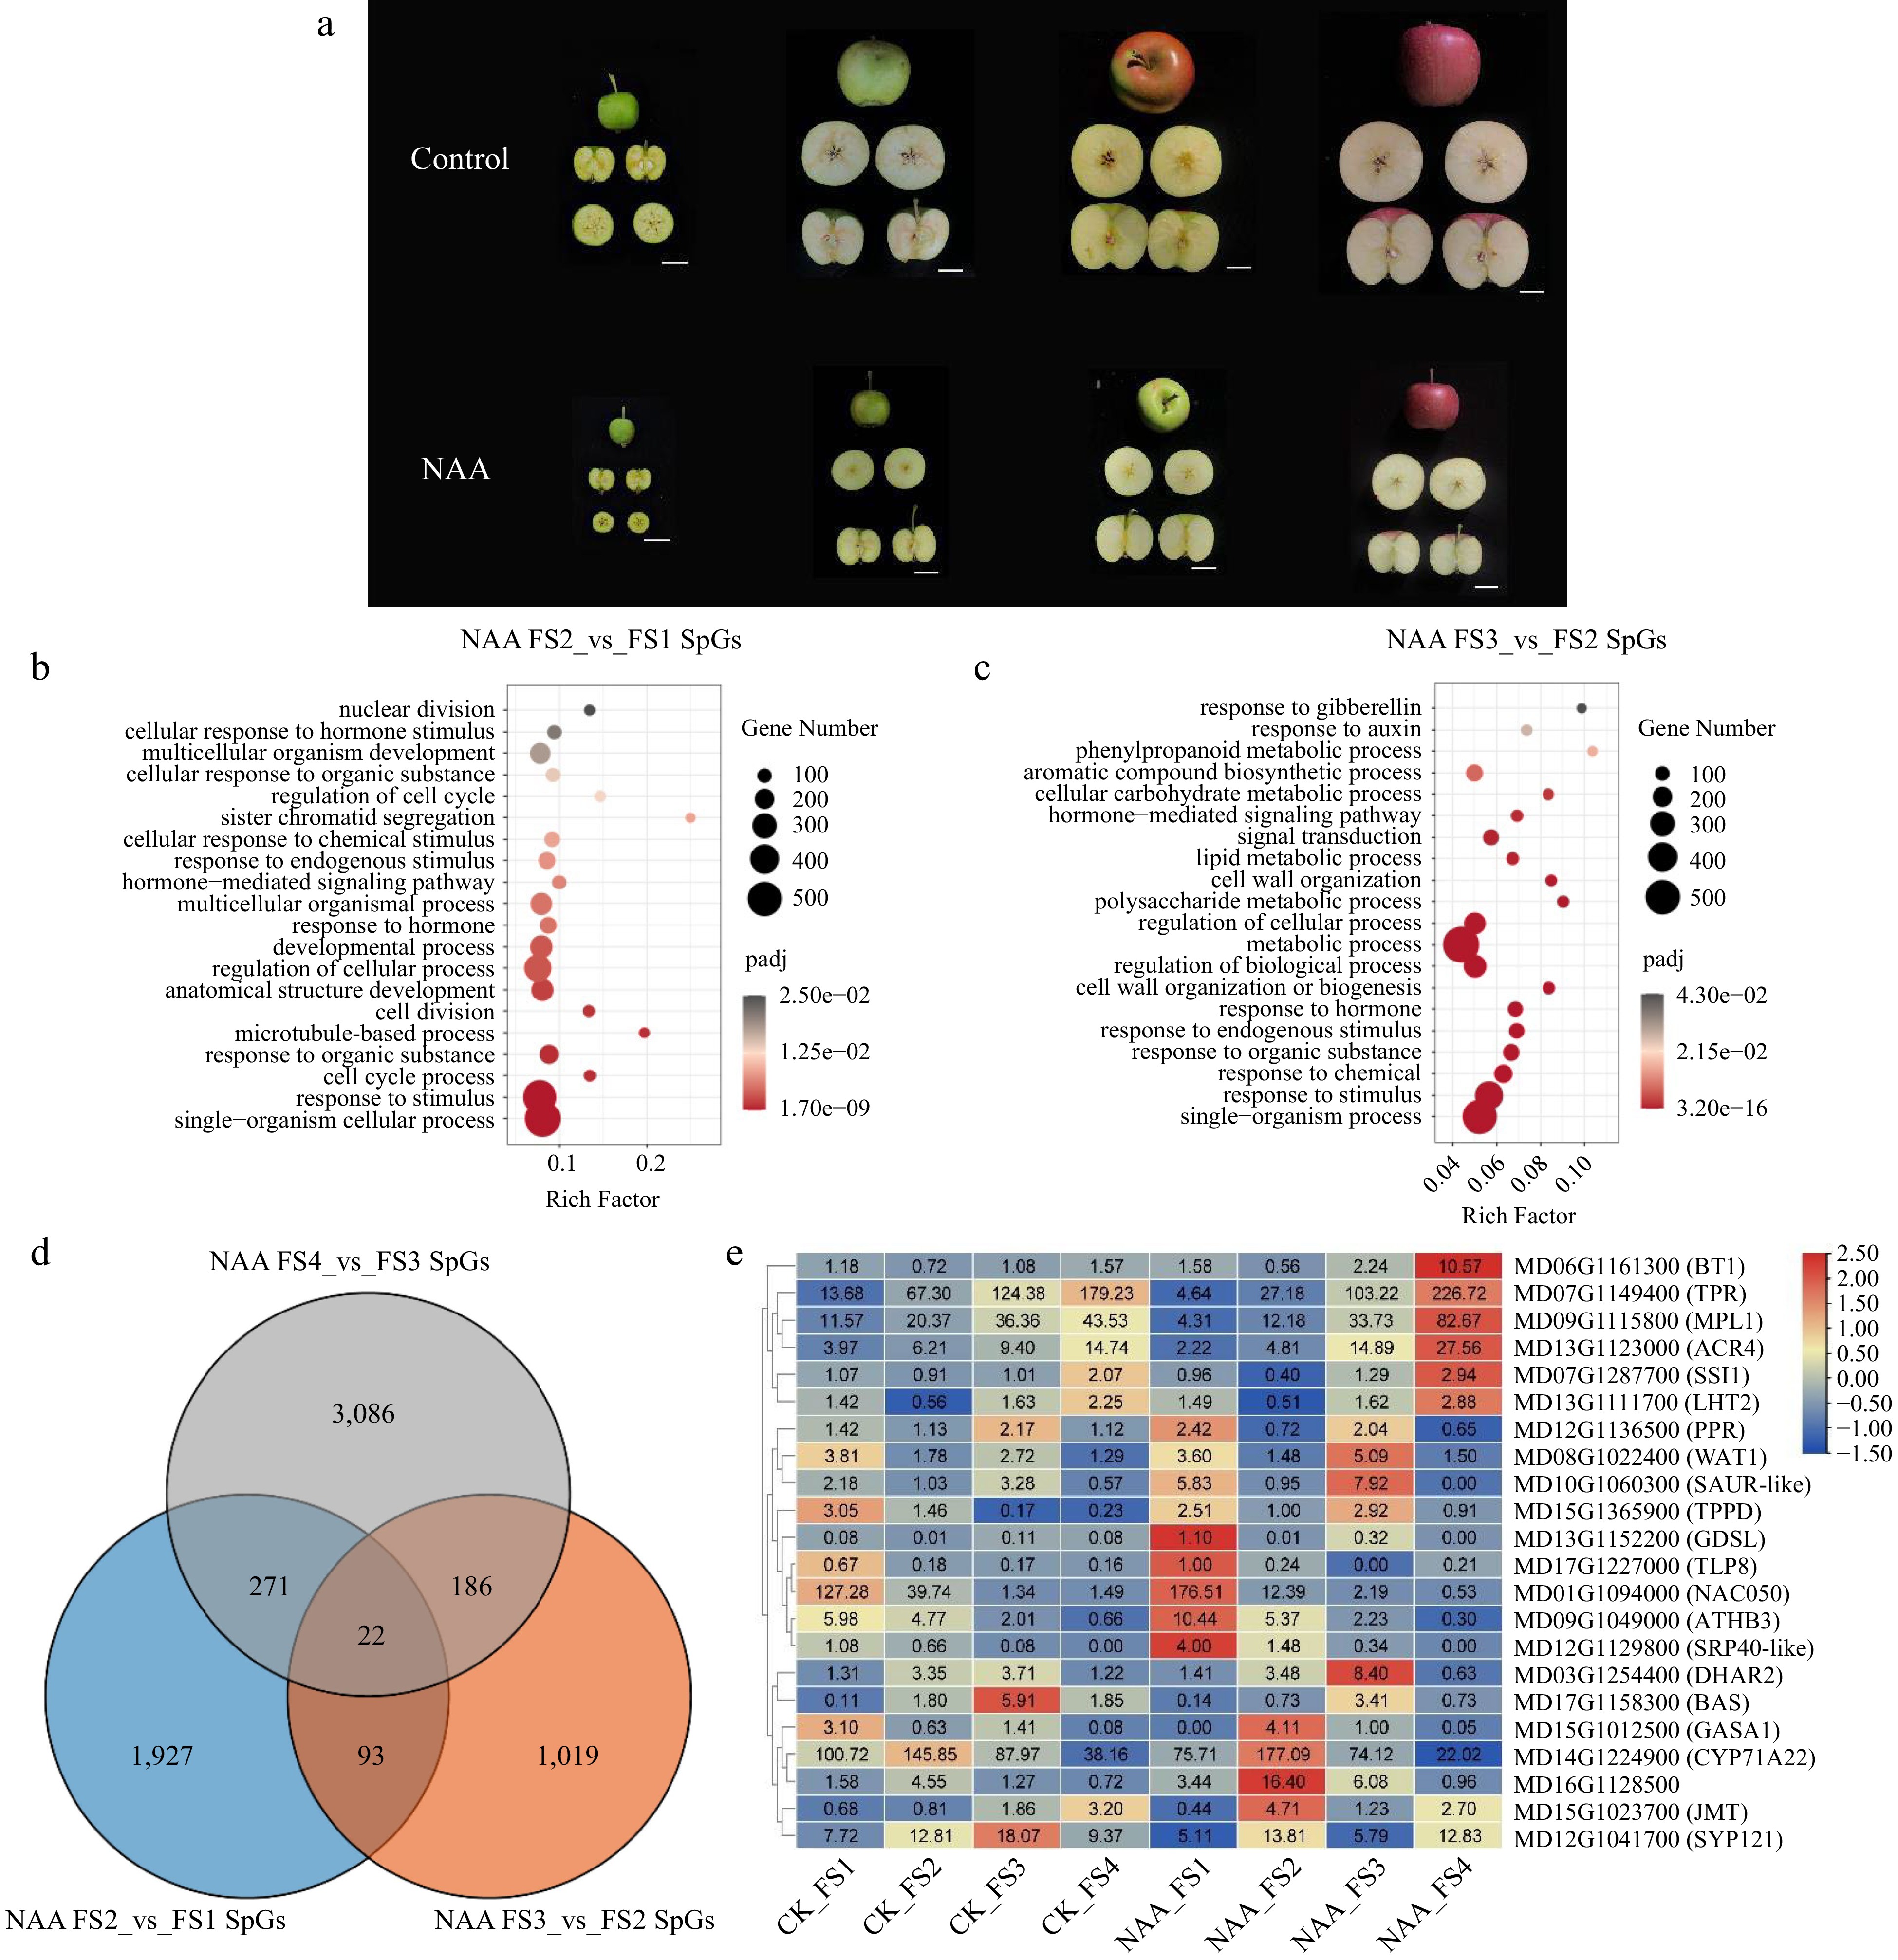
Figure 4.
Transcriptome analysis of fruit NAA-treated phenotypes and NAA-treated specifically expressed genes. (a) Phenotypes of control and NAA treatment. The white scale line is 2.5cm. (b) Enrichment analysis of FS2 vs FS1 specifically expressed genes under NAA treatment. (c) Enrichment analysis of FS3 vs FS2 specifically expressed genes under NAA treatment. (d) Venn of genes specifically expressed at different stages of combination under NAA treatment. (e) The heatmap of the overlap 22 genes from the Venn plot at the FPKM level.
-
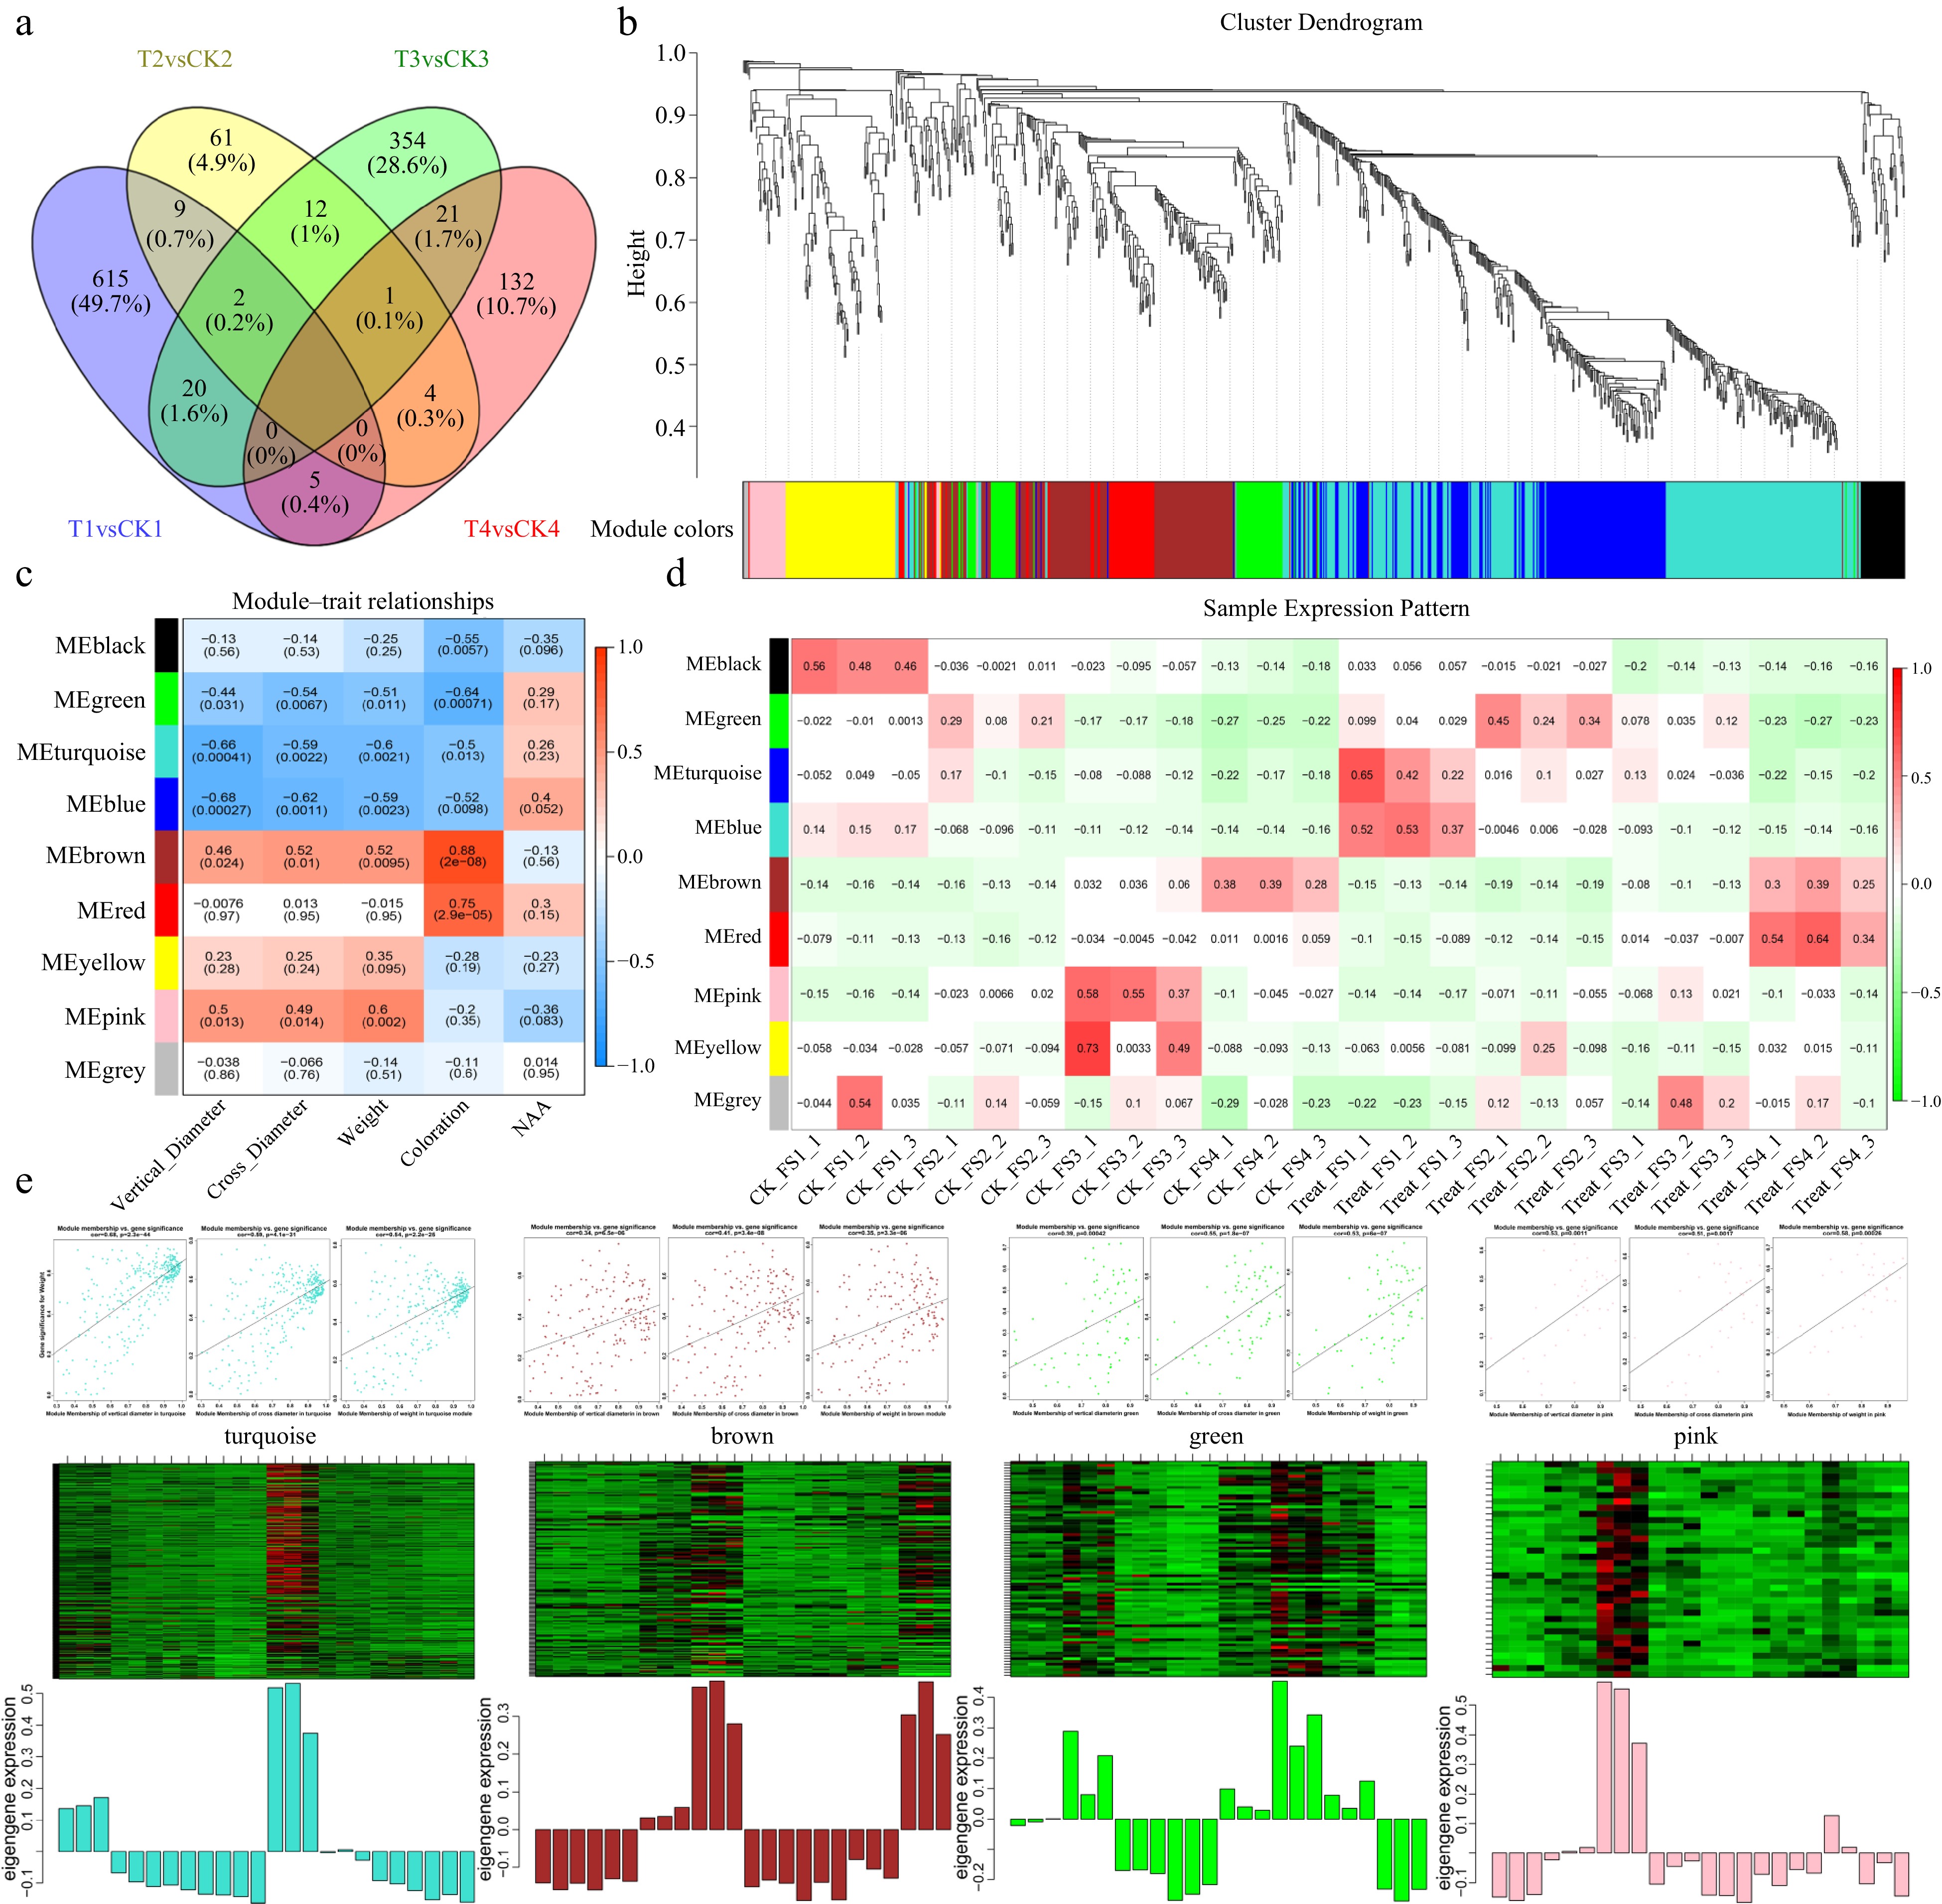
Figure 5.
During the NAA treatment, four stages of differences and WGCNA analysis. (a) Venn plot of differential genes in four stages for NAA treatment vs control. (b) Hierarchical cluster tree of the 990 genes colored by different modules. (c) Module-trait relationship correlation patterns. (d) Correlation between modules and different samples. (e) Visualization of the expression level and correlation of GS with MM and modules. The GS and MM correlation point plots are arranged by vertical diameter, cross diameter, and weight.
-
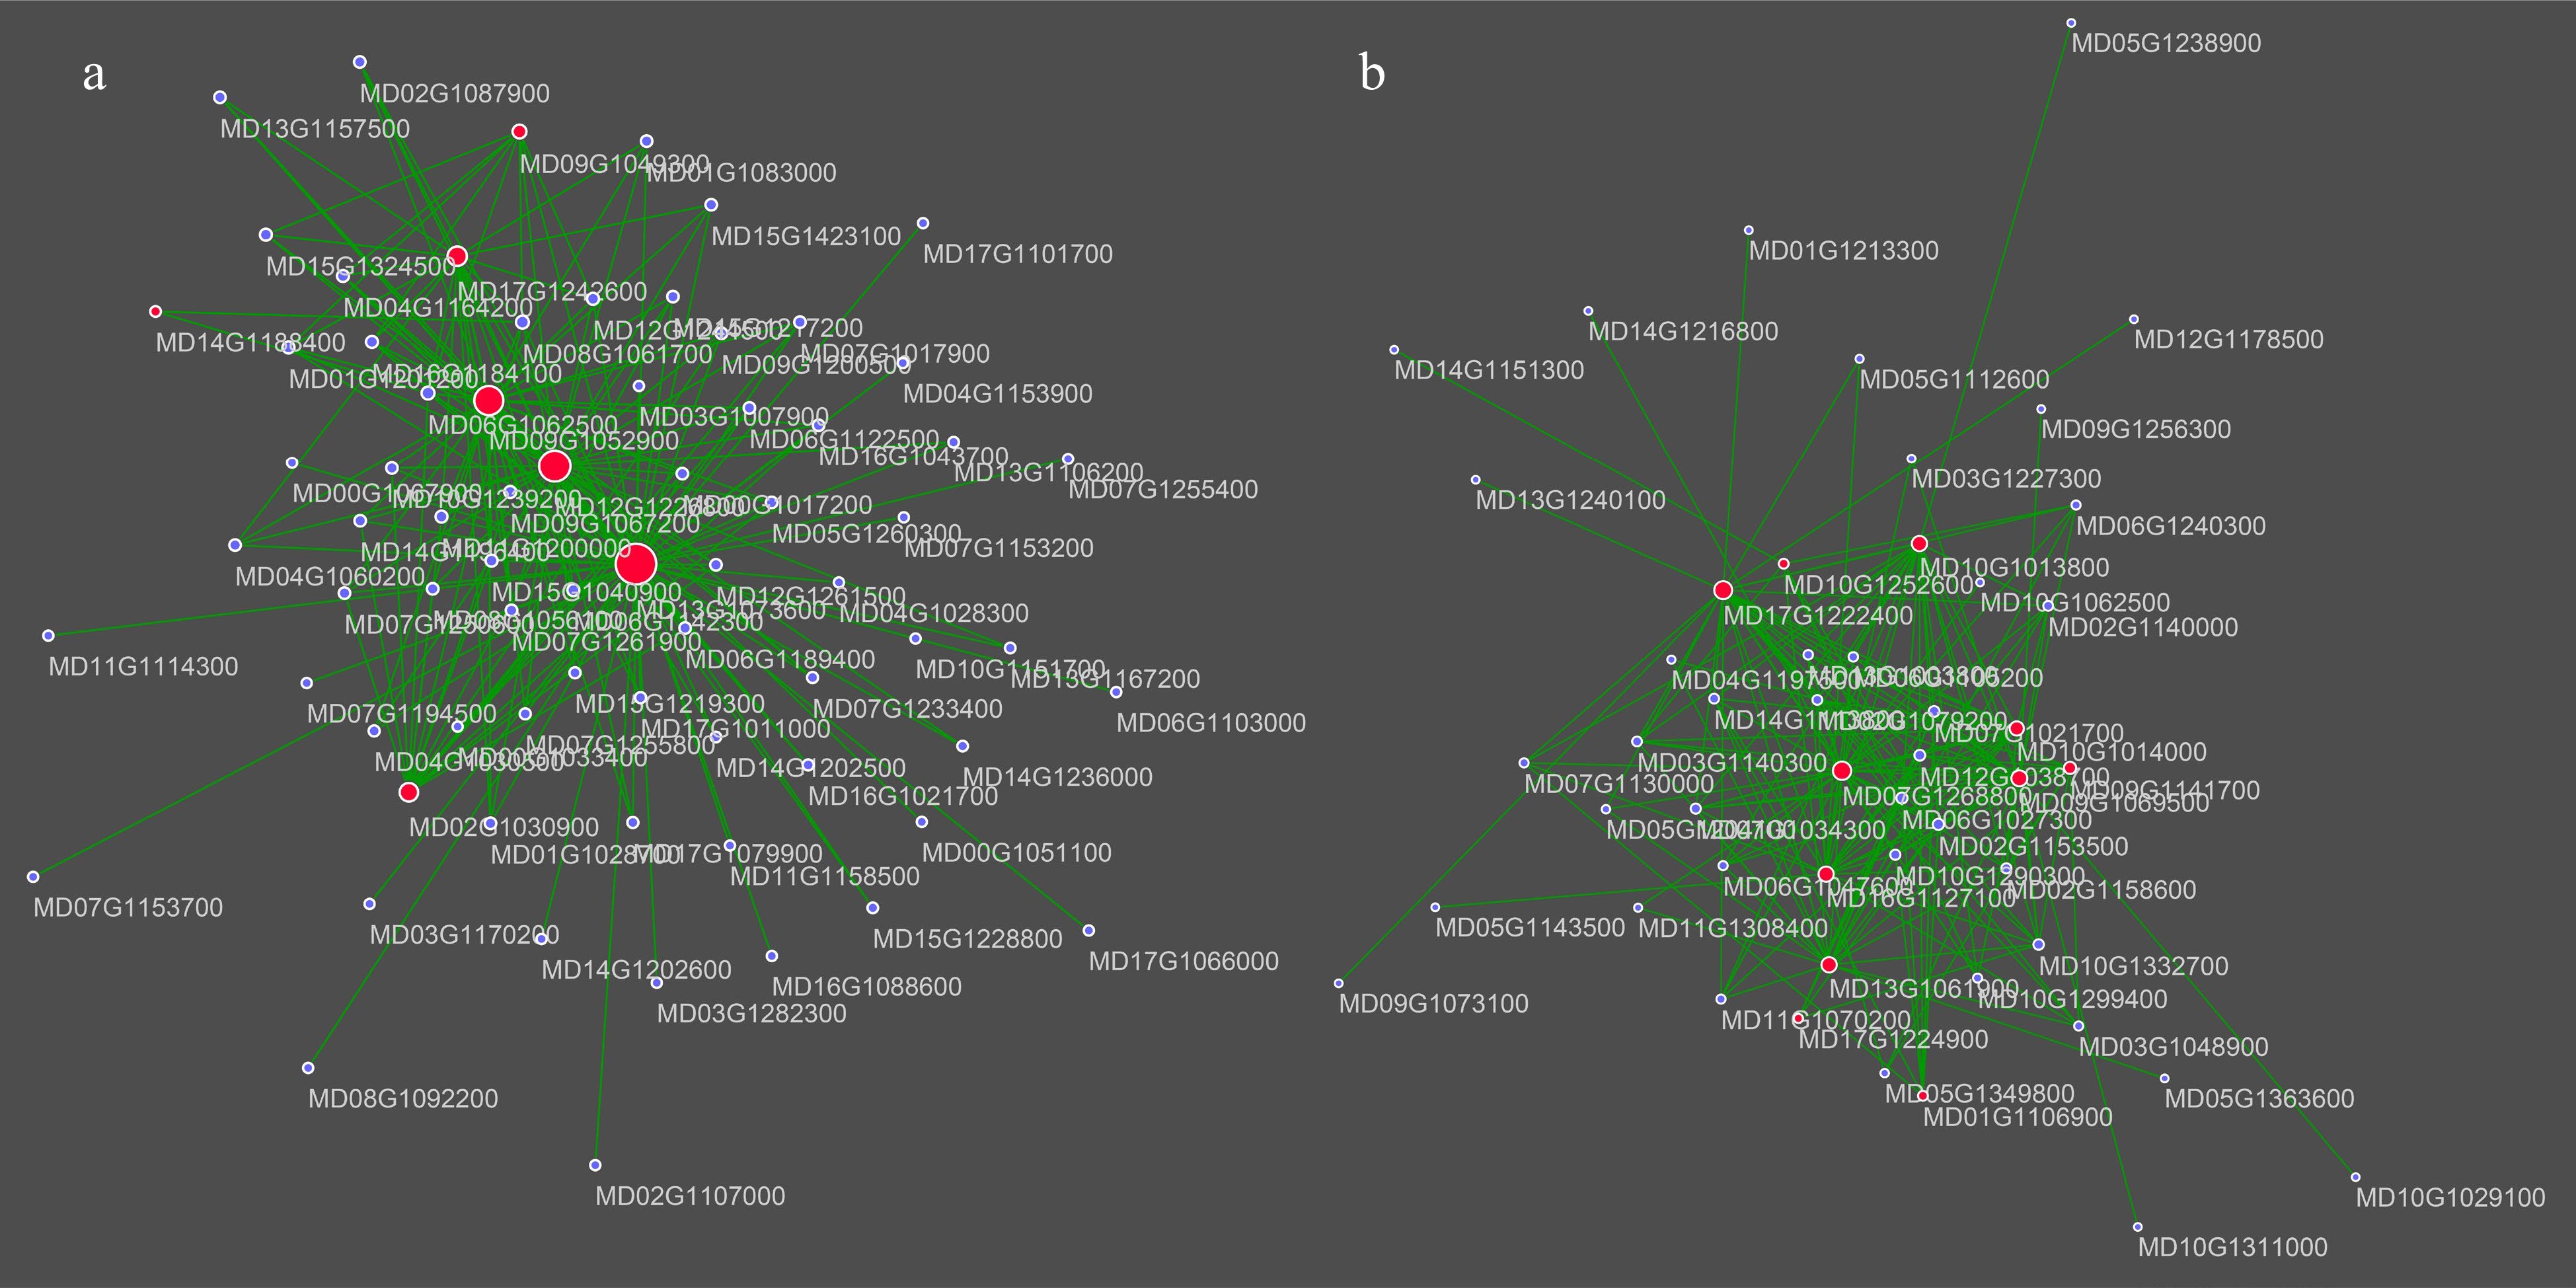
Figure 6.
Visualization of the selected hub genes and the top 200 connections in the different stage-specific modules. (a) Co-expression network of turquoise module-related genes. (b) Co-expression network of brown module-related genes. Point size represents the degree of the layout. Hub genes are marked with the red.
-
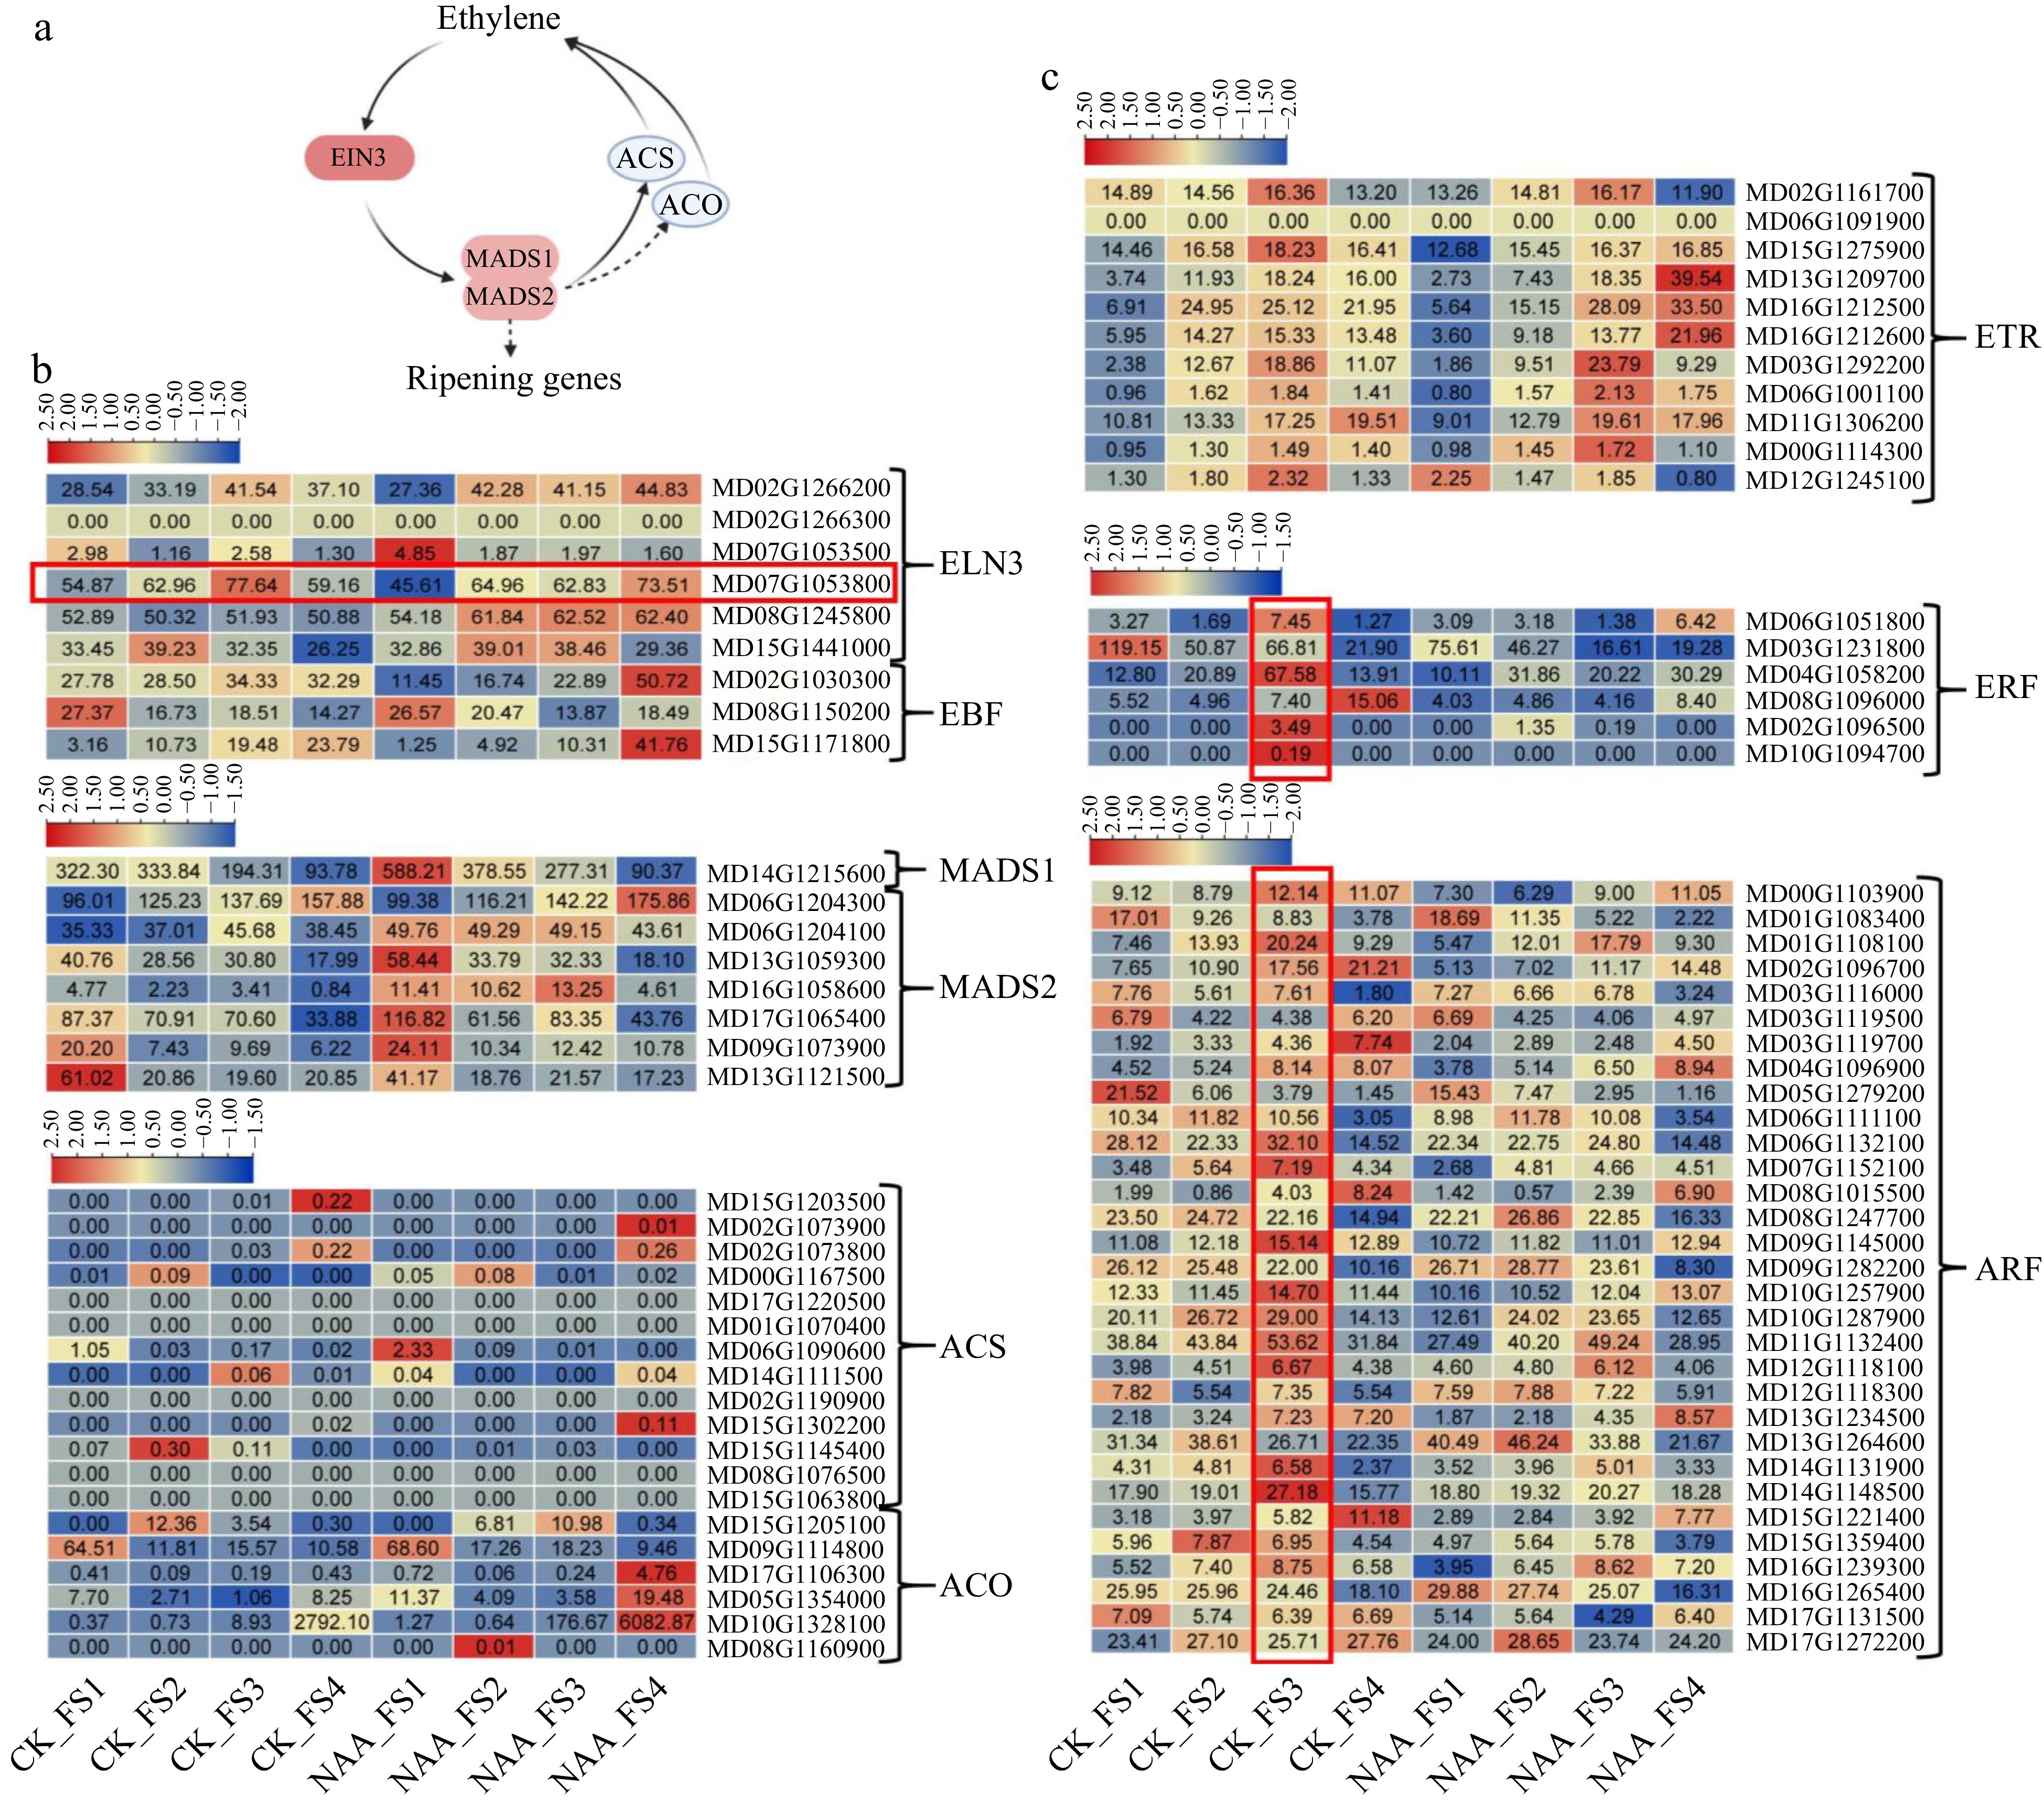
Figure 7.
Expression changes of known genes involved in apple fruit development and ripening process. (a) Model of apple fruit ripening was proposed by a previous study[40]. (b) Expression changes of genes involved in the apple fruit ripening. (c) Known genes associated with fruit development and ripening.
-
Treatment Single fruit weight (g) Fruit shape index Contents of soluble sugar (%) Titratable acid content (%) Acid-sugar ratio Carbaryl 500 mg/L 232.31ab 0.83d 12.24c 0.23ab 53.22de Carbaryl 1,000 mg/L 221.58abc 0.82cd 12.80b 0.21bc 60.95c Carbaryl 2,000 mg/L 251.24a 0.82cd 13.47a 0.21d 64.14b 6-BA 0.1 g/L 221.16bc 0.84bc 12.30c 0.22bcd 55.91d 6-BA 0.2 g/L 213.53c 0.85ab 13.61a 0.21d 64.81b 6-BA 0.3 g/L 235.34ab 0.86a 13.32b 0.20cd 66.60a NAA 10 mg/L 105.99e 0.80de 10.47d 0.25a 41.88g NAA 20 mg/L 103.31e 0.83d 12.38cd 0.23ab 53.83de NAA 30 mg/L 89.81f 0.82cd 10.80d 0.21bc 51.43f Control 208.08d 0.82bc 11.47cd 0.21d 54.62d Different lowercase letters indicate statistical significance between the tested cultivars at p < 0.05. Table 1.
Effect of different concentrations of fruit thinning agent on fruit quality.
Figures
(7)
Tables
(1)