-
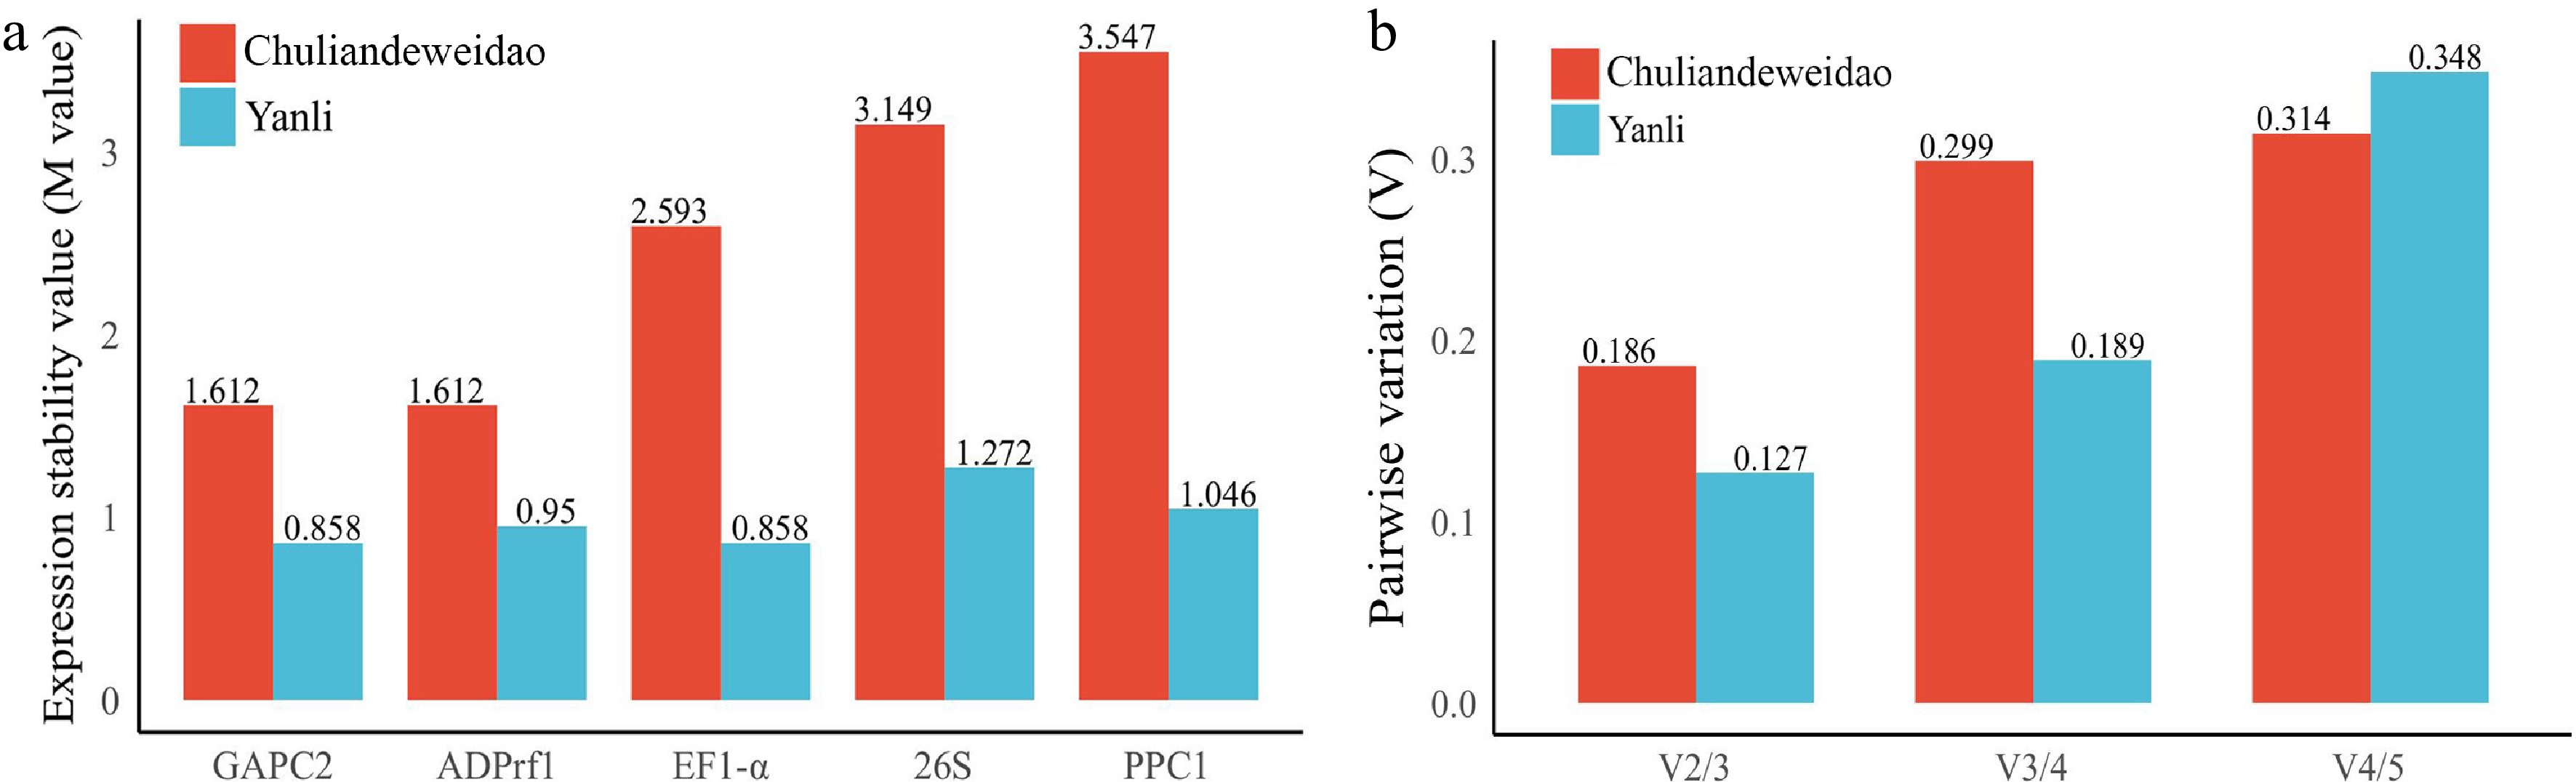
Figure 1.
Expression stability value of five candidate reference genes calculated by geNorm in 'Yanli' and 'Chuliandeweidao'. (a) M value of five candidate reference genes. A lower M-value indicates more stable gene expression. (b) Pairwise variation (V) analysis of five candidate reference genes. A lower value indicates a more stable combination number of reference genes.
-
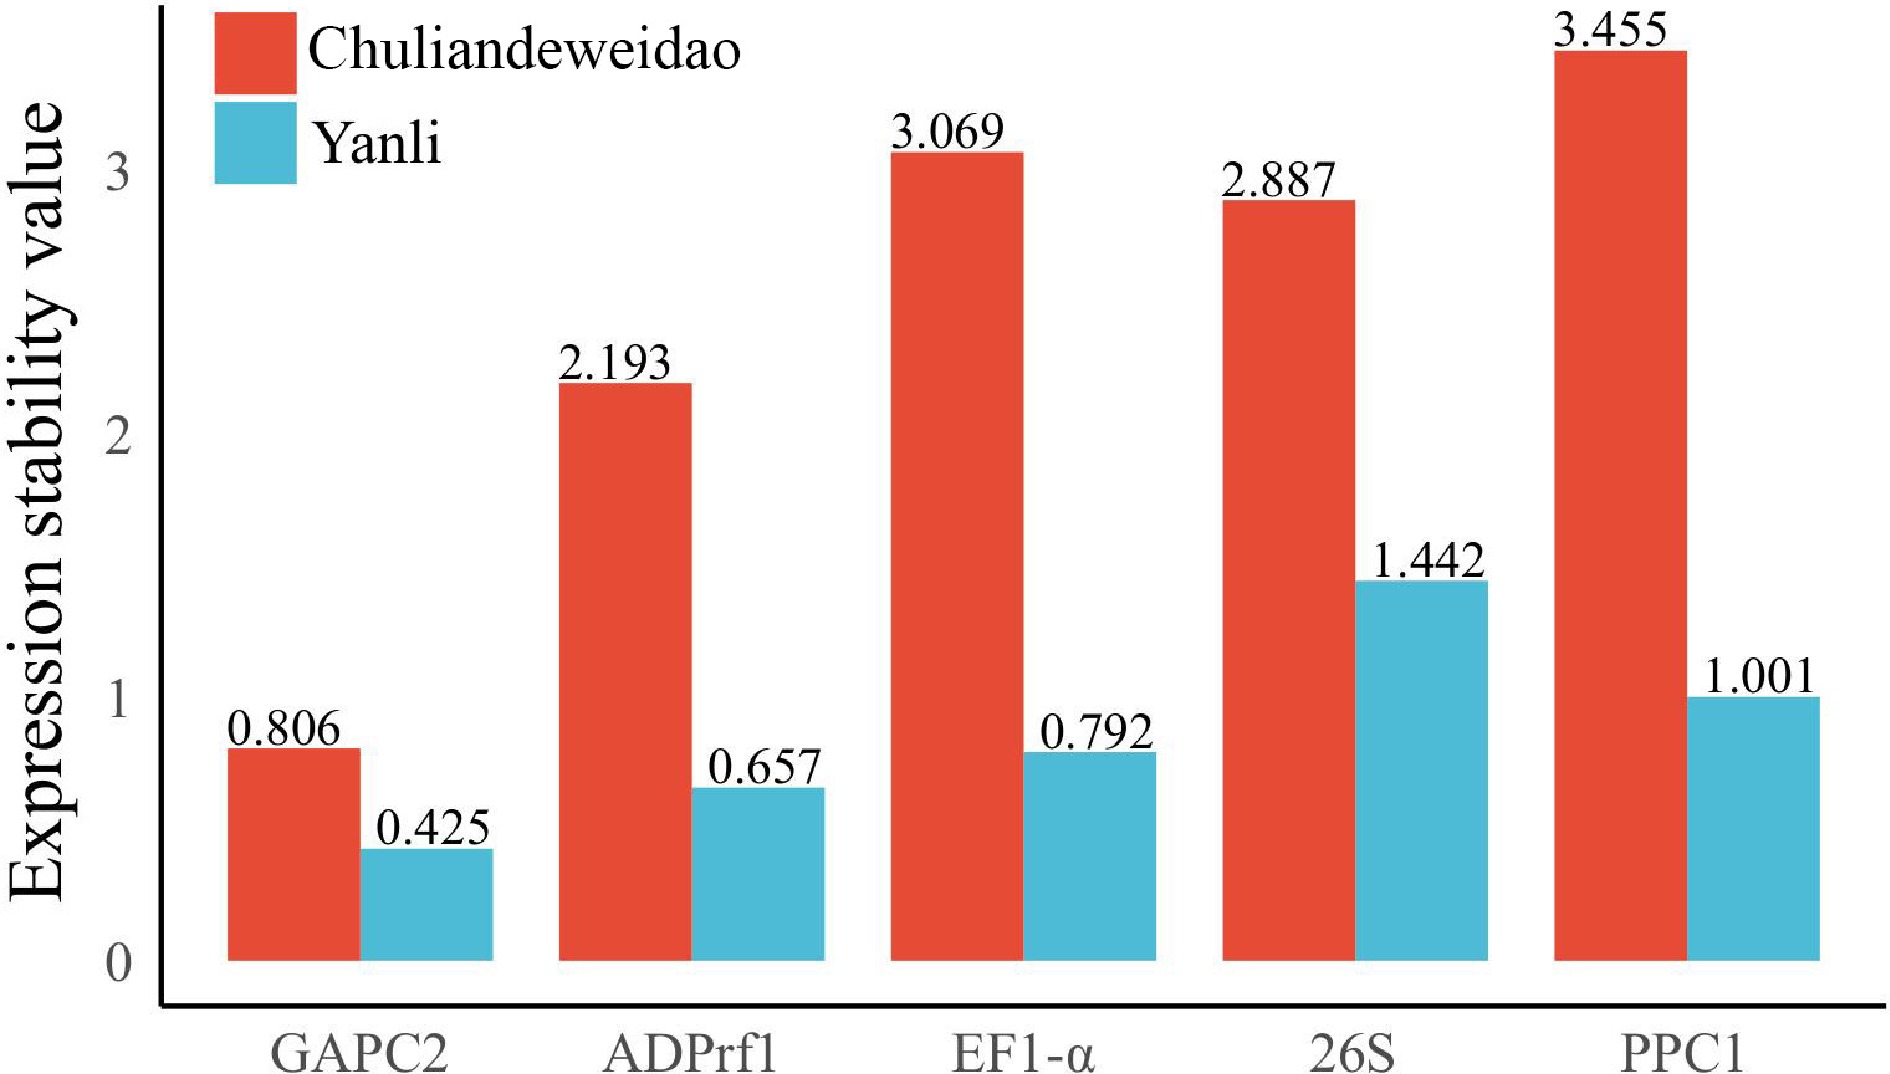
Figure 2.
Expression stability value of five candidate reference genes calculated by NormFinder in 'Yanli' and 'Chuliandeweidao'. A lower value indicates more stable gene expression.
-

Figure 3.
Expression stability value of five candidate reference genes calculated by BestKeeper in 'Yanli' and 'Chuliandeweidao'. A lower value indicates more stable gene expression.
-
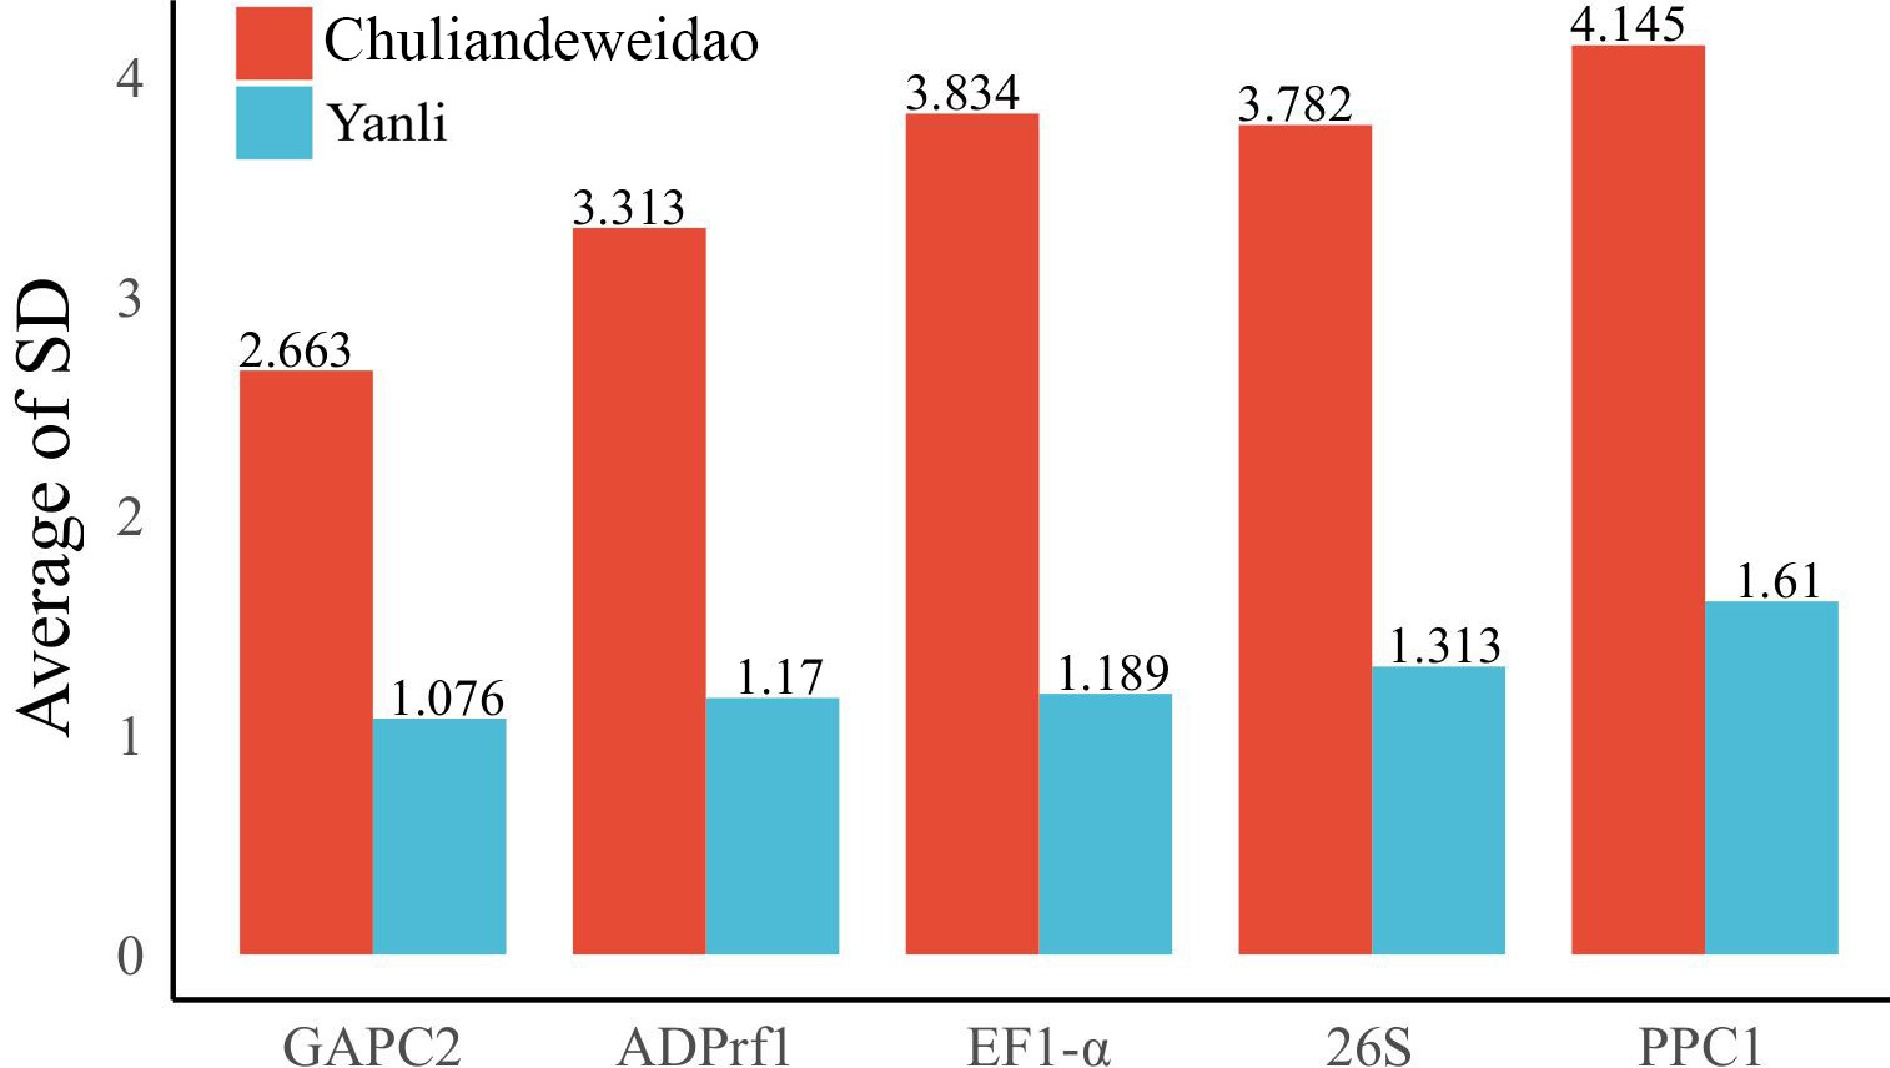
Figure 4.
Expression stability value of five candidate reference genes calculated by delta-CT method in 'Yanli' and 'Chuliandeweidao'. A lower value indicates more stable gene expression.
-
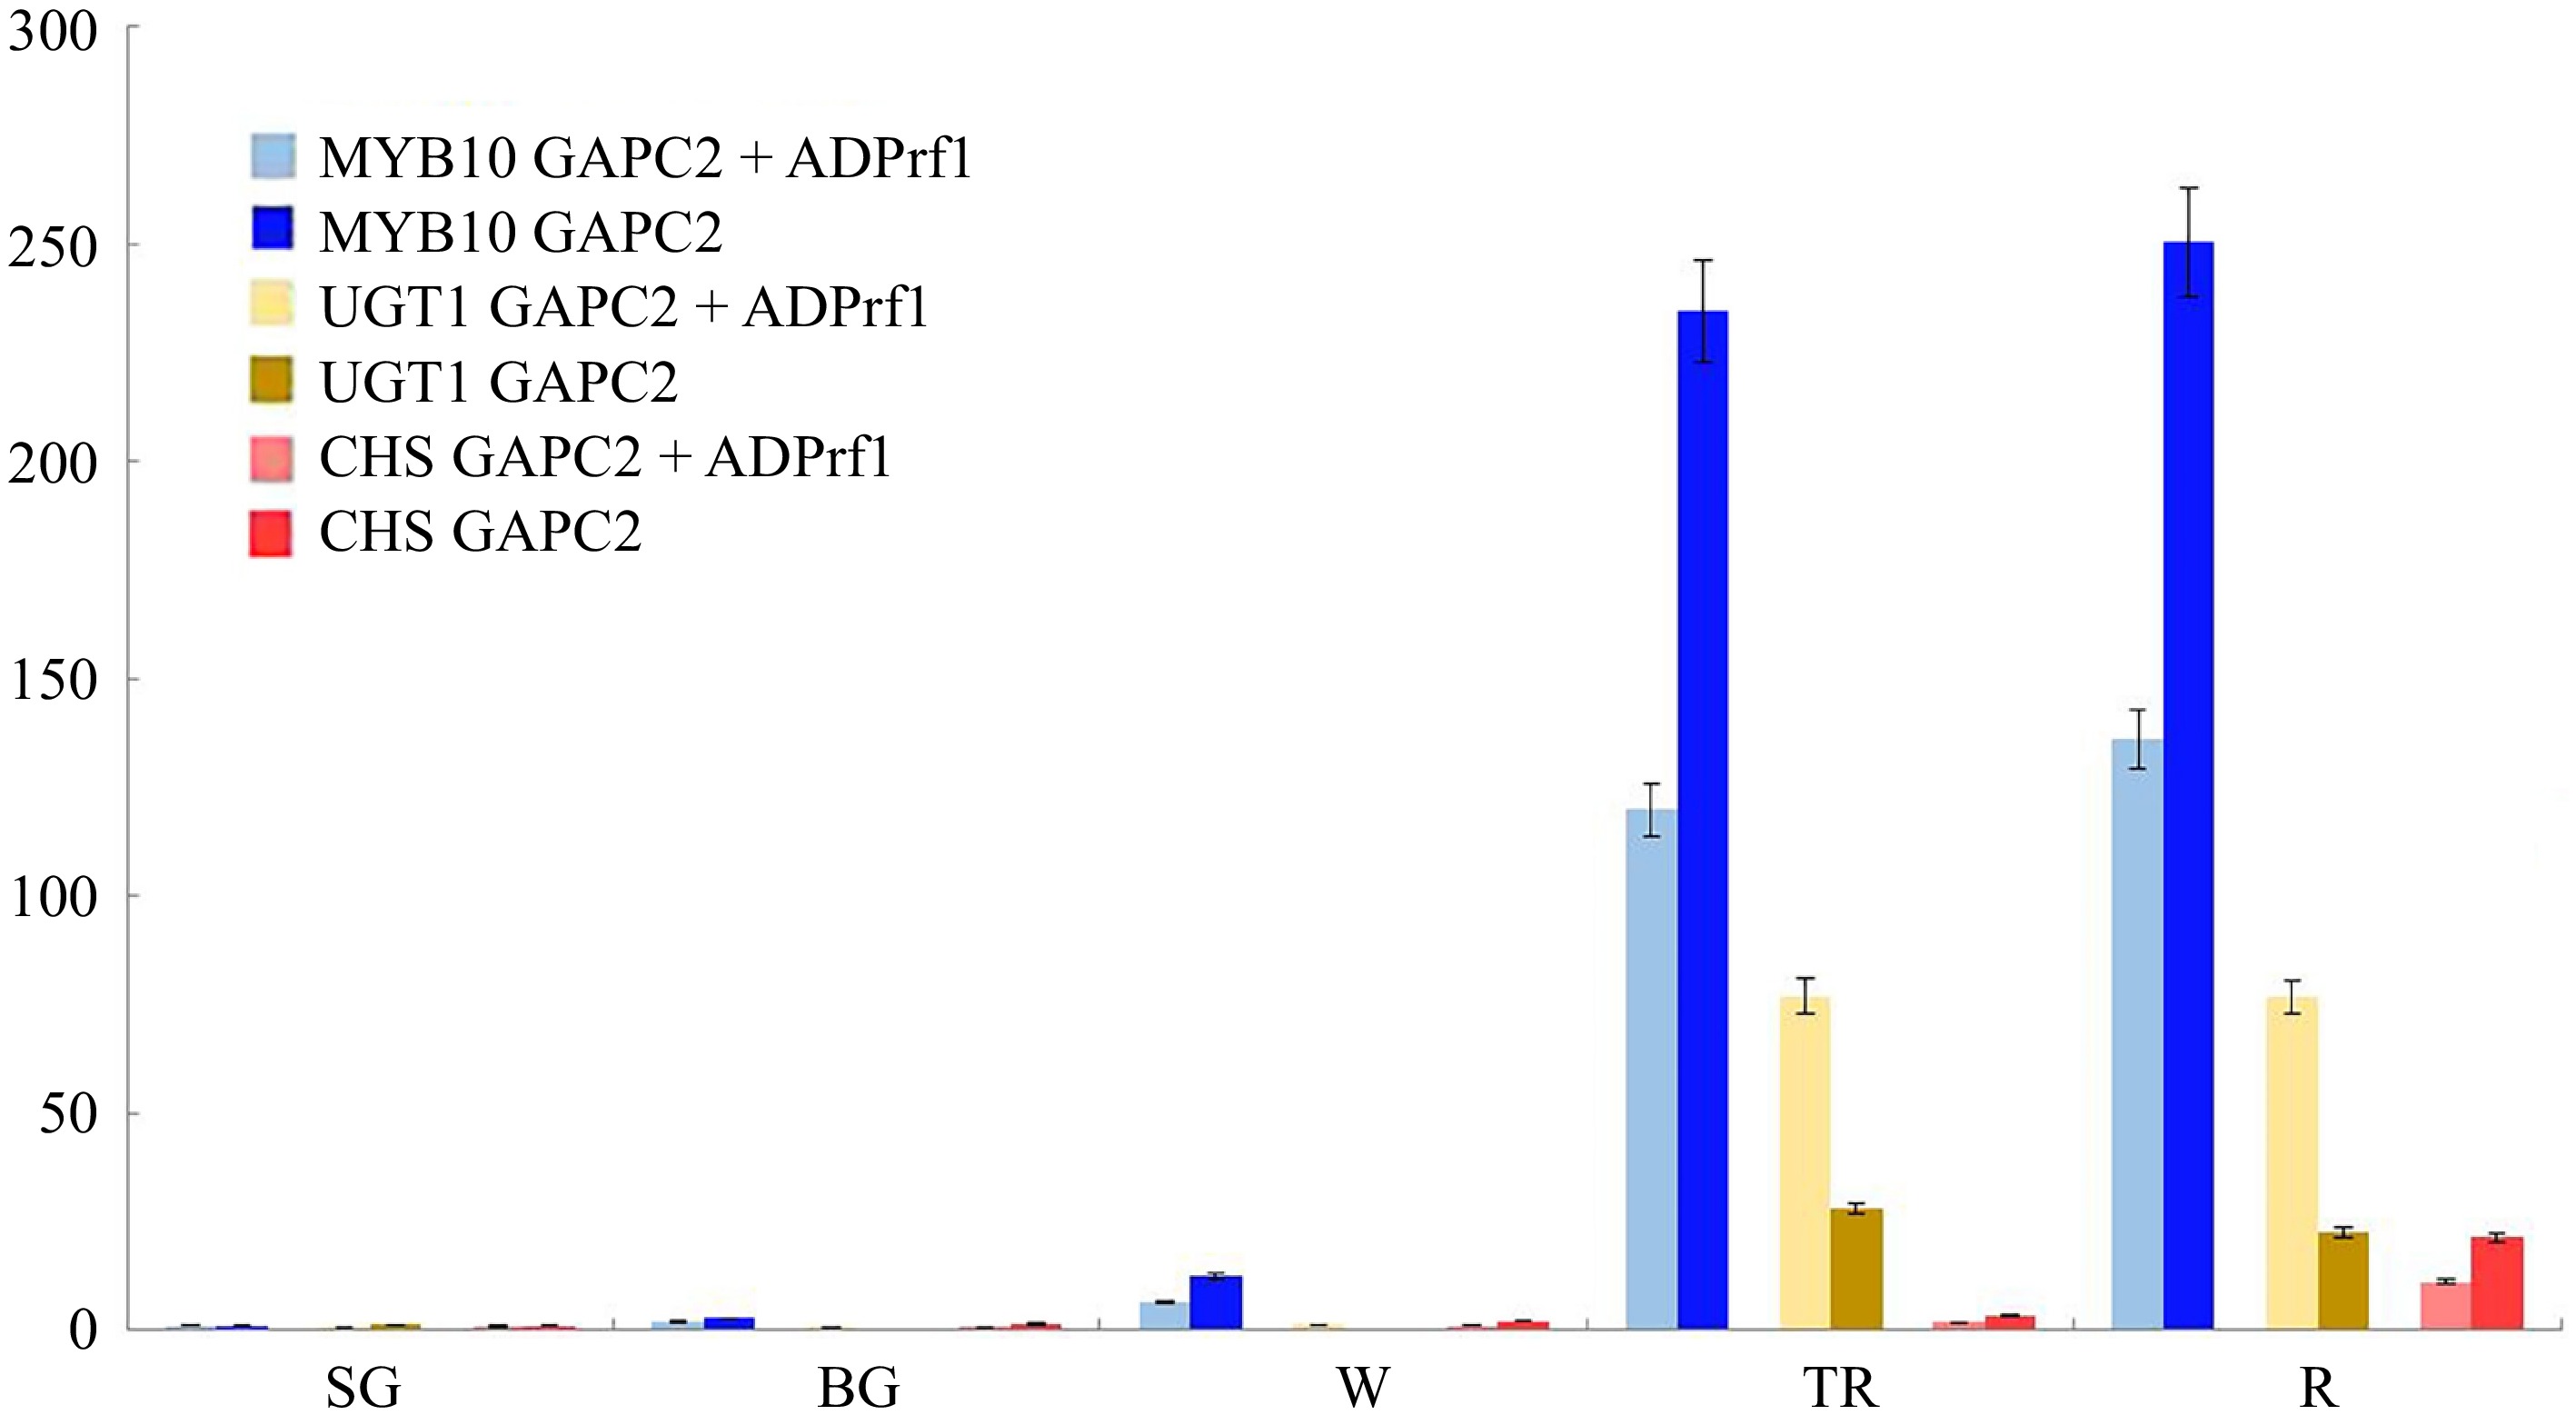
Figure 5.
Relative expression levels of FaMYB10, FaUGT1, and FaCHS in five different development stages of 'Yanli' fruit. The bars of different colors represent the relative expression levels of the validation genes calculated using different reference genes. (SG = Small Green, BG = Big Green, W = White, TR = Turning Red, R = Red).
-
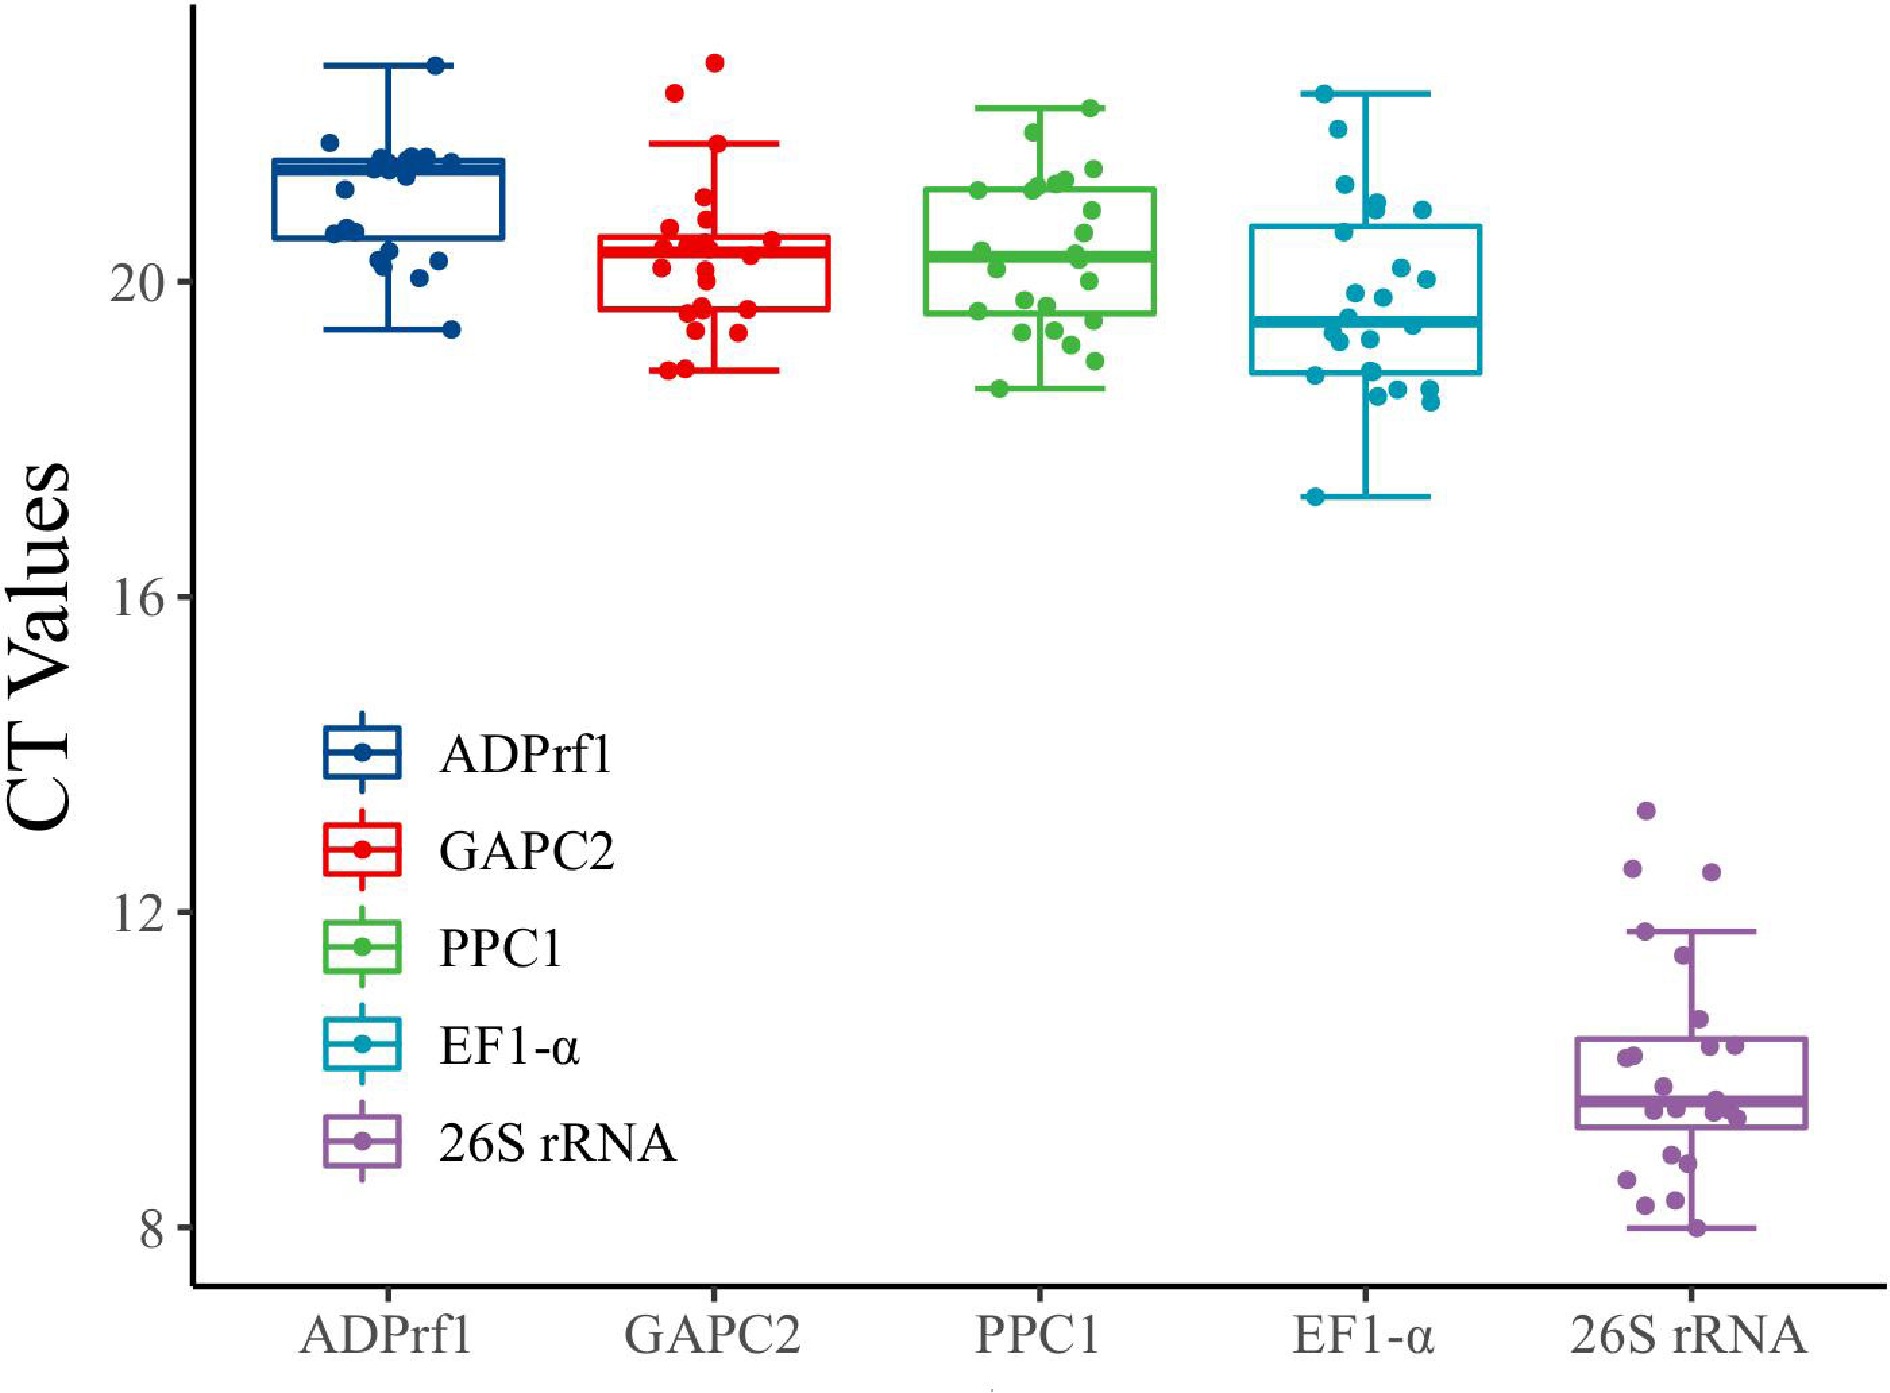
Figure 6.
Boxplot analysis of the expression profiles of FaADPrf1, FaGAPC2, and Fa26S rRNA in root, crown stem, leaf, flower, and five fruit developmental stages. Solid dots represent the expression cycle threshold (CT) values of candidate reference genes in different organs. The line across the box represents the median. The boxes represent the 25/75 percentiles.
-
Gene symbol Gene name Primer sequence (5'-3') Amplification length (bp) Amplification efficiency (%) Correlation coefficiency (R2) ADPrf1 ADP–ribosylation factor 1 F: 5'-TGCGAATTCTGATGGTCGGT-3'
R: 5'-CTCCACAATGGACGGATCTT-3'144 bp 95.43% 0.9984 GAPC2 Glyceraldehyde-3-phosphate dehydrogenase F: 5'-GAATCAACGGATTCGGAAGA-3'
R: 5'-ACAATATCGGCACCAACTGA-3'231 bp 101.51% 0.9996 EF1-α Elongation factor 1 - alpha F: 5'-CACATCAACATTGTGGTCAT-3'
R: 5'-GTCTCAAACTTCCACAAGGC-3'187 bp 99.69% 0.9984 PPC1 Peptidyl-prolyl cis-trans isomerase 1 F: 5'-TACAAGGGATCGTCCTTCCA-3'
R: 5'-ACCCAACCTTCTCGATGTTC-3'258 bp 89.21% 0.9955 26S rRNA 26S ribosomal RNA F: 5'-TAACCGCATCAGGTCTCCAA-3'
R: 5'-CTCGAGCAGTTCTCCGACAG-3'132 bp 95.69% 0.9996 Table 1.
Primers sequence and amplification characteristics of five candidate reference genes.
-
Rank Yanli Chuliandeweidao Gene name Ranking value Gene name Ranking value 1 GAPC2 1.32 GAPC2 1.00 2 ADPrf1 1.86 ADPrf1 1.68 3 EF1-α 2.59 26S 3.22 4 26S 3.98 EF1-α 3.72 5 PPC1 4.00 PPC1 5.00 Table 2.
The comprehensive ranking of five candidate reference genes in 'Yanli' and 'Chuliandeweidao' analyzed by RefFinder.
Figures
(6)
Tables
(2)